

Abstract
Sediment microbial fuel cells (SMFCs) have been used as renewable power sources for sensors in fresh and ocean waters. Organic compounds at the anode drive anodic reactions, while oxygen drives cathodic reactions. An understanding of oxygen reduction kinetics and the factors that determine graphite cathode performance is needed to predict cathodic current and potential losses, and eventually to estimate the power production of SMFCs. Our goals were to (1) experimentally quantify the dependence of oxygen reduction kinetics on temperature, electrode potential, and dissolved oxygen concentration for the graphite cathodes of SMFCs and (2) develop a mechanistic model. To accomplish this, we monitored current on polarized cathodes in river and ocean SMFCs. We found that (1) after oxygen reduction is initiated, the current density is linearly dependent on polarization potential for both SMFC types; (2) current density magnitude increases linearly with temperature in river SMFCs but remains constant with temperature in ocean SMFCs; (3) the standard heterogeneous rate constant controls the current density temperature dependence; (4) river and ocean SMFC graphite cathodes have large potential losses, estimated by the model to be 470 mV and 614 mV, respectively; and (5) the electrochemical potential available at the cathode is the primary factor controlling reduction kinetic rates. The mechanistic model based on thermodynamic and electrochemical principles successfully fit and predicted the data. The data, experimental system, and model can be used in future studies to guide SMFC design and deployment, assess SMFC current production, test cathode material performance, and predict cathode contamination.
Introduction
Sediment microbial fuel cells (SMFCs) have recently procured considerable scientific interest due to their potential relevance in niche energy applications, namely powering devices in remote areas. Example devices include water-based sensors, telemetry devices including acoustic receivers/transmitters, and other oceanographic and environmental instruments.1–4 As a power source, SMFCs have the advantages of long-term power generation, maintenance-free operation, remote deployment capabilities, no generation of toxic components, and a potentially lower financial cost compared to typical power sources. For SMFCs to become economically practical for widespread use, two related shortcomings need to be overcome: inadequate cell potential and limited current output. Over the past two decades, researchers have begun to address these issues through numerous scientific studies, which have been reviewed.5–8 Despite significant advances to date, a better understanding of the reaction kinetics occurring at the cathode is needed, as this has generally been neglected in favor of anodic research and offers an area where appreciably more improvements can be made.
SMFCs generate energy through microbiologically catalyzed redox reactions and/or other biogeochemical redox reactions. Specifically, organic detritus from aquatic sediments is oxidized at the anode by a mixed consortium of anode-respiring microorganisms, releasing electrons to the anode and generating metabolites and protons.1,3,9 For most SMFCs, the cathode completes the circuit through the oxygen reduction reaction (ORR), in which dissolved oxygen (DO) is reduced to water:10–13
| (1) |
Because oxygen is ubiquitous in the places where SMFCs are commonly deployed and because it has a relatively high reduction potential, it is an ideal terminal electron acceptor.10 However, the graphite cathodes that are commonly used in SMFCs are not able to fully exploit oxygen as an electron acceptor because of large potential losses. Fig. 1 shows how potential losses restrict the amount of power available for the SMFC. These losses are a large factor controlling the reduction kinetics at the cathode. One way to increase cathodic current density is to minimize these losses. Unlike catalytic electrodes, non-catalytic carbon cathodes require a large overpotential to drive oxygen reduction, which significantly lowers the power output of these devices through slower reduction kinetics.10 Despite the less than ideal performance of graphite cathodes, graphite or other carbon-based electrodes are routinely used in SMFCs, primarily because of their significantly lower cost compared to catalytic or noble metal electrodes.12 Furthermore, the anode is generally believed to be the current-limiting electrode, so cathode performance has not been studied as a critical factor for microbial fuel cell (MFC) design. In fact, cathodes appear to be current-limiting in some MFC designs, including in SMFCs, depending on the anode and cathode sizes and environmental conditions such as temperature, electrode potential, and dissolved oxygen concentration.14–16
Fig. 1.
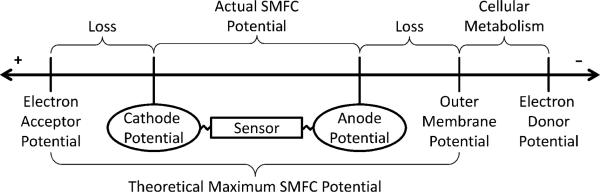
Potential losses at both the anode and the cathode restrict the amount of power that remains for the SMFC to operate sensors. Cellular metabolism utilizes an electron donor to produce energy for maintenance and replication, yielding an electron-accepting metabolite with a standard reduction potential equal to the outer membrane potential. Potential losses at the anode caused by extracellular electron transfer, electrode activation, electrical resistance, and concentration losses result in a more positive anode potential with respect to the outer membrane potential of the cells. Activation, ohmic, and concentration losses also reduce the cathode potential, lowering the potential from that of the electron acceptor. The theoretical maximum SMFC potential could be obtained if the cathode potential matched the electron acceptor standard reduction potential and the anode potential matched the outer membrane potential of the cells. The distances on the line are not drawn to scale.
Several studies have been performed to understand and improve MFC cathode performance.17–21 Chen et al. explored the microbial community constituents of long-term biocathodes.22,23 Schaetzle et al. used laccase enzyme to catalyze oxygen reduction in an MFC,24 and Cao et al. used an illuminated biocathode to utilize carbon dioxide as a terminal electron acceptor.25 Some recent research has focused specifically on graphite and carbon cathodes in MFCs. Erable et al. used nitric acid and heat to activate graphite granules for use as an MFC cathode.26 They were able to increase the open circuit potential by +400 mV to nearly +800 mVSHE, which is much more than is typical even for platinum-catalyzed cathodes. Several other studies have also explored activated graphite as a cathode material and were able to obtain increased current densities.27–29 Rabaey et al. found that wastewater biofilms on graphite felt cathodes could increase power up to three times, compared to an abiotic control cathode.30 Cheng et al. recently used an anodophilic biofilm grown on graphite to facilitate both cathodic oxygen reduction and substrate oxidation.31 Liang et al. showed that polarizing a graphite biocathode at +242 mVSHE significantly increased the maximum power density in an MFC.32 Graphene, the planar sheets of carbon that are the fundamental structural elements of graphite, was explored by Wu et al.33 It was found that graphene had high catalytic activity for ORR and merits future study for use as an MFC cathode material. Finally, Freguia et al. investigated the reduction kinetics of oxygen on high surface area graphite granules.10 Their study highlighted the fact that catalysts are not requisite to increase MFC power outputs, as long as the cathode surface area is significantly increased to overcome the slow reduction kinetics.
Two studies on graphite/carbon cathodes have been conducted specifically for SMFCs. The first study, by He et al., explored the use of a partially exposed rotating carbon cathode, which resulted in a nearly 70% increase in power due to increased oxygen availability.34 More recently, De Schamphelaire et al. evaluated carbon felt cathodes in both fresh and brackish water laboratory-scale SMFCs, obtaining a maximum power density of 0.123 W m–2.13 Most of the literature described above focused on testing materials or reactor designs to improve cathode performance. However, mechanistic work is also needed to understand the limitations of the cathodes. To the best of our knowledge, the oxygen reduction kinetics on graphite cathodes in SMFCs have not been explored. An understanding of cathode kinetics is needed to predict potential losses and cathodic current, and to estimate factors that affect them.
Our goals were to (1) experimentally quantify the dependence of oxygen reduction kinetics on temperature, electrode potential, and dissolved oxygen concentration for graphite cathodes of SMFCs and to (2) develop a mechanistic model. Laboratory-scale SMFCs were operated using sediment and water from a river (South Fork Palouse River) and an ocean (Oregon Coast Pacific Ocean), mimicking the environments in which SMFCs are normally operated. We monitored current on the polarized cathodes using a potentiostat, and water temperature or oxygen concentrations in the SMFCs were changed. A mechanistic model was developed to predict current as a function of electrode potential and temperature. Finally, scanning electron microscopy (SEM) and energy-dispersive X-ray spectroscopy (EDS) were used to image the cathode surface and provide elemental analysis of surface deposits.
Materials and methods
Laboratory-scale sediment microbial fuel cells
Four temperature-controlled laboratory-scale SMFCs were constructed: two river SMFCs and two ocean SMFCs. The SMFCs had a sediment layer that contained the anodes and a water layer where the cathodes were placed. Each SMFC was purged with bubbling air and the water level was maintained by adding purified water as needed. The details of the SMFC setup and construction are given in the ESI.†
Ground finish isomolded graphite plates (Glassmate grade GM-10, Poco Graphite, Inc., Decatur, TX, USA), which were 2.5 cm wide × 2.5 cm long × 3 mm thick, were used for all electrodes. The projected total surface area of each cathode was 1.55 × 10⁻³ m2. Two cathodes were placed in each SMFC, one to run polarization experiments and the other to monitor open circuit potential (OCP). Under normal conditions all electrodes were kept in an OCP configuration at room temperature (~20 °C). The SMFCs were run for a minimum of 45 days before the polarization experiments were performed to ensure that the electrodes had time to equilibrate and reach a steady OCP value. Custom-made saturated Ag/AgCl electrodes were used as the reference in all experiments. However, all potentials in this study are reported versus the standard hydrogen electrode (SHE).
Polarization experiments
Because cathodic current is directly proportional to the oxygen reduction kinetic rate, it is possible to use a potentiostat to monitor the reduction kinetics indirectly, through chronoamperometry-like experiments. Current production was monitored over time at a range of polarization potentials to measure the dependence of the oxygen reduction kinetics on temperature, electrode potential, and dissolved oxygen concentration. Each polarization potential was held for two hours to ensure that the current had reached a steady state, which was generally reached within 30 minutes or less. The final 10 minutes of steady state current data were averaged for each SMFC and were used to calculate the standard deviation for the data point. The data point represented the equilibrium current for the given polarization potential. Only a single working electrode was polarized in each SMFC at a time to avoid interaction artifacts. Because of the number of experiments and repetitions, a custom-made multi-channel potentiostat system was made for polarizing the cathodes (Fig. S1, ESI†). Details of this system are provided in the ESI,† along with full details of the polarization experiments and data analysis.
Four different temperatures were tested for each SMFC, ranging from a low temperature of 8.7 °C to a high of 23.7 °C. In order to test the dependence of the oxygen reduction kinetics on DO concentrations at different polarization potentials, the oxygen concentration was reduced by adding nitrogen gas (UN 1066, A-L Compressed Gases, Inc., Spokane, WA, USA) through aquarium bubble stones. Two different oxygen concentrations were tested for each SMFC.
Microscopy and spectroscopy
SEM micrographs and EDS spectrums were obtained for a clean control graphite cathode and for one cathode from each of the four SMFCs. For preparation, the cathodes were air dried at room temperature and sputter coated with carbon. The cathodes were then placed on aluminium stubs and analyzed by field emission scanning electron microcopy (FEI Sirion 200, Hillsboro, OR, USA) using a secondary electron detector at an acceleration voltage of 20 kV. EDS was used for elemental analysis of the cathodes, with an analysis depth of 0.3–5 μm.
Mathematical model
Model formulation
The dependence of oxygen reduction kinetics on temperature is in part due to the temperature dependence of three coupled properties: oxygen solubility, the oxygen reduction potential, and the oxygen reduction rate constant. Our model system was comprised of the catholyte (SMFC bulk water with a pH of 8.4 and 7.7 for the river and ocean SMFCs, respectively) and a cathode. The catholyte was well-mixed due to the rapid bubbling of air near the cathodes. For the model, it was assumed that the DO concentration at the electrode surface was the same as that of the bulk catholyte. The DO concentration is governed by Henry's law:35
| (2) |
where C is the DO concentration (mM), p is the partial pressure (atm) of O2 in the surrounding atmosphere, and KH is a solubility equilibrium constant for O2 (atm mM–1) known as the Henry's law constant. The surrounding atmosphere is assumed to be 1 atm with a gas volume composition of 20.95% O2 and 79.05% inert gas (N2). The Henry's law constant changes as a function of temperature. This can be described using the generic van't Hoff equation:36
| (3) |
where K0 represents an equilibrium constant at the biochemical standard state, K represents the equilibrium constant at a different temperature, T0 is the standard state temperature (K), T is the temperature (K) for which you want to know the K value, R is the universal gas constant (J K–1 mol–1), and ΔH0 is the standard molar enthalpy change for the reaction that is governed by equilibrium constant K0. When using the van't Hoff equation to calculate Henry's law constants at different temperatures, ΔH0 represents the molar enthalpy change of solution for the dissolution of oxygen in water:
| (4) |
The Henry's law constant for oxygen is given as:
| (5) |
where is the Henry's law constant for O2 (atm mM–1) at standard conditions, and is the molar enthalpy change of solution (J mol–1) for the dissolution of oxygen in water. Note that oxygen solubility is also a function of salinity, which is accounted for in the standard Henry's law constant. Thus, the river and ocean SMFCs have different model parameter values accordingly. Substituting eqn (5) into eqn (2) gives us a correlation between DO concentration and temperature:
| (6) |
The van't Hoff equation also allows us to calculate the temperature dependence of the oxygen reduction potential. Reduction potentials that are given versus SHE are thermodynamically relevant and are proportional to the Gibbs energy for the given redox reaction, and are thus convertible into equilibrium constants:37
| (7) |
where E is a reduction potential (V), ΔG is the Gibbs energy (J mol–1), n is the number of electrons transferred during the redox reaction, F is the Faraday constant (s A mol–1), and Kr is the equilibrium constant (unitless) for the ORR (eqn (1)). From eqn (7), the equilibrium constant for oxygen reduction at standard conditions is given by:
| (8) |
where E0 is the standard reduction potential (V) of oxygen. Using the van't Hoff equation (eqn (4)), we can calculate the redox reaction equilibrium constant as a function of temperature:
| (9) |
where is the standard molar enthalpy of reduction (J mol–1) for oxygen. Bard et al. demonstrated that over our temperature range (8 to 24 °C), enthalpy and entropy changes can be considered constant.11 Note however that the enthalpy change and the entropy change for ORR are a function of pH, due to the consumption of protons during oxygen reduction.11 This has been accounted for in our model, and the river and ocean SMFCs have different model parameter values accordingly. Combining eqn (7), (8), and (9) gives us an expression that relates reduction potential to temperature:
| (10) |
It must be stated here that for this model, O2 reduction is assumed to occur via a single-step reaction, as shown in eqn (1). However, this is a simplification of the actual mechanism of oxygen reduction because several intermediate steps are known to occur during the transition from O2 to H2O, including the possible formation of hydrogen peroxide.33,38–42 The reaction rate of oxygen reduction can be described using Butler–Volmer kinetics, which is generally comprised of the forward oxidation kinetic rate, kf, and the backward reduction kinetic rate, kb. The oxygen reduction kinetic rate constant is given by:37
| (11) |
where kf is the reduction kinetic rate constant (m s–1), k0 is the standard heterogeneous rate constant (m s–1), α is the transfer coefficient (unitless), and e is the potential (V) applied to the electrode. When the electrode potential is at least 44 mV more negative than the oxygen reduction potential, the oxidation kinetic rate constant, kb, is negligible. This can be clarified by applying the equation for kb:37
| (12) |
From the study of Freguia et al.,10 we know that α is approximately 0.32, and if we set E = +732 mVSHE (the standard reduction potential at 25 °C in our river system), an electrode potential that is 44 mV more negative than the standard reduction potential yields a kb that is only 0.1% of kf. Thus, for this model, we ignore the current due to oxidation, and the model is applicable below a polarization potential of +688 mVSHE. Because of this, for model fitting only the data points that were more negative than +688 mVSHE were used.
Graphite electrodes are known to have voltage inefficiencies, which are observed in the large O2 reduction overpotential. Overpotential is simply an experimentally detected deviation of the onset potential of reduction from the standard potential: in the case of SMFCs, O2 reduction at the cathode only occurs at potentials which are much more negative than its standard potential. To account for this in the model, a potential loss term must be included, similar to that seen in Fig. 1. Potential losses can be written as the sum of two terms, EL and . The constant potential loss, EL, can include losses due to extracellular electron transfer, electrode activation, and concentration losses. The other term, –iRL, represents the loss due to electrical resistance (ohmic loss) and is a function of current, i. This term is negative due to the negative cathodic current convention. Therefore the kinetic rate constant is given by:
| (13) |
The standard heterogeneous rate constant, k0, is related to the electrode current exchange density and the kinetic capacity of the electrode for the redox reaction. It is dependent on the intimate interactions between the electrode surface material properties and the soluble and adsorbed redox couples of the system.37 Complex redox reactions with multiple steps and major molecular rearrangements that are not well facilitated by the electrode surface will produce small standard heterogeneous rate constants, less than 10–11 m s–1. Systems with low standard heterogeneous rate constants reach equilibrium slowly. On the other hand, if a redox couple is simple and is catalyzed at the electrode surface, the standard heterogeneous rate constant will be large, up to 0.1 m s–1, and equilibrium can be realized quickly.37 The standard heterogeneous rate constant is temperature dependent, given by an Arrhenius-like equation:37,43
| (14) |
where Z is the frequency (or ‘pre-exponential’) factor (m s–1), ΔG‡ is the free energy of activation (J mol–1), and E‡ is the activation energy written as an electrochemical potential (V). The free energy of activation is related to the energy required for molecular orientation, transition state activation, and electron transfer. This energy is a function of both the electrode chemical properties and the enzymatic activity of any microorganisms or surface molecules present. The frequency factor is a parameter related to the collision rate of the redox molecules, oxygen and protons in our case, at the electrode surface. The frequency factor contains the temperature dependence of the standard heterogeneous rate constant,44 and can be expanded to include temperature dependence terms:
| (15) |
where A′ is a modified pre-exponential factor and m is a power coefficient determining the extent of the standard heterogeneous rate constant temperature dependence. Therefore the standard heterogeneous rate constant is given by:
| (16) |
The total current density is given by:37
| (17) |
where j is the current density (A m–2) and As is the surface area of the electrode (m2). This equation shows the relationship between cathodic current density and oxygen reduction kinetics. By combining eqn (6), (10), (13), (16), and (17) we obtain an algebraic equation for current density as a function of temperature and polarization potential:
| (18) |
By combining the exponential terms and factoring, we can rewrite eqn (18) as:
| (19) |
The combined potential loss term, , is a lumped term consisting of all of the constant potential loss terms, which are not dependent on temperature or current. Table 1 lists the model parameters and their values, except for the fitting parameters, which are listed in Table 2.
Table 1.
Model parameters and variables for oxygen reduction. Differences in parameter values between the river and ocean SMFCs are due to the pH dependence of oxygen reduction enthalpy and entropy changes, and to the effect of salinity on O2 solubility. The independent variables are temperature (T) and polarization potential (ε)
| Description | Symbol | River SMFC value | Ocean SMFC value | Units | Ref. |
|---|---|---|---|---|---|
| Electrode surface area | A s | 0.00155 | 0.00155 | m2 | |
| Standard O2 reduction potential | E 0 | 0.732 | 0.773 | VSHE | 11 |
| Faraday constant | F | 96 485.3399 | 96 485.3399 | s A mol–1 | 46 |
| Molar enthalpy change of reduction for O2 | –437 500 | –448 500 | J mol–1 | 11, 47 | |
| Molar enthalpy change of solution for O2 | 15000 | 15000 | J mol–1 | 48 | |
| Standard Henry's law constant for O2 | 0.83 | 0.98 | atm mM–1 | 48, 49 | |
| Electrons transferred during O2 reduction | n | 4 | 4 | Unitless | 10 |
| Partial pressure of O2 | p | 0.2095 | 0.2095 | atm | |
| Universal gas constant | R | 8.314472 | 8.314472 | J K–1 mol–1 | 46 |
| Standard state temperature | T 0 | 298.15 | 298.15 | K | |
| Transfer coefficient | α | 0.32 | 0.32 | Unitless | 10 |
Table 2.
Model fitting parameters and coefficients of determination
| Description | Parameter | Value for river SMFC | Value for ocean SMFC | Units |
|---|---|---|---|---|
| Coefficient of determination | R 2 | 0.99 | 1.00 | Unitless |
| Modified pre-exponential factor | A ’ | 1.7 × 10⁻¹⁰ | 2.6 × 10⁻¹⁰ | ms–1 |
| Lumped constant potential loss | 470 | 614 | mV | |
| Temperature dependence power coefficient | m | 90 | 42 | Unitless |
| Resistance responsible for ohmic loss | 440 | 444 | Ω |
Note that the application of eqn (19) could be expanded by including pH and salinity as independent variables to directly address the dependence of enthalpy change on pH for the ORR and oxygen solubility on salinity. To accomplish this, the standard Henry's law constant could be changed from a constant into a function of salinity. A method similar to Weiss's could be employed.45 The standard reduction potential and/or the molar enthalpy change of reduction could be changed to functions to account for pH. For the standard reduction potential, this could be achieved using the Nernst equation.37 Turning these parameters into functions would eliminate the need for the separate parameter values for ocean and river waters.
Model implementation
In order to fit the model to the data, four fitting parameters (modified pre-exponential factor, A′, lumped constant potential loss, , temperature dependence power coefficient, m, and resistance responsible for ohmic loss, RL) were used to minimize the following objective function:
| (20) |
where SSD is the sum of squared differences, U is the total number of temperatures experimentally tested, u is the arbitrary index value (from 1 to U) of each tested temperature, V is the total number of polarization potentials experimentally tested, v is the arbitrary index value (from 1 to V) of each tested polarization potential, jexp,v,u is the experimentally determined current density value for a given polarization potential v and temperature u, and jcalc,v,u is the current density calculated for v and u using the model. The current density data set obtained for each SMFC by quantifying the dependence of the kinetic rate on temperature and polarization potential was used for fitting the model, so a single set of fitting parameter values was obtained for each sediment type. Matlab function fminsearch was used to minimize eqn (20). Because eqn (19) is not explicit (j depends on the current density itself, because of ohmic losses), Matlab was also used to iteratively solve for j values.
Because of the highly nonlinear nature of eqn (19), the final fit of the model was greatly dependent on the initial guesses of the fitting parameters. In order to find the best fit, a 3 × 3 × 3 × 3 array, corresponding to a set of A′, , m, and values, was used for initial guesses. This array was constructed based on a wide range of values for each parameter. The top 10% of the resulting fits, determined by the smallest SSD values, were then used to redefine a new set of initial guesses: ±0, 1, and 2 standard deviations from each average parameter value determined by the best fit. This new array represented a “trained guess” of the parameter values. Note that only realistic values were used for initial guesses, thus excluding impossible parameter values that might appear, such as negative resistance.
Finally, parametric analysis was performed for the river SMFC model fit to determine how each model parameter affected the current density. The current density at 20 °C with a polarization potential of –255 mVSHE was used for the comparison. A ±25% error was introduced into each parameter and the effect on current density was recorded.
Results and discussion
Acclimatization of the cathode at an open circuit is commonly used for SMFCs, and can allow for the formation of electrochemically-active biofilms or the deposition of enzymes under certain conditions. Compared to a fresh cathode, an open circuit acclimatized cathode can have a significantly increased ORR activity,13,50 which is why we used this method in our study. Other acclimatization methods, like electrode polarization, may potentially result in an even higher ORR activity (see Table S1 in the ESI† for a list of SMFC studies and the acclimatization methods that were utilized). Note however that our model has been formulated to explain oxygen reduction as a function of temperature, potential, and DO concentration regardless of the acclimatization method of the cathode. The changes induced by the acclimatization method will be reflected in the model parameters.
Fig. 2 shows the OCP at room temperature for the electrodes in both ocean SMFCs to demonstrate how open circuit electrode potentials develop over time. The cathode OCPs reached an average steady-state value of +506 mVSHE. The cathodes in the river SMFCs reached an average OCP value of +485 mVSHE. As can be seen in Fig. 2, the cathode OCP values increased rapidly during the first 10 days, decreased slightly during the next 15 days, and finally reached a stable steady-state OCP around 35–45 days. The length of time required for steady-state OCP formation is one of the contributing factors to the typically extended start-up times of SMFCs.
Fig. 2.

Open circuit potentials of the cathodes and anodes in the ocean sediment microbial fuel cells. Each electrode in each SMFC was run in duplicate; the OCPs of the electrodes in SMFC 1 are shown in black, and those of the electrodes in SMFC 2 are shown in gray. The cathodes reached an average steady-state OCP value of +506 mVSHE, and the anodes reached an average steady-state OCP value of –280 mVSHE. The error bars show a single standard deviation.
At a macroscopic level, the development of the OCP of a cathode can be explained as a net transport of electrons from the graphite electrode to soluble, oxidative, electrochemically-active chemical species.41,51 This causes the potential to increase over time. Eventually the transport of electrons into the electrode becomes equal to that out of the electrode, resulting in an equilibrium potential, known in the literature as the steady-state OCP. The Nernst equation (eqn (21)) shows that an increasing OCP is imposed by an increased concentration of oxidative species at the electrode surface.37,41
| (21) |
Fig. 2 demonstrates that over time the cathode becomes increasingly oxidized by an increased concentration of oxidative species at the cathode surface. Xu et al. has shown that OCP formation on graphite is primarily biotic, caused by microbial deposits, and is similar to the ennoblement of stainless steel.50 Understanding the formation of the cathode OCP is critical because the OCP allows us to determine the net reaction direction (oxidation versus reduction) when the cathode is connected to an anode or is artificially polarized. When the cathode is polarized at a more positive potential than the OCP, the electrode potential is moved away from its equilibrium and negative charges are removed. Le Chatelier's principle qualitatively states that a system that is moved away from its equilibrium will experience chemical reactions that attempt to neutralize the deviation. This principle demonstrates that more positive potentials will lead to an increasingly oxidizing electrode, as the cathode draws electrons through oxidation reactions in an attempt to revert to its equilibrium potential. Likewise, applying a more negative potential or attaching an anode shifts the cathode away from its equilibrium potential and causes an increase in reduction reactions. The further away from the equilibrium potential, the stronger the redox conditions and the faster the reaction kinetics become. This effect can be seen in Fig. 3.
Fig. 3.

(A) Current density for a river SMFC cathode as a function of potential at 8.7 °C and 23.7 °C. (B) Current density for an ocean SMFC cathode as a function of potential at 12.5 °C and 23.3 °C. The vertical black lines represent the steady-state OCP values. Error bars representing a single standard deviation are not shown, as the standard deviations were always less than 0.01 A m–2 for both ocean and river SMFCs. The solid lines represent the model fit for each polarization temperature.
The current densities of a river and an ocean SMFC cathode at various potentials at two temperatures are shown as a function of potential in Fig. 3. Cathodic current is designated as negative and anodic current as positive, as is common in the literature.52 The current density magnitude, which is the unsigned current density, is reported in the text to reduce ambiguity. Polarization potentials more negative than the OCP (black vertical line) result in increasing current density magnitude, up to 0.48 A m–2 for the river SMFC (Fig. 3A) and up to 0.31 A m–2 for the ocean SMFC (Fig. 3B). The deviation from the equilibrium potential imposed by the potentiostat causes electrons to drive the oxygen reduction rates and current density magnitude increases as the potential decreases below the OCP. Current density magnitude is negligible at potentials more positive than OCP because the catholyte is already highly oxidized; therefore no oxidizing reaction can occur.
Despite the fact that the polarization potential was always more negative than the standard reduction potential for O2, a current density magnitude larger than 0.5 A m–2 was not apparent until +45 mVSHE for the river SMFC and –55 mVSHE for the ocean SMFC. This large required overpotential is due to substantial potential losses for oxygen reduction on graphite. The detrimental effect of overpotential on SMFC power can be clarified by considering the following equation:
| (22) |
where P is the power output of the SMFC (W), i is the current (A), is the total SMFC resistance (Ω), and is the cell potential (EC – EA) (V). Eqn (22), which is derived from Joule's first law and Ohm's law, demonstrates how SMFC power output is a function of cell potential and current. The average anode potentials in our river and ocean sediments were –290 mVSHE and –280 mVSHE, yielding open circuit cell potentials of 786 and 775 mV, respectively. If an SMFC cathode fully utilized oxygen reduction with negligible cathode potential losses, cell OCPs would be around 1022 and 1053 mV for river and ocean SMFCs, respectively, assuming the anode potentials remained constant. Eqn (22) shows us that this increase in cell potential could hypothetically increase SMFC power by a factor of ~1.75. The poor voltage effciencies result in less energy production than is thermodynamically achievable. This is the allure of expensive catalytic metal cathodes such as platinum, which are sometimes used in MFCs: they have lower potential losses, do not require as large an overpotential to drive oxygen reduction, and can have OCP values closer to the standard reduction potential of O2, resulting in increased power production.
Fig. 3A shows that for the river SMFC, the current density magnitude is larger at the higher temperatures. Fig. 4 highlights this trend by showing current density versus temperature at four different polarization potentials: –255, –155, –55, and +45 mVSHE. For the river SMFC, the current density magnitude increased an average of 2% per °C (0.3% standard deviation). For comparison, Larrosa-Guerrero et al. demonstrated that for wastewater MFCs, the current density magnitude increased an average of 4% per °C (data read from their Fig. 3).53 This trait is a known characteristic of oxygen reduction, as the oxygen reduction rate has repeatedly been shown to increase linearly with temperature on non-graphite cathode materials at biochemically relevant temperatures.39,54–59 Surprisingly, there is no detectable temperature trend with the ocean SMFC, and the current density magnitude changes an average of 0% per °C (0.3% standard deviation). The difference between the river and ocean SMFC temperature dependences is statistically significant (P-value < 0.0001). In reference to eqn (22), these data demonstrate that for the river SMFC cathodes, a temperature increase of 5 °C can increase current density by 10% and therefore increase power output by up to 21%. Because temperatures in rivers are a function of depth and relative closeness to the bank, strategic cathode placement may help increase power. For example, in the South Fork Palouse River, the river surface near the bank is often 5+ °C warmer than the river channel depths.
Fig. 4.

Current densities of (A) a river SMFC cathode and (B) an ocean SMFC cathode as a function of temperature for different polarization potentials (–255, –155, –55, and +45 mVSHE). The solid lines represent the model fit for each polarization potential.
It is interesting to note that for both the river and ocean SMFC cathodes, the reduction kinetic rate constant increases with temperature. This is not obvious at first, because the ocean SMFC current density is independent of temperature. However, Fig. 5 shows DO as a function of temperature for both river and ocean water. DO concentrations decrease with increased temperatures. Eqn (17) illustrates that current density is a function of the kinetic reduction rate constant and DO concentration. As the temperature increases, the level of DO in both water types decreases because of a reduced solubility of oxygen. It follows, therefore, that for both the river and ocean SMFCs, where the current density magnitude does not decrease with increasing temperature, the kinetic reduction rate constant increases with temperature. Other MFC experiments have also demonstrated increased kinetic rates and increased activity at higher temperatures.60,61 Higher temperatures generate increased O2 reduction kinetics for both river and ocean graphite cathodes. One explanation for this trend is the possible increased activity of biocatalysts at the electrode surface. Qiao et al. reviewed several studies that demonstrated that electrocatalysis at the cathode can be assisted by microorganisms.12 This biocatalytic activity was shown to increase electrode performance. In a recent study, Faimali et al. found significant evidence for the role of exoenzymes in increasing ORR activity of seawater-exposed cathodes.62 Other studies suggest that microorganisms may have an exceptionally indirect method to increase the cathodic reduction rate, for example by forming superoxide that can oxidize soluble manganese(ii) to form manganese oxides, which are known to be efficient cathodic reactants.63,64 Furthermore, electrochemically-active biofilms, which can form on electrodes in natural waters, can also increase ORR activity of SMFC cathodes.13,50 From Fig. 5 it is clear that, along with the larger potential losses, lower DO concentration can at least partially explain the smaller current density magnitude in the ocean SMFC. For the polarization potentials shown in Fig. 4, the current density magnitude of the ocean SMFC was between 20% and 80% less (average 50%) than the river SMFC. In Fig. 6, current density is shown for two different DO concentrations at room temperature. For both the river and ocean SMFCs, current density decreases with lowered DO, which is explained by eqn (17). We should note that there is a linear relationship between current density and oxygen concentration.
Fig. 5.

Saturated DO concentration as a function of temperature for both river water and ocean water. The circles represent data obtained from the United States Geological Survey (USGS) DO Tables, and the black lines represent theoretical values calculated using eqn (6) and parameter values from Table 1.
Fig. 6.

Current density as a function of polarization potential for different oxygen saturation conditions. The solid lines represent the model fit for each DO saturation. It should be noted that the lower DO data were not used for model fitting. The model lines for 57% DO saturation in the river SMFC (A) and 35% DO saturation in the ocean SMFC (B) were predicted, not fitted. The vertical black lines represent the steady-state OCP values.
For both the river and the ocean SMFC data, the model strongly correlates with the experimental data, with coefficients of determination of 0.99 and 1.00, respectively (see Table 2 and Fig. S2 in the ESI†). Table 2 also gives model fitting parameters. The model fit is shown alongside the experimental data in Fig. 3, 4 and 6. According to the model, the dependence of current density on temperature is nearly linear from 8 °C to 24 °C. It is apparent that the standard heterogeneous rate constant, shown in Eqn (16), is the source of all of the temperature dependence seen in Fig. 4. Specifically, the large positive value of the power coefficient forces the current density to increase with increasing temperature. This is expected due to the fact that both DO and the oxygen reduction potential are inversely proportional to temperature, as is seen in both Fig. 5 and Fig. 7. This causes the main exponential term in eqn (19) to be inversely proportional to temperature. Deciphering the cathode material properties and SMFC parameters that govern the standard heterogeneous rate constant may be key to improving cathode performance.
Fig. 7.

Oxygen reduction potential as a function of temperature, as calculated by the model.
Unexpectedly, the model did not show the current density growing exponentially with decreasing polarization potential, which would be expected initially from eqn (11). Rather, the polarization potential dependence was linear after the current density began to increase. This is because of the potential losses, in particular the ohmic loss, which is a function of current density itself. Comparing the model fitting parameter values in Table 2, we see that the cathodic current of the river SMFC had greater temperature dependence than that of the ocean SMFC, and that the potential losses were larger in the ocean SMFC. This corroborates the temperature dependence of the experimental data shown in Fig. 3 and Fig. 4. Finally, the parametric analysis shows that, in order of significance, the standard oxygen reduction potential, the potential losses, and the polarization potential have the largest impact on current density and cathode reduction kinetics. Making the standard reduction potential more positive by 25% increased the current density magnitude by nearly 60%. It is possible for the standard reduction potential to change because of its pH dependence: a positive correlation with increasing acidity. This parametric study highlights the intimate connection that current density has with potential. Increasing the electrochemical potential available at the cathode is the most substantial method for increasing kinetic rates.
SEM micrographs of the river and ocean SMFC cathodes demonstrate that material was deposited onto the cathodes while they were in the SMFCs. Fig. 8 shows the EDS spectrums and SEM micrographs of a clean control cathode and the SMFC cathodes. The ocean SMFC cathode EDS spectrum reveals that its elemental composition changed very little from that of the control: there was only a small increase in the relative abundance of sodium and chloride. Elemental analysis of the river SMFC cathode revealed a much richer array of deposited elements, including noteworthy amounts of silicon, oxygen, and aluminium. Silicon is commonly found in river water and is much more dilute in ocean water. Surprisingly, manganese, which has been observed on electrodes immersed in natural waters because of the presence of manganese-oxidizing bacteria, was not found on either cathode.64 We believe the deposits are likely due to suspended sediment material that collected on the cathodes and precipitations of soluble compounds found in the waters. We did not observe visible bacteria on any of the SEM micrographs, and we expect that this is due to the preparation method of the cathodes. However, it is expected that in natural waters, microorganisms on cathodes may be involved in the catalysis of oxygen reduction.50
Fig. 8.
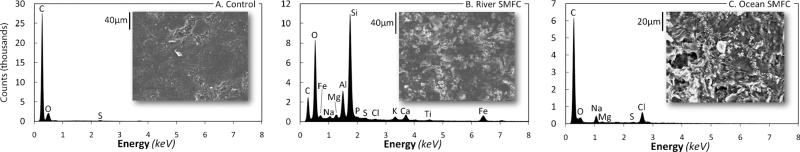
EDS spectrums and SEM micrographs of (A) a clean control cathode, (B) a river SMFC cathode, and (C) an ocean SMFC cathode. Deposits are visible on both of the SMFC cathodes. The river SMFC cathode had a significant amount of silicon, oxygen, aluminium, and other elements present. The ocean SMFC cathode was only enriched slightly by sodium and chloride deposits.
Practical implications
Temperature and oxygen concentration play an important role in cathodic current density. The correlation of current density with temperature, electrode potential, and dissolved oxygen concentration can help guide SMFC deployment, as strategically chosen locations in rivers and oceans may exploit these parameters to increase SMFC power production. Engineered reactor designs and new materials may also increase cathode performance. Primary factors that hinder SMFC power are the cathodic potential losses and the resulting limited electrochemical potential available at the cathode.
Our model reveals that understanding the standard heterogeneous rate constant may be critically important for improving cathode performance, as this term was the source of the temperature dependence of the current density. Future studies may explore what material properties and MFC parameters control this term. Since the model can simulate a theoretical clean system, it can be used as a measure of performance for SMFC systems and cathode materials. If an experimentally obtained current density is less than is predicted by our model, it means there is contamination, surface-area obstruction, or some other oxygen reduction hindrance. The model can then be used to estimate the level of performance compared to an ideal situation. Furthermore, this model can be used in programmable power management systems to monitor expected power generation as a function of water temperature in the field. Because the model is based on first principles of thermodynamics, it can be applied to both biotic and abiotic systems. Parameters such as the standard heterogeneous rate constant and the potential loss terms can capture the effects caused by biocatalysts or electrochemically-active biofilm formation. Finally, the model can easily be adapted to account for other cathodic redox couples besides oxygen reduction, and pH and salinity dependence can be added directly. In this way, the model can be tailored to specific cathode setups.
Conclusions
In this study, we quantified the dependence of oxygen reduction kinetics on temperature, electrode potential, and dissolved oxygen concentration for graphite cathodes of SMFCs deployed in river and ocean water environments. A mechanistic model was employed to explain the results. We concluded the following:
The open circuit potential of the cathode reached an average steady-state value of +506 mVSHE in the ocean SMFC and +485 mVSHE in the river SMFC.
After oxygen reduction was initiated, the current density was linearly dependent on polarization potential for both the river and ocean SMFCs.
Current density magnitude increased linearly with temperature in the river SMFCs.
Current density magnitude remained constant with temperature in the ocean SMFCs.
Current density magnitude in both the river and ocean SMFCs was linearly proportional to DO concentration.
The standard heterogeneous rate constant controls the current density temperature dependence.
The river and ocean SMFC graphite cathodes had large potential losses, estimated by the model to be 470 mV and 614 mV, respectively.
The electrochemical potential available at the cathode is the primary factor controlling reduction kinetic rates.
Supplementary Material
Acknowledgements
This research was supported by the U.S. Office of Naval Research (ONR), grant #N00014-09-1 0090. The authors gratefully acknowledge the financial support provided by the National Institutes of Health (NIH) Protein Biotechnology Training program, grant #T32-GM008336, for helping to fund Ryan Renslow and Jerome Babauta, and the National Science Foundation (NSF) IGERT program, grant #DGE-0900781, for Conrad Donovan. We are also grateful to the Franceschi Microscopy and Imaging Center of Washington State University for the use of their facilities and staff assistance.
Nomenclature
- A′
modified pre-exponential factor (m s–1)
- As
surface area of electrode (m2)
- C
concentration of O2 (mM)
- E
reduction potential for O2 (V)
- E0
standard reduction potential for O2 (V)
- EL
constant potential loss (V)
lumped constant potential loss (V)
- Eocp
equilibrium open circuit potential (V)
net standard reduction potential of the bulk water (V)
- E‡
activation energy as an electrochemical potential (V)
- F
Faraday constant (s A mol–1)
- ΔG
Gibbs energy change (J mol–1)
- ΔG‡
free energy of activation (J mol–1)
- ΔH
molar enthalpy change (J mol–1)
- ΔH0
standard molar enthalpy change (J mol–1)
standard molar enthalpy change of reduction for O2 (J mol–1)
standard molar enthalpy change of solution for O2 (J mol–1)
- i
SMFC current (A)
- j
current density (A m–2)
- jcalc
model calculated current density (A m–2)
- jcalc,v,u
model calculated current density for polarization potential v and temperature u (A m–2)
- jexp
experimentally determined current density (A m–2)
- jexp,v,u
experimentally determined current density for polarization potential v and temperature u (A m–2)
- J
current density magnitude (A m–2)
- K
equilibrium constant (varies)
- K0
standard equilibrium constant (varies)
- k0
standard heterogeneous rate constant for O2 reduction (m s–1)
- kb
oxidation kinetic rate constant (m s–1)
- kf
reduction kinetic rate constant (m s–1)
- KH
Henry's law constant for O2 (atm mM–1)
standard Henry's law constant for O2 (atm mM–1)
- Kr
equilibrium constant for O2 reduction (unitless)
standard equilibrium constant for O2 reduction (unitless)
- m
temperature dependence power coefficient (unitless)
- n
electrons transferred during O2 reduction (unitless)
- [ox]
concentration of oxidized species (mM)
- P
SMFC power output (W)
- p
partial pressure of O2 (atm)
- R
universal gas constant (J K–1 mol–1)
total SMFC resistance (Ω)
SMFC resistance responsible for ohmic losses (Ω)
- R2
coefficient of determination (unitless)
- [red]
concentration of reduced species (mM)
- ΔS
molar entropy change (J K–1 mol–1)
- SSD
sum of squared differences (A2 m–4)
- T
temperature (K)
- T0
standard state temperature (K)
- u
arbitrary index value of each temperature used (unitless)
- U
total number of temperatures used (unitless)
- v
arbitrary index value of each polarization potential used (unitless)
- V
total number of polarization potentials used (unitless)
SMFC cell potential (V)
- Z
frequency factor (m s–1)
- α
transfer coefficient for O2 reduction (unitless)
- ε
polarized electrode potential (V)
Footnotes
Electronic supplementary information (ESI) available. See DOI: 10.1039/c1cp23200b
References
- 1.Donovan C, Dewan A, Heo D, Beyenal H. Environ. Sci. Technol. 2008;42:8591–8596. doi: 10.1021/es801763g. [DOI] [PubMed] [Google Scholar]
- 2.Rezaei F, Richard TL, Brennan RA, Logan BE. Environ. Sci. Technol. 2007;41:4053–4058. doi: 10.1021/es070426e. [DOI] [PubMed] [Google Scholar]
- 3.Tender LM, Gray SA, Groveman E, Lowy DA, Kauffman P, Melhado J, Tyce RC, Flynn D, Petrecca R, Dobarro J. J. Power Sources. 2008;179:571–575. [Google Scholar]
- 4.Donovan C, Dewan A, Peng HA, Heo D, Beyenal H. J. Power Sources. 2011;196:1171–1177. [Google Scholar]
- 5.Franks AE, Nevin KP. Energies. 2010;3:899–919. [Google Scholar]
- 6.Osman MH, Shah AA, Walsh FC. Biosens. Bioelectron. 2010;26:953–963. doi: 10.1016/j.bios.2010.08.057. [DOI] [PubMed] [Google Scholar]
- 7.Watanabe K. J. Biosci. Bioeng. 2008;106:528–536. doi: 10.1263/jbb.106.528. [DOI] [PubMed] [Google Scholar]
- 8.Logan BE. Microbial Fuel Cells. John Wiley & Sons, Inc.; Hoboken: 2008. [Google Scholar]
- 9.Marshall CW, May HD. Energy Environ. Sci. 2009;2:699–705. [Google Scholar]
- 10.Freguia S, Rabaey K, Yuan Z, Keller J. Electrochim. Acta. 2007;53:598–603. [Google Scholar]
- 11.Bard AJ, Parsons R, Jordan J. Standard potentials in aqueous solutions. Marcel Dekker, Inc.; New York: 1985. [Google Scholar]
- 12.Qiao Y, Bao SJ, Li CM. Energy Environ. Sci. 2010;3:544–553. [Google Scholar]
- 13.De Schamphelaire L, Boeckx P, Verstraete W. Appl. Microbiol. Biotechnol. 2010;87:1675–1687. doi: 10.1007/s00253-010-2645-9. [DOI] [PubMed] [Google Scholar]
- 14.Dewan A, Donovan C, Heo D, Beyenal H. J. Power Sources. 2010;195:90–96. [Google Scholar]
- 15.Cheng SA, Logan BE. Bioresour. Technol. 2011;102:4468–4473. doi: 10.1016/j.biortech.2010.12.104. [DOI] [PubMed] [Google Scholar]
- 16.Zeng YZ, Choo YF, Kim BH, Wu P. J. Power Sources. 2010;195:79–89. [Google Scholar]
- 17.Rismani-Yazdi H, Carver SM, Christy AD, Tuovinen IH. J. Power Sources. 2008;180:683–694. [Google Scholar]
- 18.Harnisch F, Schroder U. Chem. Soc. Rev. 2010;39:4433–4448. doi: 10.1039/c003068f. [DOI] [PubMed] [Google Scholar]
- 19.He Z, Angenent LT. Electroanalysis. 2006;18:2009–2015. [Google Scholar]
- 20.Zhao F, Harnisch F, Schrorder U, Scholz F, Bogdanoff P, Herrmann I. Environ. Sci. Technol. 2006;40:5193–5199. doi: 10.1021/es060332p. [DOI] [PubMed] [Google Scholar]
- 21.Oh S, Min B, Logan BE. Environ. Sci. Technol. 2004;38:4900–4904. doi: 10.1021/es049422p. [DOI] [PubMed] [Google Scholar]
- 22.Chen GW, Choi SJ, Cha JH, Lee TH, Kim CW. Korean J. Chem. Eng. 2010;27:1513–1520. [Google Scholar]
- 23.Chen GW, Cha JH, Choi SJ, Lee TH, Kim CW. Korean J. Chem. Eng. 2010;27:828–835. [Google Scholar]
- 24.Schaetzle O, Barriere F, Schroder U. Energy Environ. Sci. 2009;2:96–99. [Google Scholar]
- 25.Cao XX, Huang X, Liang P, Boon N, Fan MZ, Zhang L, Zhang XY. Energy Environ. Sci. 2009;2:498–501. [Google Scholar]
- 26.Erable B, Duteanu N, Kumar SMS, Feng YJ, Ghangrekar MM, Scott K. Electrochem. Commun. 2009;11:1547–1549. [Google Scholar]
- 27.Deng Q, Li XY, Zuo JE, Ling A, Logan BE. J. Power Sources. 2010;195:1130–1135. [Google Scholar]
- 28.Duteanu N, Erable B, Kumar SMS, Ghangrekar MM, Scott K. Bioresour. Technol. 2010;101:5250–5255. doi: 10.1016/j.biortech.2010.01.120. [DOI] [PubMed] [Google Scholar]
- 29.Zhang F, Cheng SA, Pant D, Van Bogaert G, Logan BE. Electrochem. Commun. 2009;11:2177–2179. [Google Scholar]
- 30.Rabaey K, Read ST, Clauwaert P, Freguia S, Bond PL, Blackall LL, Keller J. ISME J. 2008;2:519–527. doi: 10.1038/ismej.2008.1. [DOI] [PubMed] [Google Scholar]
- 31.Cheng KY, Ho G, Cord-Ruwisch R. Environ. Sci. Technol. 2009;44:518–525. doi: 10.1021/es9023833. [DOI] [PubMed] [Google Scholar]
- 32.Liang P, Fan MZ, Cao XX, Huang X. J. Chem. Technol. Biotechnol. 2009;84:794–799. [Google Scholar]
- 33.Wu JJ, Wang Y, Zhang D, Hou BR. J. Power Sources. 2011;196:1141–1144. [Google Scholar]
- 34.He Z, Shao HB, Angenent LT. Biosens. Bioelectron. 2007;22:3252–3255. doi: 10.1016/j.bios.2007.01.010. [DOI] [PubMed] [Google Scholar]
- 35.Battino R, Clever HL. Chem. Rev. 1966;66:395–463. [Google Scholar]
- 36.Haynes WM, Lide DR. CRC Handbook of Chemistry and Physics. 91st edn CRC Press; Boca Raton: 2010. [Google Scholar]
- 37.Bard AJ, Faulkner LR. Electrochemical methods: fundamentals and applications. John Wiley & Sons, Inc.; New York: 2001. [Google Scholar]
- 38.Nørskov JK, Rossmeisl J, Logadottir A, Lindqvist L, Kitchin JR, Bligaard T, Jónsson H. J. Phys. Chem. B. 2004;108:17886–17892. [Google Scholar]
- 39.Roche I, Scott K. J. Electroanal. Chem. 2010;638:280–286. [Google Scholar]
- 40.Tripkovic V, Skulason E, Siahrostami S, Norskov JK, Rossmeisl J. Electrochim. Acta. 2010;55:7975–7981. [Google Scholar]
- 41.Vetter KJ. Electrochemical kinetics: theoretical and experimental aspects (translation of Electrochemische kinetik by Springer-Verlag) Academic Press, Inc.; New York: 1967. [Google Scholar]
- 42.Wakabayashi N, Takeichi M, Uchida H, Watanabe M. J. Phys. Chem. B. 2005;109:5836–5841. doi: 10.1021/jp046204+. [DOI] [PubMed] [Google Scholar]
- 43.Schmitz JEJ, Van der Linden JGM. Anal. Chem. 1982;54:1879–1880. [Google Scholar]
- 44.IUPAC . Compendium of Chemical Terminology. 2nd edn. Blackwell Scientific Publications; Oxford: 1997. (the “Gold Book”) [Google Scholar]
- 45.Weiss RF. Deep-Sea Res. 1970;17:721–735. [Google Scholar]
- 46.Mohr PJ, Taylor BN, Newell DB. Rev. Mod. Phys. 2008;80:633–730. doi: 10.1103/RevModPhys.93.025010. [DOI] [PMC free article] [PubMed] [Google Scholar]
- 47.deBethune AJ, SwendemanLoud NA. Standard aqueous electrode potentials and temperature coeffcients at 25°. Clifford A. Hampel Publisher; Skokie: 1964. [Google Scholar]
- 48.Carpenter JH. Limnol. Oceanogr. 1966;11:264–277. [Google Scholar]
- 49.Mel'nichenko NA, Koltunov AM, Vyskrebentsev AS, Bazhanov AV. Russ. J. Phys. Chem. A. 2008;82:746–752. [Google Scholar]
- 50.Xu FL, Duan JZ, Hou BR. Bioelectrochemistry. 2010;78:92–95. doi: 10.1016/j.bioelechem.2009.09.010. [DOI] [PubMed] [Google Scholar]
- 51.Bockris J, Reddy A, Gamboa-Aldeco M. Modern Electrochemistry: Volume 2A—Fundamentals of Electrodics. Kluwer Academic Publishers; New York: 2002. [Google Scholar]
- 52.Strycharz SM, Malanoski AP, Snider RM, Yi H, Lovley DR, Tender LM. Energy Environ. Sci. 2011;4:896–913. [Google Scholar]
- 53.Larrosa-Guerrero A, Scott K, Head IM, Mateo F, Ginesta A, Godinez C. Fuel. 2010;89:3985–3994. [Google Scholar]
- 54.Song C, Zhang L, Zhang J, Wilkinson DP, Baker R. Fuel Cells. 2007;7:9–15. [Google Scholar]
- 55.Elezovic NR, Babic BM, Krstajic NV, Gojkovic SL, Vracar LM. J. Serb. Chem. Soc. 2008;73:641–654. [Google Scholar]
- 56.Huang XJ, Rogers EI, Hardacre C, Compton RG. J. Phys. Chem. B. 2009;113:8953–8959. doi: 10.1021/jp903148w. [DOI] [PubMed] [Google Scholar]
- 57.Rollins JB, Conboy JC. J. Electrochem. Soc. 2009;156:B943–B954. doi: 10.1149/1.3143122. [DOI] [PMC free article] [PubMed] [Google Scholar]
- 58.Yano H, Akiyama T, Uchida H, Watanabe M. Energy Environ. Sci. 2010;3:1511–1514. [Google Scholar]
- 59.Zhang L, Song CJ, Zhang JJ, Wang HJ, Wilkinson DP. J. Electrochem. Soc. 2005;152:A2421–A2426. [Google Scholar]
- 60.Michie IS, Kim JR, Dinsdale RM, Guwyb AJ, Premier GC. Energy Environ. Sci. 2011;4:1011–1019. [Google Scholar]
- 61.Min B, Roman OB, Angelidaki I. Biotechnol. Lett. 2008;30:1213–1218. doi: 10.1007/s10529-008-9687-4. [DOI] [PubMed] [Google Scholar]
- 62.Faimali M, Benedetti A, Pavanello G, Chelossi E, Wrubl F, Mollica A. Biofouling. 2011;27:375–384. doi: 10.1080/08927014.2011.576756. [DOI] [PubMed] [Google Scholar]
- 63.Learman DR, Voelker BM, Vazquez-Rodriguez AI, Hansel CM. Nat. Geosci. 2011;4:95–98. [Google Scholar]
- 64.Rhoads A, Beyenal H, Lewandowski Z. Environ. Sci. Technol. 2005;39:4666–4671. doi: 10.1021/es048386r. [DOI] [PubMed] [Google Scholar]
Associated Data
This section collects any data citations, data availability statements, or supplementary materials included in this article.