Abstract
Background
Breast tissue is among the most sensitive tissues to the carcinogenic actions of ionizing radiation and epidemiological studies have linked radiation exposure to breast cancer. Currently, molecular understanding of radiation carcinogenesis in mammary gland is hindered due to the scarcity of in vivo long-term follow up data. We undertook this study to delineate radiation-induced persistent alterations in gene expression in mouse mammary glands 2-month after radiation exposure.
Methods
Six to eight week old female C57BL/6J mice were exposed to 2 Gy of whole body γ radiation and mammary glands were surgically removed 2-month after radiation. RNA was isolated and microarray hybridization performed for gene expression analysis. Ingenuity Pathway Analysis (IPA) was used for biological interpretation of microarray data. Real time quantitative PCR was performed on selected genes to confirm the microarray data.
Results
Compared to untreated controls, the mRNA levels of a total of 737 genes were significantly (p<0.05) perturbed above 2-fold of control. More genes (493 genes; 67%) were upregulated than the number of downregulated genes (244 genes; 33%). Functional analysis of the upregulated genes mapped to cell proliferation and cancer related canonical pathways such as ‘ERK/MAPK signaling’, ‘CDK5 signaling’, and ‘14-3-3-mediated signaling’. We also observed upregulation of breast cancer related canonical pathways such as ‘breast cancer regulation by Stathmin1’, and ‘HER-2 signaling in breast cancer’ in IPA. Interestingly, the downregulated genes mapped to fewer canonical pathways involved in cell proliferation. We also observed that a number of genes with tumor suppressor function (GPRC5A, ELF1, NAB2, Sema4D, ACPP, MAP2, RUNX1) persistently remained downregulated in response to radiation exposure. Results from qRT-PCR on five selected differentially expressed genes confirmed microarray data. The PCR data on PPP4c, ELF1, MAPK12, PLCG1, and E2F6 showed similar trend in up and downregulation as has been observed with the microarray.
Conclusions
Exposure to a clinically relevant radiation dose led to long-term activation of mammary gland genes involved in proliferative and metabolic pathways, which are known to have roles in carcinogenesis. When considered along with downregulation of a number of tumor suppressor genes, our study has implications for breast cancer initiation and progression after therapeutic radiation exposure.
Keywords: Radiation exposure, Mouse mammary gland, Gene expression, Persistent microarray changes.
Background
We know from epidemiological studies that exposure to ionizing radiation (IR) is one of the major risk factors for breast cancer especially if exposure occurs at a young age [1,2]. Exposure to radiation, which is increasingly used in diagnostic and therapeutic interventions, is unavoidable and is predicted to pose carcinogenic risk [3,4]. Radiation induces a myriad of damage to biomolecules including DNA and the carcinogenic potential of radiation has been attributed to alterations in the expression of genes, which could induce proliferation and provide survival advantage to cells. Changes in gene expression in response to radiation have been reported to vary depending on the dose and the tissue exposed; and, there are significant differences in acute and delayed responses to IR exposure [5]. Delayed effects of IR on gene expression are not only associated with cancer initiation and promotion in normal cells but are also known to play a critical role in the development of resistance to therapy in cancer cells [5]. Therefore, radiation treatment of breast cancer has on the one hand the potential for cancer recurrence and on the other the risk for developing new cancer in the contralateral breast [4]. Despite the fact that radiation exposure causes persistent changes in gene expression, data on radiation-induced long-term alterations in gene expression in mammary tissues are of limited availability. Furthermore, there are no reports in the literature of long-term microarray-based studies of changes in mouse mammary gland gene expression after exposure to radiation doses relevant to therapeutic procedures. Considering the carcinogenic potential of radiation exposure to mammary glands, it is important to understand how radiation modulates long-term gene expression changes and how these changes relate to oncogenic signaling pathways known to be involved in breast cancer initiation and progression. Therefore, the goals of this study were to characterize persistent transcriptomic alterations and explore how these alterations relate to biological functions in whole body exposed 6 to 8 week old female C57BL6/J mouse mammary glands 2 months after exposure to 2 Gy γ radiation.
Methods
Mice and irradiation
Mice (C57BL/6J, female, 6-8 week old) were purchased from Jackson Laboratories (Bar Harbor, ME, USA) and were housed at the Georgetown University’s (GU) animal facility. All the animal procedures were performed as per protocol approved by GU Animal Care and Use Committee (GUACUC). Mice were placed in a circular pie shaped, well-ventilated plastic mouse holder, the mouse holder with mice was positioned on a rotating turntable inside the irradiator, and mice were exposed to γ radiation using a 137Cs source. Radiation dose was delivered at a rate of 1 Gy/min and a total dose of 2 Gy was delivered to the whole body and the control groups were sham irradiated. After irradiation mice were returned to their home cage, and monitored regularly.
RNA isolation
Mice were euthanized by asphyxiation using CO2 as per GUACUC approved protocol and mammary glands were surgically removed 2 month after radiation exposure for RNA extraction. For RNA extraction, we used no. 4 mammary gland from the left side of each mouse and four such mice were used in each experimental group. Total RNA was isolated with Trizol reagent (Invitrogen, Carlsbad, CA) from fresh or flash frozen mammary glands followed by purification over an RNeasy column according to the manufacturer’s instructions (Qiagen, Germantown, MD) and stored at -80°C for further use. RNA quality was determined using a Bioanalyzer (Agilent Technologies, Palo Alto, CA).
Microarray analysis
Cy3-labeled cRNA was generated from 300 ng total RNA using Agilent’s Low RNA Input Linear Amplification PLUS kit. Cy3-labeled cRNA (1.65 μg) was hybridized to Agilent’s Mouse Whole Genome arrays (G4122F) with Agilent’s GEx Hybridization HI-RPM Buffer. The samples were hybridized for 16 hours in a rotisserie hybridization oven (G2545A, Agilent Technologies, Santa Clara, CA, USA), then washed with Agilent’s gene expression wash buffers and scanned with an Agilent DNA Microarray Scanner 2505A in an ozone hood. Subsequent image analysis, data extraction, and background corrections were performed with Agilent’s Feature Extraction Software 9.1. Extracted data were then analyzed using GeneSpring GX 10.0 (Agilent Technologies) to identify genes that had significantly changed expression between control and the irradiated group. Although small sample size (3 to 5 biological replicates) conventionally used in microarray experiments has its limitations, the large data sets used in comparative analysis provide enough statistical power to derive biologically meaningful inferences from the results (discussed in Prolla, 2002 [6]). Genes considered significantly (p<0.05, t-test with Benjamini-Hochberg correction [7]) and differentially (fold change ≥2.0) regulated were listed separately.
Pathway analysis for biological functions
Significantly perturbed gene lists generated from microarray analysis were uploaded onto Ingenuity Pathway Analysis (IPA, Ingenuity Systems Inc., Redwood City, CA, USA) for assignment of biological function as well as for identifying perturbed signal transduction networks. IPA combines the uploaded data and the Ingenuity Pathways Knowledge Base (IPKB), created with information from available literature, to identify biological networks that are significantly over-represented in the gene expression data. Right-tailed Fisher's exact test is applied to determine the level of significance for each network and the p-value is displayed as score, which is the negative log of that p-value. A score of 8 indicates that there is a 1 in 108 chance that the focus genes are together in a network due to random chance alone. Furthermore, IPA uses a built-in library to identify association between the uploaded genes with the canonical pathways present in the knowledge base. In addition to providing a significance score, IPA also calculates the number of genes within a dataset that are present in each significantly perturbed pathway.
Quantitative real time PCR (qRT-PCR)
For confirmation of microarray data by qRT-PCR, cDNA was generated from 1.5 μg RNA using the RT2 First Strand Kit as per recommendation (SA Biosciences, Frederick, MD, USA). Primers for PPP4c (protein phosphatase 4, catalytic subunit; Cat# PPM28940A), MAPK12 (mitogen-activated protein kinase 12; Cat#PPM04541C), PLCG1 (phospholipase C, gamma 1; Cat#PPM004022B), and β-actin (Cat# PPM02945A) were obtained from SA Biosciences. Primers for E2F6 (Forward primer: 5’-GATGGCATCGAACTGGTGGAA-3’; reverse primer: 5’-CCCCAAAGTTGTTCAGGTCAG-3’ [8]), and ELF1 (Forward primer: 5’-TGTCCAACAGAACGACCTAGT-3’; reverse primer: 5’ CACACAAGCTAGACCAGCATAA-3’ [8]) were obtained from Eurofins MWG Operon (Huntsville, AL, USA). Primer for NFkβ, which is the nodal molecule of the top scoring molecular pathway network identified from the microarray data set by IPA, was also obtained from Eurofins MWG Operon (Forward primer: 5’-AGCACATAGATGAACTCCG-3’; reverse primer: 5’- CTGTAAAGCTGAGTTTGCG-3’ [9]). Using the RT2 SYBR Green/Fluorescein qPCR Master mix (SA Biosciences) qRT-PCR was performed on an ABI 7900HT (Applied Biosystems, Carlsbad, CA, USA) platform with temperature settings: 95°C (denaturation) for 10 min and then 40 cycles of 95°C for 15 sec, annealing/extension at 60°C for 1 min. The fold change was calculated using β-actin as an endogenous control following the comparative Ct (ΔΔCt) method as described previously [10]. Results were expressed relative to control samples, and three biological replicates were used in each experimental group. The error bar represents standard error of mean (SEM).
Results
Greater number of genes showed persistent upregulation following radiation exposure
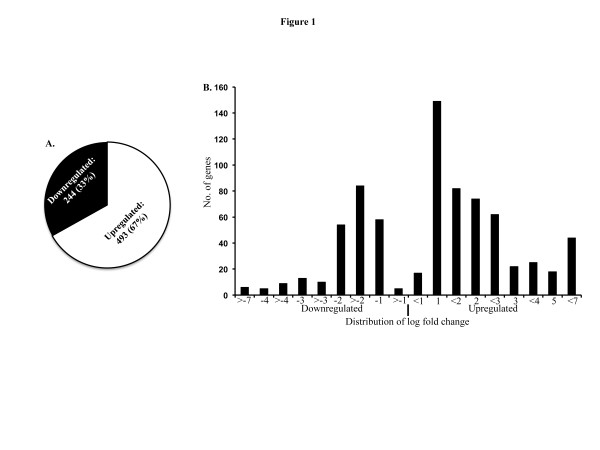
Global analysis of microarray data indicated that compared to control the mRNA level of a total of 737 genes remained perturbed 2-month after exposure to 2 Gy of γ radiation. While 67% (493 genes) of the genes were upregulated, we observed that only 33% (244 genes) of the genes were downregulated (Figure 1A). When we assessed the scale of variation in the significantly perturbed genes’ list (relative to control p<0.05 and above 2-fold), the majority of the upregulated fold changes were between 1 and 3 fold and the majority of the downregulated fold changes were between 1 and 2 fold (Figure 1B).
Figure 1.
Exposure to ionizing radiation results in persistent perturbations of mammary gland gene expression.A) Total number of transcripts perturbed 2-month after exposure to 2 Gy of whole body γ radiation. About 67% of the transcriptomes were upregulated and 33% remained downregulated. B) Transcripts significantly modulated relative to control (p<0.05 and more than 2-fold change) were plotted showing fold change distribution. Most of the upregulated genes were between 1 and 3 fold and the downregulated genes were clustered mostly between -1 and -2 fold.
Quantitative real time PCR confirmation of microarray data
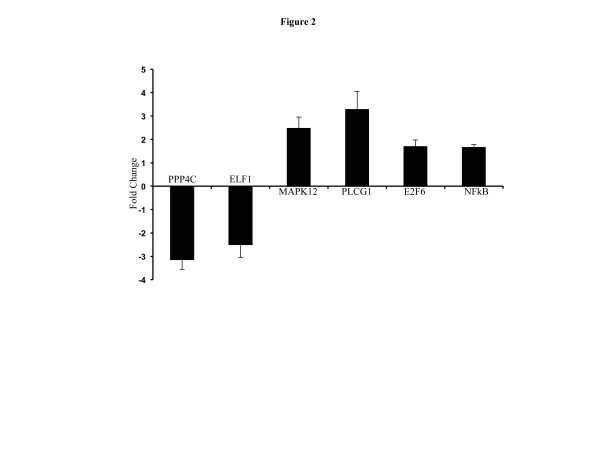
We performed qRT-PCR on five selected differentially expressed genes to confirm microarray data. The PCR data on PPP4c, ELF1, MAPK12, PLCG1, and E2F6 exhibited a trend similar to our microarray measurements (Figure 2). Compared to control, PPP4c (fold change -3.14 ± 0.41 standard error of mean (SEM); p<0.001; microarray fold change -1.54) and ELF1 (fold change -2.49±0.55; p<0.003; microarray fold change -1.78) was downregulated and were consistent with microarray results. Also, in agreement with our microarray data, we observed upregulation of MAPK12 (2.47±0.47; p<0.02; microarray fold change 1.85), PLCG1 (3.28±0.76; p<0.02; microarray fold change 1.96), and E2F6 (1.69±0.28; p<0.04; microarray fold change 1.7) expression. We also performed qRT-PCR of NFkβ, which is the nodal molecule of the highest scoring molecular network obtained from IPA (fold change 1.65 ± 0.12; p<0.03 in γ irradiated samples compared to control; Figure 2).
Figure 2.
Confirmation of microarray data by PCR analysis. Results of PCR analysis of 2 downregulated (PPP4C, and ELF1) and 3 upregulated (MAPK12, PLCG1, and E2F6) genes showed a trend similar to the microarray fold change. NFkβ is the nodal molecule of the top upregulated network.
Pathway analysis shows upregulation of metabolic and proliferative pathways
To identify which pathways were perturbed 2 months after radiation exposure, we subjected the up and downregulated gene sets to IPA. The results of the analysis associating altered genes to specific canonical pathways are presented in Table 1 (Upregulated) and 2 (Downregulated), and also in Figure 3A (Upregulated) and B (Downregulated). While the upregulated gene sets were significantly associated with 37 canonical pathways (35 presented in Table 1) with a p value cutoff of 0.05 (corresponds to -log p value of 1.3), the downregulated genes were mapped to 7 pathways with similar level of significance (Table 2). Most of the upregulated pathways were involved in cellular growth and proliferation including ‘ERK/MAPK signaling’, ‘14-3-3-mediated signaling’, ‘endothelin-1 Signaling’, ‘protein kinase A signaling’, ‘AMPK signaling’, and ‘corticotropin releasing hormone signaling’. At least two pathways related to breast cancer – ‘breast cancer regulation by Stathmin1’ and ‘HER-2 signaling in breast cancer’ – were also found to be upregulated. Metabolism was, also, a common theme among the upregulated pathways with the highest scoring pathways being ‘oxidative phosphorylation’ and ‘mitochondrial dysfunction’. Additionally, ‘glycolysis/gluconeogenesis’, ‘inositol metabolism’, and ‘ubiquinone biosynthesis’ were in the top 10 upregulated pathways. The downregulated gene sets were mapped to fewer canonical pathways none of which are associated with cellular metabolism or proliferation except for the ‘G-protein coupled receptor signaling’. All the up and downregulated canonical pathways obtained from the IPA are presented in Additional files 1 (Upregulated) and 2 (Downregulated) for reference.
Table 1.
Significant upregulation of pathways involved in cell proliferation, metabolism and breast cancer
| Ingenuity Canonical Pathways | -log(p-value) | Molecules |
|---|---|---|
| Oxidative phosphorylation |
4.16 |
ATP6V0E2, NDUFC1, COX6B1, NDUFS8, COX10, COX5A, NDUFS6, NDUFA12, COX7A1, ATP5G3 |
| Mitochondrial dysfunction |
4.06 |
COX6B1, NDUFS8, COX10, CPT1B, COX5A, TRAK1, NDUFS6, NDUFA12, MAPK12, COX7A1 |
| Breast cancer regulation by Stathmin1 |
3.81 |
PPP1R14C, PIK3C2B, E2F6, ADCY2, PRKCQ, CAMK2A, TUBA8, PPM1L, PPP2R5B, TUBA4A, PPP1R3A, TUBA3C/TUBA3D |
| ERK/MAPK signaling |
2.81 |
PLA2G4E, PPP1R14C, PIK3C2B, TLN2, PLA2G12A, HSPB2, PPM1L, PPP2R5B, PLCG1, PPP1R3A |
| Cardiac β-adrenergic signaling |
2.56 |
PPP1R14C, ADCY2, PPM1L, PPP2R5B, PDE4A, AKAP6, PPP1R3A, PDE4D |
| Glycolysis/gluconeogenesis |
2.47 |
PGK1, PGM1, ALDOA, TPI1, Gapdh (includes others), LDHB |
| Inositol metabolism |
2.46 |
ALDOA, TPI1 |
| Ubiquinone biosynthesis |
2.46 |
NDUFC1, NDUFS8, UFSP1, NDUFS6, NDUFA12 |
| 14-3-3-mediated signaling |
2.44 |
PIK3C2B, PRKCQ, TUBA8, TUBA4A, PLCG1, TUBA3C/TUBA3D, MAPK12 |
| Aldosterone signaling in epithelial cells |
2.16 |
PIK3C2B, SACS, PRKCQ, HSPA1L, DNAJC27, HSPB2, PLCG1, DNAJB5 |
| Production of nitric oxide and reactive oxygen species in macrophages |
2.14 |
PPP1R14C, PIK3C2B, PRKCQ, PPM1L, PPP2R5B, PLCG1, PPP1R3A, MAPK12 |
| Fc epsilon RI signaling |
2.03 |
PLA2G4E, PIK3C2B, PRKCQ, PLA2G12A, PLCG1, MAPK12 |
| Endothelin-1 signaling |
2.03 |
PLA2G4E, PIK3C2B, ADCY2, PRKCQ, PLA2G12A, GNAO1, PLCG1, MAPK12 |
| Dopamine receptor signaling |
1.96 |
PPP1R14C, ADCY2, PPM1L, PPP2R5B, PPP1R3A |
| CCR3 signaling in eosinophils |
1.83 |
PLA2G4E, PIK3C2B, PRKCQ, PLA2G12A, CFL2, MAPK12 |
| Type II diabetes mellitus signaling |
1.81 |
PIK3C2B, RKCQ, PRKAB2, MAPK12, ADIPOR1, KCNJ11 |
| Thrombopoietin signaling |
1.75 |
PIK3C2B, THPO, PRKCQ, PLCG1 |
| CTLA4 signaling in cytotoxic T lymphocytes |
1.73 |
PIK3C2B, AP1S2, PPM1L, PPP2R5B, PLCG1 |
| CDK5 signaling |
1.71 |
PPP1R14C, ADCY2, PPM1L, PPP2R5B, PPP1R3A |
| TR/RXR activation |
1.69 |
PIK3C2B, RXRG, SLC16A3, UCP1, PPARGC1A |
| Protein kinase A signaling |
1.68 |
PPP1R14C, ADCY2, PRKCQ, CAMK2A, HIST1H1A, PDE4A, PLCG1, AKAP6, PPP1R3A, TTN, PDE4D |
| Synaptic long term depression |
1.65 |
PLA2G4E, PRKCQ, PLA2G12A, PPM1L, GNAO1, PPP2R5B |
| Role of MAPK signaling in the pathogenesis of influenza |
1.62 |
PLA2G4E, PLA2G12A, MAPK12, RABGEF1 |
| Cell cycle regulation by BTG family proteins |
1.58 |
E2F6, PPM1L, PPP2R5B |
| MIF regulation of innate immunity |
1.52 |
PLA2G4E, PLA2G12A, MAPK12 |
| glioma signaling |
1.52 |
PIK3C2B, E2F6, PRKCQ, CAMK2A, PLCG1 |
| Phenylalanine, tyrosine and tryptophan biosynthesis |
1.50 |
GOT1, GOT2 |
| AMPK signaling |
1.48 |
PIK3C2B, PRKAB2, CPT1B, PPM1L, PPP2R5B, MAPK12 |
| Melatonin signaling |
1.46 |
PRKCQ, CAMK2A, GNAO1, PLCG1 |
| Macropinocytosis signaling |
1.44 |
PIK3C2B, PRKCQ, PLCG1, ITGB6 |
| Cysteine metabolism |
1.43 |
GOT1, GOT2, LDHB |
| ILK signaling |
1.40 |
PIK3C2B, CFL2, PPM1L, PPP2R5B, MAPK12, ITGB6, MYH1 |
| Protein ubiquitination pathway |
1.38 |
SACS, USP15, HSPA1L, USP13, UBE2B, DNAJC27, HSPB2, USP2, DNAJB5 |
| Corticotropin releasing hormone Signaling |
1.32 |
ADCY2, PRKCQ, GNAO1, PLCG1, MAPK12 |
| HER-2 signaling in breast cancer | 1.30 | PIK3C2B, PRKCQ, PLCG1, ITGB6 |
Figure 3.
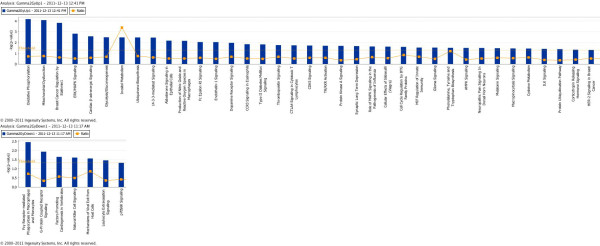
Radiation-induced alterations in canonical pathways identified by Ingenuity Pathway Analysis.A) A total of 37 canonical pathways were significantly upregulated (p<0.05 indicated by threshold line). B) A total of 7 canonical pathways were downregulated (p<0.05).
Table 2.
Few pathways were downregulated and fewer were involved in cellular proliferation
| Ingenuity Canonical Pathways | -log(p-value) | Molecules |
|---|---|---|
| Fcγ receptor-mediated phagocytosis in macrophages and monocytes |
2.44 |
EZR, LYN, ACTG1, PRKCB |
| G-Protein coupled receptor signaling |
1.92 |
PRLHR, GPR173, PTGIR, GPRC5A, GLP2R, FZD3, GPR113, ADCY7, CELSR2, PRKCB |
| Factors promoting cardiogenesis in vertebrates |
1.64 |
FZD3, TDGF1, PRKCB |
| Natural killer cell signaling |
1.60 |
SH3BP2, Klra4 (includes others), PRKCB |
| Mechanisms of viral exit from host cells |
1.55 |
ACTG1, PRKCB |
| Leukocyte extravasation signaling |
1.45 |
EZR, MMP11, ACTG1, PRKCB |
| p70S6K signaling | 1.32 | LYN, RPS6, PRKCB |
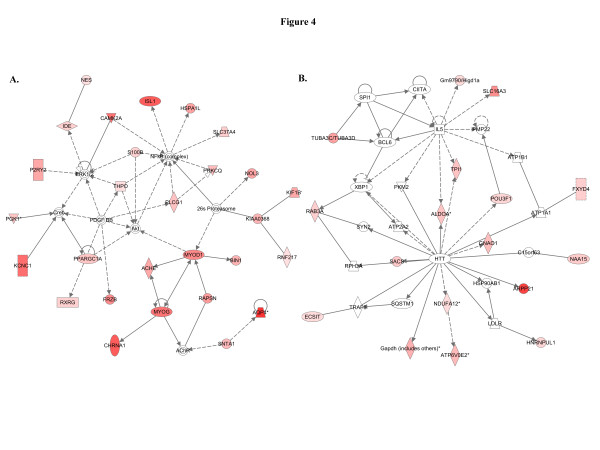
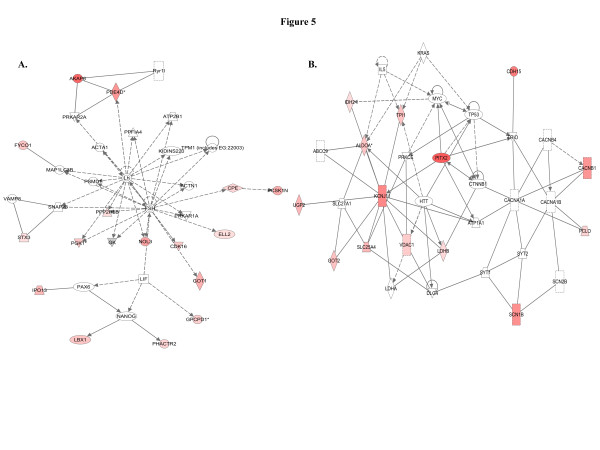
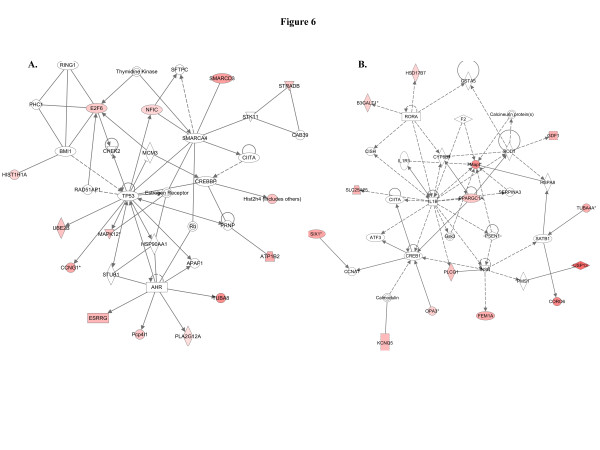
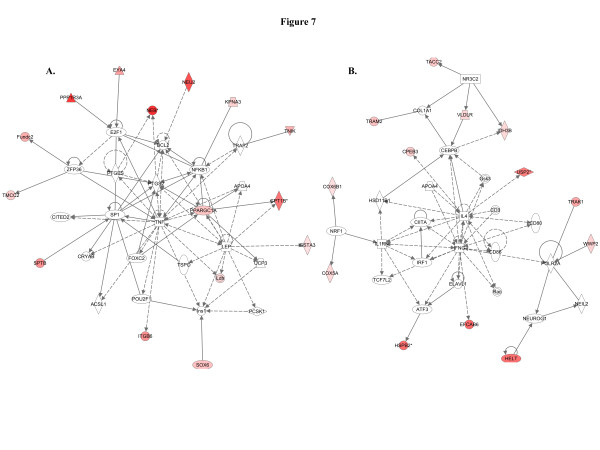
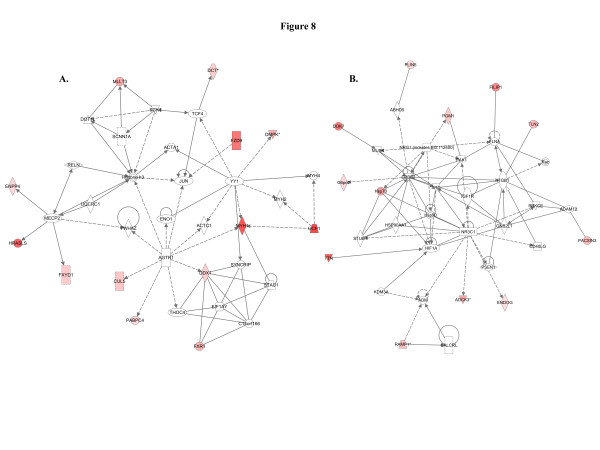
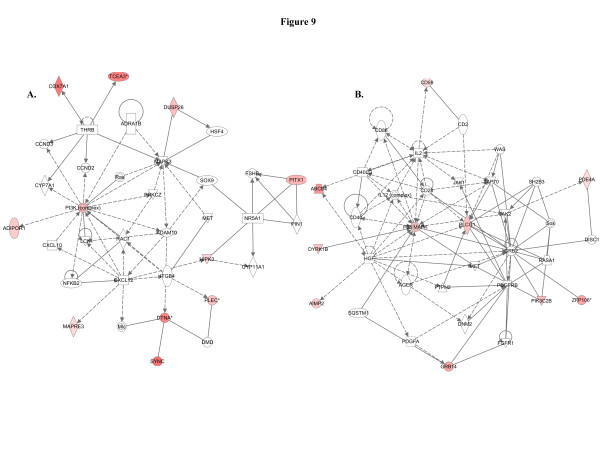
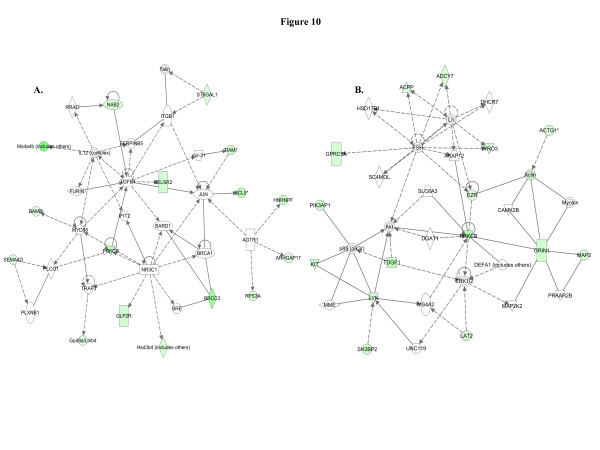
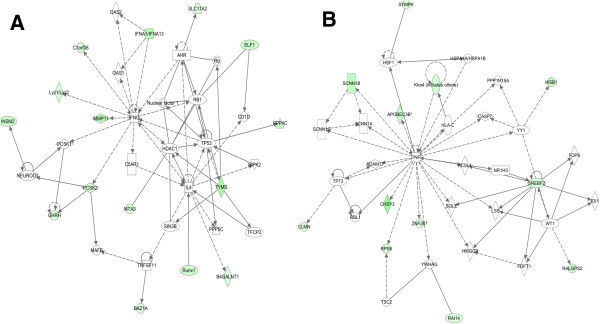
When we used IPA to map the sets of perturbed genes to gene interaction networks in the Ingenuity Pathways Knowledge Base (IPKB), the upregulated genes were mapped to a total of 23 networks, whereas the downregulated genes were associated with 13 signaling networks. Networks with score ≥8 for the up and downregulated genes are presented in Tables 3 (12 upregulated networks had a score of ≥8) and 4 (4 downregulated networks had a score of ≥8), respectively, and genes from the microarray dataset are identified in bold. Graphical presentation of the up and downregulated networks with a score of ≥8 demonstrates long-term signaling pathway alterations after radiation exposure (Figures 4, 5, 6, 7, 8, 9, 10 and 11). The functions related to upregulated networks ranges from cell death, cell cycle, cell growth and development to carbohydrate and lipid metabolism. Among the upregulated genes, the network with highest score has NFkβ as the nodal molecule (Figure 4A) and, as shown above, qRT-PCR analysis illustrated a 1.65-fold increase in expression of NFkβ in irradiated samples relative to control samples (Figure 2). The network with second highest score has the IL5 (interleukin 5) and HTT (huntingtin) as the nodal molecules and are presented in Figure 4B. The third highest scoring network is involved in the regulation of reproductive system development and function with LH (luteinizing hormone) and FSH (follicle stimulating hormone) as the nodal molecule (Figure 5A) and the fourth is involved in cellular metabolism with KCNJ11 (potassium inwardly-rectifying channel, subfamily J, member 11) as the nodal molecule (Figure 5B). The fifth pathway is involved in cell cycle and cell death and has TP53 as the nodal molecule (Figure 6A). Importantly, the sixth, seventh, and the eighth pathway networks have IL1β (Figure 6B), tumor necrosis factor (TNF; Figure 7A), and IL4/IFNγ (Figure 7B) respectively as the nodal molecules. We also observed that angiotensin receptor type 1 (AGTR1; Figure 8A) and ERBB2 (Figure 8B) are the nodal molecules in ninth and tenth IPA network and has relevance to breast cancer. The eleventh network with PI3K complex (Figure 9A) as its nodal molecule and the twelfth pathway with p38 MAPK (Figure 9B) as its nodal molecule are also known to play important roles in breast cancer initiation and progression. Among the downregulated networks 4 had scores ≥8 and the networks with score in descending order have TGFβ (Figure 10A), PRKCβ (Figure 10B), IFNγ (Figure 11A), and TNF (Figure 11B) as the nodal molecules respectively and are involved in a variety of cellular functions from cell growth and proliferation to lipid metabolism and small molecule biochemistry. Genes, which were significantly associated with the pathway networks in IPA were searched in the literature for their roles in breast cancer and are compiled along with relevant references in Table 5 for upregulated genes and in Table 6 for downregulated genes. A total of 27 upregulated (ACHE [11], HSPA1L [12], NES [13], P2RY2 [14], PLCG1 [15], PPARGC1A [16], PRKCQ [17], SNTA1 [18], ALDOA [19], GNAO1 [20], SLC16A3 [21], TPI1 [22], ELL2 [23], CCNG1 [24], E2F6 [25], ESRRG [26], MAPK12 [27], HSD17B7 [28], TACC2 [29], DDX1 [30], MYH1 [31], UCP1 [32], PACSIN3 [33], PGM1 [34], TLN2 [35], ADIPOR1 [36], PITX1 [37]) and 8 downregulated genes (CELSR2 [38], PRKCB [39], KIT [40], MAP2 [41], TDGF1 [42], ELF1 [43], RUNX1 [44], TYMS [45]) showed association with breast cancer. Furthermore, the data files with the complete list of the upregulated and downregulated networks are presented in Additional files 3 and 4, respectively, for further reference.
Table 3.
Upregulated networks with score ≥8 are presented
| ID | Molecules in Network | Score | Focus Molecules | Top Functions |
|---|---|---|---|---|
| 1 |
26sProteasome, ACHE, AChR, Akt, AQP4, BIN1, CAMK2A, CHRNA1, Creb,ERK1/2, FRZB, HSPA1L, IDE, ISL1, KCNC1, KIAA0368, KIF1B, MYOD1, MYOG, NES, NFkB (complex),NOL3, P2RY2, PDGF BB, PGK1, PLCG1, PPARGC1A, PRKCQ, RAPSN, RNF217, RXRG, S100B, SLC37A4, SNTA1, THPO |
44 |
28 |
Cell Death, Neurological Disease, Cellular Development |
| 2 |
ALDOA, ARPP21, ATP1A1, ATP1B1, ATP2A2, ATP6V0E2, BCL6, C15orf63, CIITA, ECSIT, FXYD4, Gapdh (includes others), Gm9790/Higd1a, GNAO1, HNRNPUL1, HSP90AB1, HTT, IL5, LDLR, NAA15, NDUFA12, PKM2, PMP22, POU3F1, RAB3A, RPH3A, SACS, SLC16A3, SPI1, SQSTM1, SYN2, TPI1, TRAF6, TUBA3C/TUBA3D, XBP1 |
21 |
17 |
Genetic Disorder, Neurological Disease, Skeletal and Muscular Disorders |
| 3 |
ACTA1, ACTN1, AKAP6, ATP2B1, CDK16, CPE, ELL2, FSH, FYCO1, GK, GOT1, GPCPD1, IPO13, KIDINS220, LBX1, Lh, LIF, MAP1LC3B, NANOG, NOL3, PAX6, PCSK1N, PDE4D, PGK1, PHACTR2, PPFIA4, PPP2R5B, PRKAR1A, PRKAR2A, PSMD1, Ryr1l, SNAP23, STX3, TPM1 (includes EG:22003), VAMP8 |
19 |
16 |
Reproductive System Development and Function, Cellular Development, Cellular Growth and Proliferation |
| 4 |
ABCC9, ALDOA, ATP1A1, CACNA1A, CACNA1B, CACNB1, CACNB4, CDH15, CTNNB1, DLG4, GOT2, HTT, IDH2, IL5, KCNJ11, KRAS, LDHA, LDHB, MYC, PCLO, PITX2, PRKCE, SCN1B, SCN2B, SLC25A4, SLC27A1, SYT1, SYT2, TP53, TPI1, TRIO, UGP2, VDAC1 |
16 |
14 |
Molecular Transport, Genetic Disorder, Carbohydrate Metabolism |
| 5 |
AHR, APAF1, ATP1B2, BMI1, CAB39, CCNG1, CHEK2, CIITA, CREBBP, E2F6, ESRRG, Estrogen Receptor, HIST1H1A, Hist2h4 (includes others), HSP90AA1, MAPK12, MCM3, NFIC, Pcp4l1, PHC1, PLA2G12A, PRNP, RAD51AP1, Rb, RING1, SFTPC, SMARCA4, SMARCD3, STK11, STRADB, STUB1, Thymidine Kinase, TP53, TUBA8, UBE2B |
16 |
14 |
Cell Cycle, Cell Death, Hematological System Development and Function |
| 6 |
ATF3, B3GALT1,Calcineurin protein(s), Calmodulin, CCNA1, CIITA, CISH, CORO6, CREB1, CYP8B1, F2, FEM1A, GDF1, Gsk3, GSTA5, HSD17B7, HSPA8, IL1B, IL1R1, INSR, KCNQ5, Mapt, OPA3, PLCG1, PMS1, PPARGC1A, PSEN1, RORA, SATB1, SERPINA3, SIX1, SLC25A25, SOD1, TUBA4A, USP13 |
16 |
14 |
Cell Death, Neurological Disease, Tissue Morphology |
| 7 |
ACSL1, APOA4, BCL2, CITED2, CPT1B, CRYAB, E2F1, EYA4, FOXC2, Fundc2, GSTA3, Ins1, ITGB6, KPNA3, Ldh, LEP, NEB, NEU2, NFKB1, PCSK1, POU2F1, PPARGC1A, PPP1R3A, PTGES, PTGS2, SOX6, SP1, SPTB, TMCC2, TNF, TNIK, TRAF2, TSPO, UCP3, ZFP36 |
16 |
14 |
Energy Production, Lipid Metabolism, Small Molecule Biochemistry |
| 8 |
APOA4, ATF3, CD3, CD80, CD86, CEBPB, CIITA, COL1A1, COX5A, COX6B1, CPEB3, EFCAB6, ELAVL1, Gsk3, HELT, HSD11B1, HSPB2, IDH3B, IFNG, IL4, IL1RN, IRF1, NEIL2, NEUROG1, NR3C2, NRF1, POLR2A, Rac, TACC2, TCF7L2, TRAK1, TRAM2, USP2, VLDLR, WWP2 |
14 |
13 |
Cellular Growth and Proliferation, Hematological System Development and Function, Tissue Development |
| 9 |
ACTA1, ACTC1, AGTR1, C14orf166, CUL5, DCT, DDX1, DMPK, DOT1L, EIF1AY, ENO1, ENPP4, FXR1, FXYD1, FZD9, Histone h3, HRASLS, JUN, MECP2, MLLT3, MYH1, MYH2, MYH4, PABPC4, RELN, SCNN1A, SGK1, STAU1, SYNCRIP, TCF4, THOC4, UCP1, UQCRC1, YWHAZ, YY1 |
14 |
13 |
Cellular Function and Maintenance, Molecular Transport, Cellular Assembly and Organization |
| 10 |
ABHD5, ADAM12, ADCK3, ADM, CALCRL, CD40LG, DOK7, ENDOG, ERBB2, FILIP1, FLNA, G6pd2, GNB2L1, HIF1A, Hsp70, Hsp90, HSP90AA1, IGF1R, ITGB1, KDM3A, MUSK, NR3C1, NRG1 (includes EG:112400), PACSIN3, PAK1, PGM1, PLIN5, PRKCE, PSEN1, Rac, RAMP1, SRC, STUB1, TLN2, TTN |
11 |
11 |
Cell Death, Cell-To-Cell Signaling and Interaction, Nervous System Development and Function |
| 11 |
ADAM10, ADIPOR1, ADRA1B, CCND2, CCND3, COX7A1, CXCL10, CXCL12, CYP11A1, CYP7A1, DMD, DTNA, DUSP26, FSHB, HIPK3, HSF4, ITGB4, LCK, MAPK3, MAPRE3, MET, Mlc, NFKB2, NR5A1, PI3K (complex), PIN1, PITX1, PLEC, PRKCZ, RAC1, Ras, SOX9, SYNC, TCEA3, THRB |
10 |
10 |
Cancer, Tissue Development, Embryonic Development |
| 12 | ABCB4, AGER, AIMP2, CD2, CD28, CD40, CD59, CD86, CD40LG, DISC1, DNM2, DYRK1B, FGFR1, GRB2, GRB14, HGF, IL2, IL12 (complex), JAK1, JAK2, MET, P38 MAPK, PDE4A, PDGFA, PDGFRB, PIK3C2B, PLCG1, PTPN2, ASA1, SH2B3, Sos, SQSTM1, WAS, ZAP70, ZFP106 | 8 | 9 | Cellular Movement, Cell Death, Immune Cell Trafficking |
Highlighted genes are from the microarray dataset.
Table 4.
Downregulated networks with score ≥8 are presented
| ID | Molecules in Network | Score | Focus Molecules | Top Functions |
|---|---|---|---|---|
| 1 |
AGTR1, ARHGAP17, BAMBI, BARD1, BCL9, BRCA1, BRCC3, BRE, CELSR2, FURIN, GLP2R, Gp49a/Lilrb4, HNRNPF, Hsd3b4 (includes others), IFIT2, IL12 (complex), ITGB1, JUN, mir-31, Ms4a4b (includes others), MYD88, NAB2, NR3C1, PLCG1, PLXNB1, PRKCB, RPS3A, RRAD, SEMA4D, SERPINB5, ST6GAL1, Talin, TGFB1, TIAM1, TRAF3 |
26 |
16 |
Cell Morphology, Cellular Growth and Proliferation, Hematological System Development and Function |
| 2 |
ACPP, ACTG1, Actin, ADCY7, AKAP12, Akt, CAMK2B, DEFA1 (includes others), DGAT1, DHCR7, ERK1/2, EZR, FSH, GPRC5A, GRIN1, HSD17B1, KIT, LAT2, Lh, LYN, MAP2, MAP2K2, MME, MS4A2, Myosin, p85 (pik3r), PIK3AP1, PRKAR2B, PRKCB, SC4MOL, SH3BP2, SLC6A3, TDGF1, TYRO3, UNC119 |
24 |
15 |
Cellular Compromise, Inflammatory Response, Cell Signaling |
| 3 |
AHR, B4GALNT1, BAZ1A, C1orf38, C5AR1, CD1D, ELF1, GHRH, HDAC1, HIPK2, IFNA1/IFNA13, IFNG,IL4, INSM2, Lyz1/Lyz2, MAFB, MMP11, MTA3, NEUROD1, Nuclear factor 1, OAS1, OAS2, PCSK1, PCSK2, PPP4C, PPP5C, RB1, Rb, Runx1, SIN3B, SLC17A2, TFCP2, TNFSF11, TP53, TYMS |
24 |
15 |
Tissue Morphology, Cancer, Gene Expression |
| 4 | ACSL1, ADAM17, APOBEC3B, CASP7, CHSY3, CLMN, FDFT1, FDPS, HLA-C, HMGCR, HSF1, HSPA1A/HSPA1B, IDI1, Klra4 (includes others), LSS, NR1H3, PPP1R15A, RAI14, RALGPS2, RBL1, RPS6, SCNN1A, SCNN1B, SCNN1G, SQLE, SREBF2, SYMPK, TNF, TP73, TSC2, WSB1, WT1, YWHAG, YY1, ZNF267 | 18 | 12 | Lipid Metabolism, Small Molecule Biochemistry, Vitamin and Mineral Metabolism |
Highlighted genes are from the microarray dataset.
Figure 4.
IPA identified two top signaling networks with genes involved in carcinogenesis.A) The first network is cellular growth and development network with NFkB as the nodal molecule. At least 12 (ACHE, HSPA1L, MYOD1, NES, NOL3, P2RY2, PGK1, PLCG1, PPARGC1A, PRKCQ, S100B, and SNTA1) genes from this upregulated network are associated with initiation and progression of human cancer. B) The second network is genetic disorder, neurological disease, skeletal and muscular disorders and at least 4 upregulated genes (ALDOA, GNAO1, SLC16A3, and TPI1) are known to be involved in cancer.
Figure 5.
Upregulation of cellular proliferation and metabolic pathways involved in neoplasia.A) The third upregulated network involves reproductive system development and function, cellular development, cellular growth and proliferation and upregulation of at least one gene (LBX1) has been associated with cellular transformation. B) The fourth upregulated network involves molecular transport, genetic disorder, carbohydrate metabolism and at least 5 (ALDOA, LDHB, SLC16A3, TPI1, VDAC1) genes are related to carcinogenesis.
Figure 6.
Cell cycle and cell death related pathways were upregulated. A) The fifth upregulated network is involved in cell cycle, cell death, hematological system development as well as estrogen signaling such as CCNG1, E2F6, and ESRRG. B) The molecules in the sixth network are know to regulate cell death, neurological disease, and tissue morphology.
Figure 7.
Two networks were associated with energy production and cell proliferation.A) Major functions associated with this network are energy production, lipid metabolism, and small molecule biochemistry, and has a score of 16. B) The eighth network had a score of 14 and major functions associated with this network are cellular growth and proliferation, hematological system development and function, and tissue development.
Figure 8.
Cell-to-cell signaling and molecular transport related to carcinogenesis were upregulated.A) With a score of 14 this pathway network is associated with cellular function and maintenance, molecular transport, cellular assembly and organization. B) Eleven genes from the microarray data set were associated with this pathway and identified cell death, cell-to-cell signaling and interaction, nervous system development and function as major functions.
Figure 9.
Cancer and cell death related pathways were upregulated.A) Genes in this pathway are involved in cancer, tissue development, and embryonic development. B) The twelfth network had a score of 8 and 9 genes from the data set are associated with the network which is involved in cellular movement, cell death, and immune cell trafficking.
Figure 10.
The downregulated networks may accelerate cellular transformation.A) The top downregulated network has TGFβ as the nodal molecule and downregulation of at least 8 genes (ARHGAP17, BAMBI, BCL9, BRCC3, CELSR2, NAB2, PRKCB, SEMA4D) in the network facilitates carcinogenesis. B) The second downregulated network has 6 genes (ACPP, GPRC5A, KIT, LYN, MAP2, and TDGF1) which may paly a role in cellular transformation.
Figure 11.
Balancing promotion and inhibition of cell proliferation in the downregulated networks.A) Although 1 gene (GHRH) involved in cell proliferation is downregulated in the third network, we observed downregulation of at least 4 key genes (ELF1, MTA3, RUNX1, and TYMS) related to tumor suppressor function. B) The fourth downregulated network with a significant score of 18 has TNF as the nodal molecule and downregulation of at least 2 genes (APOBEC3B, CHSY3) are known to promote carcinogenesis.
Table 5.
Genes from upregulated networks: A number of genes from the data set are associated with breast cancer
| Gene | Full name | Role in breast cancer quoted from literature |
|---|---|---|
|
ACHE |
Acetylcholinesterase |
“Tumor size was significantly higher when the ACHE gene was amplified in breast cancer.”
[11]. |
|
HSPA1L |
heat shock 70kDa protein 1-like |
“….HSPA1L and HSPA2 could represent potential biomarkers to follow up the effectiveness of 17AAG in breast cancer”
[12]. |
|
NES |
Nestin |
“Among the breast cancer subtypes, nestin is highly expressed in basal breast cancer subtype”
[13]. |
|
P2RY2 |
purinergic receptor P2Y, G-protein coupled, 2 |
“P2Y2 receptor-mediated modulation of estrogen-induced proliferation of breast cancer cells”
[14]. |
|
PLCG1 |
phospholipase C, gamma 1 |
“Phospholipase Cgamma1 is required for metastasis development and progression”
[15]. |
|
PPARGC1A |
peroxisome proliferator-activated receptor gamma, coactivator 1 alpha |
“Associations of genetic variants in the estrogen receptor coactivators PPARGC1A, PPARGC1B and EP300 with familial breast cancer”
[16]. |
|
PRKCQ |
protein kinase C, theta |
“PKCtheta promotes c-Rel-driven mammary tumorigenesis in mice”
[17]. |
|
SNTA1 |
syntrophin, alpha 1 |
“….significant increase in expression of SNTA1 protein compared with the normal tissue was observed in breast carcinoma samples”
[18]. |
|
ALDOA |
Aldolase A |
“…hypoxia-responsive; prognostic significance in breast cancer”
[19]. |
|
GNAO1 |
guanine nucleotide binding protein (G protein), alpha activating activity polypeptide O |
“GNAO1 (Gαo) gene was identified in breast carcinomas and shown to promote oncogenic transformation when introduced into cells”
[20]. |
|
SLC16A3 |
solute carrier family 16, member 3 |
“Expression of SLC16A3 gene is higher in breast cancer distant metastasis….”
[21]. |
|
TPI1 |
triosephosphate isomerase 1 |
“Glycolytic cancer associated fibroblasts promote breast cancer tumor growth, without a measurable increase in angiogenesis: evidence for stromal-epithelial metabolic coupling”
[22]. |
|
ELL2 |
elongation factor, RNA polymerase II, 2 |
ELL2 is a Breast Cancer Antioestrogen Resistance (BCAR) 1 gene which control anti-oestrogen-resistant cell growth resistance (BCAR)
[23]. |
|
CCNG1 |
cyclin G1 |
“We have identified cyclin G as being overexpressed in breast and prostate cancer cells”
[24]. |
|
E2F6 |
E2F transcription factor 6 |
“E2F6 represses transcription of the brca1, ctip, art27, hp1α, and the rbap48 genes….”
[25]. |
|
ESRRG |
Estrogen-related receptor γ |
“Estrogen-related receptor γ modulates cell proliferation and estrogen signaling in breast cancer & ERRγ mRNA was up-regulated dose-dependently by estrogen….”
[26]. |
|
MAPK12 |
mitogen-activated protein kinase 12. Also known as ERK3; ERK6; SAPK3; PRKM12; SAPK-3; P38GAMMA |
“…elevated expression of p38γ is associated with lower overall survival of patients with breast cancer”
[27]. |
|
HSD17B7 |
hydroxysteroid (17-beta) dehydrogenase 7 |
The stimulation of HSD17B7 expression by estradiol provides a powerful feed-forward mechanism for estradiol biosynthesis in breast cancer cells
[28]. |
|
TACC2 |
transforming, acidic coiled-coil containing protein 2 |
“This suggests that increased TACC2 may mediate an oncogenic effect on breast cancer cells and indicates that TACC2 may be a potential therapeutic target”
[29]. |
|
DDX1 |
DEAD (Asp-Glu-Ala-Asp) box polypeptide 1 |
“Here, we identify DDX1 RNA overexpression as an independent prognostic marker for early recurrence in primary breast cancer……”
[30]. |
|
MYH1 |
myosin, heavy chain 1, skeletal muscle, adult |
Recently, MYH1 encoding skeletal muscle myosin heavy polypeptide 1 and MYH9 encoding non-muscle myosin heavy chain type A, were identified as candidate breast cancer genes in systematic analyses of the breast cancer genome
[31]. |
|
UCP1 |
uncoupling protein 1 (mitochondrial) |
We conclude that UCP1 is up-regulated in breast cancer cell lines and primary breast as well as other tumors
[32]. |
|
PACSIN3 |
Protein kinase C and casein kinase substrate in neurons protein 3 |
“New targets for breast cancer treatment were identified such as ZONAB, PACSIN3, MRP8 and SUMO1, which have human homologues”
[33]. |
|
PGM1 |
phosphoglucomutase 1 |
“This gene has been identified as one of the ER status markers in the diagnosis and prognosis of breast cancer patients….”
[34]. |
|
TLN2 |
talin 2 |
“Serum estradiol levels associated with specific gene expression patterns in normal breast tissue and in breast carcinomas……”
[35]. |
|
ADIPOR1 |
adiponectin receptor 1 |
“Variants of the Adiponectin and Adiponectin Receptor 1 Genes and Breast Cancer Risk…”
[36]. |
| PITX1 | paired-like homeodomain 1 | “The estrogen-regulated transcription factor PITX1 coordinates gene-specific regulation by estrogen receptor-alpha in breast cancer cells…” [37]. |
Table 6.
Genes from downregulated network
| Gene | Full name | Role in cancer quoted from literature |
|---|---|---|
|
CELSR2 |
cadherin, EGF LAG seven-pass G-type receptor 2 |
“Celsr2 was down-regulated in one cell line and in 7% of breast cancers”
[38]. |
|
PRKCB |
protein kinase C, beta |
PRKCB has been observed to be downregulated in estrogen receptor negative breast cancer
[39]. |
|
KIT |
v-kit Hardy-Zuckerman 4 feline sarcoma viral oncogene homolog. Also known as C-Kit; CD117 |
Loss of c-kit expression has been reported in 80-90% of breast cancer specimens, suggesting a possible role in the development of tumors
[40]. |
|
MAP2 |
microtubule-associated protein 2 |
“Elevation of MAP2 in breast cancer cell lines led to increased paclitaxel sensitivity” [41]. |
|
TDGF1 |
teratocarcinoma-derived growth factor 1. Also known as CR; CRGF; CRIPTO |
“Overexpression of human Cripto-1 in transgenic mice delays mammary gland development and differentiation and induces mammary tumorigenesis”
[42]. |
|
ELF1 |
E74-like factor 1 |
“All of the mouse and most human mammary tumors also displayed decreased expression of genes known to inhibit cell proliferation, including NFKBIA (IKBalpha), GADD45B, and CDKN1A (p21); transcription-related genes such as CEBP, JUN, JUNB, and ELF1;….”
[43]. |
|
RUNX1 |
runt-related transcription factor 1 |
“Furthermore, we found that RUNX1 expression was reduced in high-grade primary breast tumors compared to low/mid-grade tumors”
[44]. |
| TYMS | thymidylate synthetase | “Gene polymorphisms in TYMS, MTHFR, p53 and MDR1 as risk factors for breast cancer: a case–control study” [45]. |
A number of genes identified with the downregulated networks are associated with breast cancer.
Discussion
Mammary gland is sensitive to the carcinogenic actions of radiation and epidemiological data strongly correlates radiation exposure and breast cancer [1,2]. Here we demonstrate that exposure of 6 to 8 week old female mice to 2 Gy of γ radiation, a dose relevant to fractionated radiotherapy, induced long-term gene expression changes in the mammary glands. These changes are associated with molecular pathways that have the potential to enhance the chance of malignant transformation. We show that even after two months, a significant number of genes remain perturbed and that the majority of them are upregulated. Broadly, these genes are categorized into two major interdependent cellular functions – proliferation and metabolism. Upregulation of proliferative functions supported by induction of adaptive energy producing pathways is also observed in cancer cells [46]. Cancer, described as a chronic and multifactorial disease, was not observed in these mice within the study duration of 2 month. However, we did observe alterations in signaling pathways that may be considered potential carcinogenic precursors events.
The top network with a score of 44 associated 28 genes from the data set and literature indicates that at least 12 (ACHE, HSPA1L, MYOD1, NES, NOL3, P2RY2, PGK1, PLCG1, PPARGC1A, PRKCQ, S100B, and SNTA1) of them are involved in human cancer (genes relevant to breast cancer are presented with relevant references in Tables 5 and 6). Indeed, dysregulation of ACHE, HSPA1L, NES, P2RY2, PLCG1, PPARGC1A, PRKCQ, S100B, and SNTA1 genes have been implicated in breast cancer progression and metastasis due to higher proliferation and increase cell migration (Tables 5 and 6). Cellular metabolism and transportation related genes (ALDOA, SLC16A3, TPI1, LDHB, KCNQ5, and PGM1), which are implicated in human cancer, also remained upregulated even 2-month after radiation exposure. Importantly, induction of glycolytic enzymes like aldolase A (ALDOA), lactate dehydrogenase (LDH), triosephosphate isomerase 1 (TPI1), and phosphoglucomutase 1 (PGM1), we believe, is supporting cellular growth and development resulting from upregulated proliferative signaling pathways. It has been proposed that in a ‘Reverse Warburg Effect’ the glycolytic pathway is upregulated in stromal cells generating pyruvate/lactate, which can then be utilized by adjacent epithelial cells for oxidative phosphorylation in mitochondria [22]. Indeed, upregulation of ‘oxidative phosphorylation’ and ‘mitochondrial dysfunction’ are the two top canonical pathways observed in the IPA and are reported to be associated with breast cancer [47]. While stromal cell niche is known to play important roles in mammary gland carcinogenesis, we are yet to determine whether there are differential alterations of gene expression in stromal vs. epithelial cells and would require separate microarray analysis of stromal and epithelial compartment in mammary glands. However, considered along with the fact that in a whole boy irradiated mice all the tissue compartments are exposed to radiation, our results led us to speculate that differential alterations of gene expression in stromal vs. epithelial cells could occur in mammary gland to promote radiation carcinogenesis and is supportive of what has been reported in the literature [48,49]. Interestingly, both ALDOA and SLC16A3 are also suggested to be hypoxia responsive and is upregulated in hypoxic breast cancer with poor outcome. SLC16A3 is known to allow efflux of lactate [21], which we believe is produced in excess due to radiation-induced upregulation of glycolytic enzymes. Increased glycolysis may have served as a trigger for increased mitochondrial oxidative metabolism observed in our results, and could lead to oxidative stress as has been indicated by upregulation of canonical pathways involved in ‘mitochondrial dysfunction’ and ‘production of nitric oxide and reactive oxygen species in macrophages’. Interestingly, we also observed upregulation of UCP1 (uncoupling protein 1), a member of the UCP protein family known to uncouple respiratory chain events from ATP production. UPC1 is known to limit reactive oxygen species (ROS) production, which could result in oxidative stress below apoptotic threshold, and enhance cellular survival in the presence of irreversible injury to respiration [32,50]. The presence of radiation-induced mitochondrial dysfunction and consequent oxidative injury to cells are further exemplified by the upregulation of ENDOG, which has been shown to be involved in cell death in the absence of caspases [51].
Previously, we reported that exposure to 2 Gy radiation led to persistent increase in estrogen levels in serum and estrogen receptors in mammary glands at 2- and 12-month after radiation exposure and was associated with activation of PI3K-Akt proliferative pathways [50]. Microarray data showing upregulation of 17β hydroxysteroid dehydrogenase 7 (HSD17B7), an enzyme involved in conversion of weakly estrogenic estrone to biologically active estradiol in mammary glands, is reported to be induced by high serum estradiol [52] and is in agreement with our earlier observations of increased serum estradiol after radiation [50]. While systemic estradiol mediates its effects in mammary gland via ERα, higher expression of HSD17B7 could provide a ‘positive feed-forward’ mechanism for enhanced tissue estradiol level [28] and could explain activation of cellular proliferative signals observed by us [50]. Upregulation of estrogen-related receptor γ (ESRRG), which is induced by estrogen to enhance cell proliferation, provides further evidence of agreement between microarray data and our previous results. Importantly, even 2-month after exposure to 2 Gy radiation a high number of transcripts involved in cellular growth and development including strongly mitogenic MAPK12 remain significantly upregulated and are presented in Table 5.
Along with upregulation of genes involved in cellular growth and development, we also observed that a number of genes with tumor suppressor function (GPRC5A, ELF1, NAB2, Sema4D, ACPP, MAP2, RUNX1) persistently remained downregulated in response to radiation exposure further tilting the balance in favor of transformation (Table 6) [43,53-58]. In contrast, a few genes (TDGF1, GHRH, and BCL9) reported to be involved in promoting cell proliferation are downregulated which highlights the fact that cellular transformation is a multistage process with a sustained tug of war between tumor suppressor and tumor promoter. An important observation of our study was the downregulation of BRCC3 (BRCA1/BRCA2-containing complex, subunit 3), a protein known to play key a role in the repair of DNA damage through its E3 ubiquitin ligase activity on the repair factors [59] and may predispose the mammary gland cells to misrepair and genomic instability. A number of other downregulated genes positively affecting cellular growth and proliferation have been observed in our study and are listed in Table 6.
Molecular pathway networks identified by IPA allowed us to understand how genes in our data sets spatially relate to oncogenic precursor events relevant to breast cancer. The top-scoring pathway has NFkβ and Akt (Figure 4A) as the central molecules and both are known to be involved in breast carcinogenesis [60,61]. Another high scoring upregulated network identified ERBB2, an important membrane bound receptor tyrosine kinase, as the nodal molecule (Figure 8B) and is known to crosstalk with NFkβ and PI3K-Akt to promote breast cancer [62]. One of the important observations in our study was the recognition of inflammation related factors in the IPA network and a number of pathway showed IL-5 (Figure 4B), IL-1β (Figure 6B), TNF (Figure 7A), IL-4, and INFγ (Figure 7B) as the central molecules highlighting an already existing relationship between inflammation and breast cancer [63,64]. Reproductive hormones LH and FSH are the central molecules in an upregulated pathway network (Figure 5A) and are known to regulate estrogen [65], which is strongly associated with risk of developing breast cancer [66]. Indeed, in an earlier study, we have shown that exposure to a radiation dose (2 Gy) used in the current study significantly increased serum estrogen level, urinary oncogenic estrogen metabolite level, mammary gland estrogen receptor α (ERα) level, and cellular proliferation in mice [50]. Estrogen has also been reported to influence TGFβ activity negatively [67], and interestingly our downregulated data sets mapped to a pathway, which has TGFβ as the nodal molecule (Figure 10A). In our earlier study, we focused on exploring one pathway, the PI3K-Akt pathway, in relation to increased estrogen and ERα and showed that radiation not only upregulated PI3K and Akt activity but also induced their downstream effectors leading to increased mammary gland cell proliferation determined by phospho-histone H3 staining [50]. Current microarray based complete gene expression study after radiation exposure not only showed upregulation of additional pathways already discussed but also showed increased expression of genes associated with pathways having TP53 (Figure 6A), AGTR1 (Figure 8A), P38-MAPK and PLCG1 (Figure 9B), PI3K complex and MAPK3 (Figure 9A) as central molecule. The molecular pathways, which IPA identified to be significantly associated with the genes from the microarray data sets have been implicated in human cancer including breast cancer (Tables 5 and 6) and provide evidence towards carcinogenic potential of therapeutic radiation exposure.
Conclusions
Exposure to diagnostic and therapeutic radiation has increased considerably over time [3,68,69] and knowledge of the molecular pathways that remain perturbed long-term after radiation exposure could inform us to devise strategies to tackle the carcinogenic potential of radiation. Taken together the microarray data presented here not only correlate with our earlier observations on long-term effects of radiation exposure on mammary gland pathophysiology, but they also further expand on the persistently perturbed molecular networks with potential for transformation after exposure to a clinically relevant radiation dose.
Competing interests
Authors have no conflict of interest to declare.
Authors’ contributions
KD: planned and executed experiments, analyzed results, and prepared the manuscript; DH: executed experiments and analyzed results; SS: executed experiments and analyzed results; MJ: participated in preparing the manuscript; AF: participated in preparing the manuscript. All authors read and approved the final manuscript.
Supplementary Material
All the upregulated canonical pathways mapped by Ingenuity Pathway Analysis are presented. The colored (blue) pathways have p-value <0.05.
All the downregulated canonical pathways mapped by Ingenuity Pathway Analysis are presented. The colored (blue) pathways have p-value <0.05.
Complete list of upregulated signaling networks generated by Ingenuity Pathway Analysis are presented. Highlighted (bold) genes are from the microarray dataset.
Complete list of downregulated signaling networks generated by Ingenuity Pathway Analysis are presented. Highlighted (bold) genes are from the microarray dataset.
Contributor Information
Kamal Datta, Email: datta_k2003@yahoo.com.
Daniel R Hyduke, Email: danielhyduke@gmail.com.
Shubhankar Suman, Email: ss2286@georgetown.edu.
Bo-Hyun Moon, Email: moonbohyun@gmail.com.
Michael D Johnson, Email: Johnsom@georgetown.edu.
Albert J Fornace, Jr, Email: af294@georgetown.edu.
Acknowledgements
This study supported in part by NASA Grant# NNX07AH70G. DRH was supported, in part, by Grant Number T32 CA009078 from the NCI.
References
- Ronckers CM, Erdmann CA, Land CE. Radiation and breast cancer: a review of current evidence. Breast Cancer Res. 2005;7:21–32. doi: 10.1186/bcr970. [DOI] [PMC free article] [PubMed] [Google Scholar]
- Shuryak I, Sachs RK, Brenner DJ. Cancer risks after radiation exposure in middle age. J Natl Cancer Inst. 2010;102:1628–1636. doi: 10.1093/jnci/djq346. [DOI] [PMC free article] [PubMed] [Google Scholar]
- Brenner DJ, Hricak H. Radiation exposure from medical imaging: time to regulate. JAMA. 2010;304:208–209. doi: 10.1001/jama.2010.973. [DOI] [PubMed] [Google Scholar]
- Boice JDJ, Harvey EB, Blettner M, Stovall M, Flannery JT. Cancer in the contralateral breast after radiotherapy for breast cancer. N Engl J Med. 1992;326:781–785. doi: 10.1056/NEJM199203193261201. [DOI] [PubMed] [Google Scholar]
- Snyder AR, Morgan WF. Gene expression profiling after irradiation: clues to understanding acute and persistent responses. Cancer Metastasis Rev. 2004;23:259–268. doi: 10.1023/B:CANC.0000031765.17886.fa. [DOI] [PubMed] [Google Scholar]
- Prolla TA. DNA microarray analysis of the aging brain. Chem Senses. 2002;27:299–306. doi: 10.1093/chemse/27.3.299. [DOI] [PubMed] [Google Scholar]
- Benjamini Y, Hochberg Y. Controlling the false discovery rate: A practical and powerful approach to multiple testing. Journal of the Royal Statistical Society, Series B (Methodological) 1995;57:289–300. [Google Scholar]
- Gupta RK, Arany Z, Seale P, Mepani RJ, Ye L, Conroe HM, Roby YA, Kulaga H, Reed RR, Spiegelman BM. Transcriptional control of preadipocyte determination by Zfp423. Nature. 2010;464:619–623. doi: 10.1038/nature08816. [DOI] [PMC free article] [PubMed] [Google Scholar]
- Gubelmann C, Gattiker A, Massouras A, Hens K, David F, Decouttere F, Rougemont J, Deplancke B. GETPrime: a gene- or transcript-specific primer database for quantitative real-time PCR. Database (Oxford) 2011;2011:bar040. doi: 10.1093/database/bar040. [DOI] [PMC free article] [PubMed] [Google Scholar]
- Livak KJ, Schmittgen TD. Analysis of relative gene expression data using real-time quantitative PCR and the 2(-Delta Delta C(T)) Method. Methods. 2001;25:402–408. doi: 10.1006/meth.2001.1262. [DOI] [PubMed] [Google Scholar]
- Bernardi C, Ribeiro C, Ede S, Cavalli IJ, Chautard-Freire-Maia EA, Souza RL. Amplification and deletion of the ACHE and BCHE cholinesterase genes in sporadic breast cancer. Cancer Genet Cytogenet. 2010;197:158–165. doi: 10.1016/j.cancergencyto.2009.10.011. [DOI] [PubMed] [Google Scholar]
- Zajac M, Gomez G, Benitez J, Martinez-Delgado B. Molecular signature of response and potential pathways related to resistance to the HSP90 inhibitor, 17AAG, in breast cancer. BMC Med Genomics. 2010;3:44. doi: 10.1186/1755-8794-3-44. [DOI] [PMC free article] [PubMed] [Google Scholar]
- Ishiwata T, Matsuda Y, Naito Z. Nestin in gastrointestinal and other cancers: effects on cells and tumor angiogenesis. World J Gastroenterol. 2011;17:409–418. doi: 10.3748/wjg.v17.i4.409. [DOI] [PMC free article] [PubMed] [Google Scholar]
- Li HJ, Wang LY, Qu HN, Yu LH, Burnstock G, Ni X, Xu M, Ma B. P2Y2 receptor-mediated modulation of estrogen-induced proliferation of breast cancer cells. Mol Cell Endocrinol. 2011;338:28–37. doi: 10.1016/j.mce.2011.02.014. [DOI] [PubMed] [Google Scholar]
- Sala G, Dituri F, Raimondi C, Previdi S, Maffucci T, Mazzoletti M, Rossi C, Iezzi M, Lattanzio R, Piantelli M. et al. Phospholipase Cgamma1 is required for metastasis development and progression. Cancer Res. 2008;68:10187–10196. doi: 10.1158/0008-5472.CAN-08-1181. [DOI] [PubMed] [Google Scholar]
- Wirtenberger M, Tchatchou S, Hemminki K, Schmutzhard J, Sutter C, Schmutzler RK, Meindl A, Wappenschmidt B, Kiechle M, Arnold N. et al. Associations of genetic variants in the estrogen receptor coactivators PPARGC1A, PPARGC1B and EP300 with familial breast cancer. Carcinogenesis. 2006;27:2201–2208. doi: 10.1093/carcin/bgl067. [DOI] [PubMed] [Google Scholar]
- Belguise K, Sonenshein GE. PKCtheta promotes c-Rel-driven mammary tumorigenesis in mice and humans by repressing estrogen receptor alpha synthesis. J Clin Invest. 2007;117:4009–4021. doi: 10.1172/JCI32424. [DOI] [PMC free article] [PubMed] [Google Scholar]
- Bhat HF, Baba RA, Bashir M, Saeed S, Kirmani D, Wani MM, Wani NA, Wani KA, Khanday FA. Alpha-1-syntrophin protein is differentially expressed in human cancers. Biomarkers. 2011;16:31–36. doi: 10.3109/1354750X.2010.522731. [DOI] [PubMed] [Google Scholar]
- Cortesi L, Barchetti A, De Matteis E, Rossi E, Della Casa L, Marcheselli L, Tazzioli G, Lazzaretti MG, Ficarra G, Federico M, Iannone A. Identification of protein clusters predictive of response to chemotherapy in breast cancer patients. J Proteome Res. 2009;8:4916–4933. doi: 10.1021/pr900239h. [DOI] [PubMed] [Google Scholar]
- Garcia-Marcos M, Ghosh P, Farquhar MG. Molecular basis of a novel oncogenic mutation in GNAO1. Oncogene. 2011;30:2691–2696. doi: 10.1038/onc.2010.645. [DOI] [PMC free article] [PubMed] [Google Scholar]
- Hu Z, Fan C, Livasy C, He X, Oh DS, Ewend MG, Carey LA, Subramanian S, West R, Lkpatt F. et al. A compact VEGF signature associated with distant metastases and poor outcomes. BMC Med. 2009;7:9. doi: 10.1186/1741-7015-7-9. [DOI] [PMC free article] [PubMed] [Google Scholar]
- Migneco G, Whitaker-Menezes D, Chiavarina B, Castello-Cros R, Pavlides S, Pestell RG, Fatatis A, Flomenberg N, Tsirigos A, Howell A. et al. Glycolytic cancer associated fibroblasts promote breast cancer tumor growth, without a measurable increase in angiogenesis: evidence for stromal-epithelial metabolic coupling. Cell Cycle. 2010;9:2412–2422. doi: 10.4161/cc.9.12.11989. [DOI] [PubMed] [Google Scholar]
- Dorssers LC, van Agthoven T, Brinkman A, Veldscholte J, Smid M, Dechering KJ. Breast cancer oestrogen independence mediated by BCAR1 or BCAR3 genes is transmitted through mechanisms distinct from the oestrogen receptor signalling pathway or the epidermal growth factor receptor signalling pathway. Breast Cancer Res. 2005;7:R82–92. doi: 10.1186/bcr954. [DOI] [PMC free article] [PubMed] [Google Scholar]
- Reimer CL, Borras AM, Kurdistani SK, Garreau JR, Chung M, Aaronson SA, Lee SW. Altered regulation of cyclin G in human breast cancer and its specific localization at replication foci in response to DNA damage in p53+/+ cells. J Biol Chem. 1999;274:11022–11029. doi: 10.1074/jbc.274.16.11022. [DOI] [PubMed] [Google Scholar]
- Oberley MJ, Inman DR, Farnham PJ. E2F6 negatively regulates BRCA1 in human cancer cells without methylation of histone H3 on lysine 9. J Biol Chem. 2003;278:42466–42476. doi: 10.1074/jbc.M307733200. [DOI] [PubMed] [Google Scholar]
- Ijichi N, Shigekawa T, Ikeda K, Horie-Inoue K, Fujimura T, Tsuda H, Osaki A, Saeki T, Inoue S. Estrogen-related receptor gamma modulates cell proliferation and estrogen signaling in breast cancer. J Steroid Biochem Mol Biol. 2011;123:1–7. doi: 10.1016/j.jsbmb.2010.09.002. [DOI] [PubMed] [Google Scholar]
- Rosenthal DT, Iyer H, Escudero S, Bao L, Wu Z, Ventura AC, Kleer CG, Arruda EM, Garikipati K, Merajver SD. p38gamma promotes breast cancer cell motility and metastasis through regulation of RhoC GTPase, cytoskeletal architecture, and a novel leading edge behavior. Cancer Res. 2011;71:6338–6349. doi: 10.1158/0008-5472.CAN-11-1291. [DOI] [PMC free article] [PubMed] [Google Scholar]
- Shehu A, Albarracin C, Devi YS, Luther K, Halperin J, Le J, Mao J, Duan RW, Frasor J, Gibori G. The stimulation of HSD17B7 expression by estradiol provides a powerful feed-forward mechanism for estradiol biosynthesis in breast cancer cells. Mol Endocrinol. 2011;25:754–766. doi: 10.1210/me.2010-0261. [DOI] [PMC free article] [PubMed] [Google Scholar]
- Cheng S, Douglas-Jones A, Yang X, Mansel RE, Jiang WG. Transforming acidic coiled-coil-containing protein 2 (TACC2) in human breast cancer, expression pattern and clinical/prognostic relevance. Cancer Genomics Proteomics. 2010;7:67–73. [PubMed] [Google Scholar]
- Germain DR, Graham K, Glubrecht DD, Hugh JC, Mackey JR, Godbout R. DEAD box 1: a novel and independent prognostic marker for early recurrence in breast cancer. Breast Cancer Res Treat. 2011;127:53–63. doi: 10.1007/s10549-010-0943-7. [DOI] [PubMed] [Google Scholar]
- Alhopuro P, Karhu A, Winqvist R, Waltering K, Visakorpi T, Aaltonen LA. Somatic mutation analysis of MYH11 in breast and prostate cancer. BMC Cancer. 2008;8:263. doi: 10.1186/1471-2407-8-263. [DOI] [PMC free article] [PubMed] [Google Scholar]
- Ayyasamy V, Owens KM, Desouki MM, Liang P, Bakin A, Thangaraj K, Buchsbaum DJ, LoBuglio AF, Singh KK. Cellular model of Warburg effect identifies tumor promoting function of UCP2 in breast cancer and its suppression by genipin. PLoS One. 2011;6:e24792. doi: 10.1371/journal.pone.0024792. [DOI] [PMC free article] [PubMed] [Google Scholar]
- Sharp JA, Mailer SL, Thomson PC, Lefevre C, Nicholas KR, Sharp JA, Mailer SL, Thomson PC, Lefevre C, Nicholas KR. Identification and transcript analysis of a novel wallaby (Macropus eugenii) basal-like breast cancer cell line. Mol Cancer. 2008;7:1. doi: 10.1186/1476-4598-7-1. [DOI] [PMC free article] [PubMed] [Google Scholar]
- Ma S, Kosorok MR. Detection of gene pathways with predictive power for breast cancer prognosis. BMC Bioinformatics. 2010;11:1. doi: 10.1186/1471-2105-11-1. [DOI] [PMC free article] [PubMed] [Google Scholar]
- Haakensen VD, Bjoro T, Luders T, Riis M, Bukholm IK, Kristensen VN, Troester MA, Homen MM, Ursin G, Borresen-Dale AL, Helland A. Serum estradiol levels associated with specific gene expression patterns in normal breast tissue and in breast carcinomas. BMC Cancer. 2011;11:332. doi: 10.1186/1471-2407-11-332. [DOI] [PMC free article] [PubMed] [Google Scholar]
- Kaklamani VG, Sadim M, Hsi A, Offit K, Oddoux C, Ostrer H, Ahsan H, Pasche B, Mantzoros C. Variants of the adiponectin and adiponectin receptor 1 genes and breast cancer risk. Cancer Res. 2008;68:3178–3184. doi: 10.1158/0008-5472.CAN-08-0533. [DOI] [PMC free article] [PubMed] [Google Scholar]
- Stender JD, Stossi F, Funk CC, Charn TH, Barnett DH, Katzenellenbogen BS. The estrogen-regulated transcription factor PITX1 coordinates gene-specific regulation by estrogen receptor-alpha in breast cancer cells. Mol Endocrinol. 2011;25:1699–1709. doi: 10.1210/me.2011-0102. [DOI] [PMC free article] [PubMed] [Google Scholar]
- Huang H, Groth J, Sossey-Alaoui K, Hawthorn L, Beall S, Geradts J. Aberrant expression of novel and previously described cell membrane markers in human breast cancer cell lines and tumors. Clin Cancer Res. 2005;11:4357–4364. doi: 10.1158/1078-0432.CCR-04-2107. [DOI] [PubMed] [Google Scholar]
- Naderi A, Meyer M, Dowhan DH. Cross-regulation between FOXA1 and ErbB2 signaling in estrogen receptor-negative breast cancer. Neoplasia. 2012;14:283–296. doi: 10.1593/neo.12294. [DOI] [PMC free article] [PubMed] [Google Scholar]
- Nishida K, Tsukamoto T, Uchida K, Takahashi T, Takahashi T, Ueda R. Introduction of the c-kit gene leads to growth suppression of a breast cancer cell line, MCF-7. Anticancer Res. 1996;16:3397–3402. [PubMed] [Google Scholar]
- Bauer JA, Chakravarthy AB, Rosenbluth JM, Mi D, Seeley EH, De Matos Granja-Ingram N, Olivares MG, Kelley MC, Mayer IA, Meszoely IM. et al. Identification of markers of taxane sensitivity using proteomic and genomic analyses of breast tumors from patients receiving neoadjuvant paclitaxel and radiation. Clin Cancer Res. 2010;16:681–690. doi: 10.1158/1078-0432.CCR-09-1091. [DOI] [PMC free article] [PubMed] [Google Scholar]
- Sun Y, Strizzi L, Raafat A, Hirota M, Bianco C, Feigenbaum L, Kenney N, Wechselberger C, Callahan R, Salomon DS. Overexpression of human Cripto-1 in transgenic mice delays mammary gland development and differentiation and induces mammary tumorigenesis. Am J Pathol. 2005;167:585–597. doi: 10.1016/S0002-9440(10)63000-3. [DOI] [PMC free article] [PubMed] [Google Scholar]
- Hu Y, Sun H, Drake J, Kittrell F, Abba MC, Deng L, Gaddis S, Sahin A, Baggerly K, Medina D, Aldaz CM. From mice to humans: identification of commonly deregulated genes in mammary cancer via comparative SAGE studies. Cancer Res. 2004;64:7748–7755. doi: 10.1158/0008-5472.CAN-04-1827. [DOI] [PMC free article] [PubMed] [Google Scholar]
- Kadota M, Yang HH, Gomez B, Sato M, Clifford RJ, Meerzaman D, Dunn BK, Wakefield LM, Lee MP. Delineating genetic alterations for tumor progression in the MCF10A series of breast cancer cell lines. PLoS One. 2010;5:e9201. doi: 10.1371/journal.pone.0009201. [DOI] [PMC free article] [PubMed] [Google Scholar]
- Henriquez-Hernandez LA, Murias-Rosales A, Hernandez Gonzalez A, Cabrera De Leon A, Diaz-Chico BN, Mori De Santiago M, Fernandez Perez L. Gene polymorphisms in TYMS, MTHFR, p53 and MDR1 as risk factors for breast cancer: a case-control study. Oncol Rep. 2009;22:1425–1433. doi: 10.3892/or_00000584. [DOI] [PubMed] [Google Scholar]
- DeBerardinis RJ, Lum JJ, Hatzivassiliou G, Thompson CB. The biology of cancer: metabolic reprogramming fuels cell growth and proliferation. Cell Metab. 2008;7:11–20. doi: 10.1016/j.cmet.2007.10.002. [DOI] [PubMed] [Google Scholar]
- Whitaker-Menezes D, Martinez-Outschoorn UE Flomenberg N, Birbe RC, Witkiewicz AK, Howell A, Pavlides S, Tsirigos A, Ertel A, Pestell RG. et al. Hyperactivation of oxidative mitochondrial metabolism in epithelial cancer cells in situ: Visualizing the therapeutic effects of metformin in tumor tissue. Cell Cycle. 2011;10:4047–4064. doi: 10.4161/cc.10.23.18151. [DOI] [PMC free article] [PubMed] [Google Scholar]
- Allinen M, Beroukhim R, Cai L, Brennan C, Lahti-Domenici J, Huang H, Porter D, Hu M, Chin L, Richardson A. et al. Molecular characterization of the tumor microenvironment in breast cancer. Cancer Cell. 2004;6:17–32. doi: 10.1016/j.ccr.2004.06.010. [DOI] [PubMed] [Google Scholar]
- Huang M, Li Y, Zhang H, Nan F. Breast cancer stromal fibroblasts promote the generation of CD44+CD24- cells through SDF-1/CXCR4 interaction. J Exp Clin Cancer Res. 2010;29:80. doi: 10.1186/1756-9966-29-80. [DOI] [PMC free article] [PubMed] [Google Scholar]
- Suman S, Johnson MD, Fornace AJJ, Datta K. Exposure to Ionizing Radiation Causes Long-Term Increase in Serum Estradiol and Activation of PI3K-Akt Signaling Pathway in Mouse Mammary Gland. Int J Radiat Oncol Biol Phys. 2012;84:500–507. doi: 10.1016/j.ijrobp.2011.12.033. [DOI] [PMC free article] [PubMed] [Google Scholar]
- Higgins GC, Beart PM, Nagley P. Oxidative stress triggers neuronal caspase-independent death: endonuclease G involvement in programmed cell death-type III. Cell Mol Life Sci. 2009;66:2773–2787. doi: 10.1007/s00018-009-0079-2. [DOI] [PMC free article] [PubMed] [Google Scholar]
- Haynes BP, Straume AH, Geisler J, A'Hern R, Helle H, Smith IE, Lonning PE, Dowsett M. Intratumoral estrogen disposition in breast cancer. Clin Cancer Res. 2010;16:1790–1801. doi: 10.1158/1078-0432.CCR-09-2481. [DOI] [PubMed] [Google Scholar]
- Abdulkadir SA, Carbone JM, Naughton CK, Humphrey PA, Catalona WJ, Milbrandt J. Frequent and early loss of the EGR1 corepressor NAB2 in human prostate carcinoma. Hum Pathol. 2001;32:935–939. doi: 10.1053/hupa.2001.27102. [DOI] [PubMed] [Google Scholar]
- Kadara H, Fujimoto J, Men T, Ye X, Lotan D, Lee JS, Lotan R. A Gprc5a tumor suppressor loss of expression signature is conserved, prevalent, and associated with survival in human lung adenocarcinomas. Neoplasia. 2010;12:499–505. doi: 10.1593/neo.10390. [DOI] [PMC free article] [PubMed] [Google Scholar]
- Soong J, Chen Y, Shustef EM, Scott GA. Sema4D, the Ligand for Plexin B1, Suppresses c-Met Activation and Migration and Promotes Melanocyte Survival and Growth. J Invest Dermatol. 2012;132:1230–1238. doi: 10.1038/jid.2011.414. [DOI] [PMC free article] [PubMed] [Google Scholar]
- Veeramani S, Yuan TC, Chen SJ, Lin FF, Petersen JE, Shaheduzzaman S, Srivastava S, MacDonald RG, Lin MF. Cellular prostatic acid phosphatase: a protein tyrosine phosphatase involved in androgen-independent proliferation of prostate cancer. Endocr Relat Cancer. 2005;12:805–822. doi: 10.1677/erc.1.00950. [DOI] [PubMed] [Google Scholar]
- Song Z, He CD, Sun C, Xu Y, Jin X, Zhang Y, Xiao T, Wang Y, Lu P, Jiang Y. et al. Increased expression of MAP2 inhibits melanoma cell proliferation, invasion and tumor growth in vitro and in vivo. Exp Dermatol. 2010;19:958–964. doi: 10.1111/j.1600-0625.2009.01020.x. [DOI] [PubMed] [Google Scholar]
- Silva FP, Morolli B, Storlazzi CT, Anelli L, Wessels H, Bezrookove V, Kluin-Nelemans HC, Giphart-Gassler M. Identification of RUNX1/AML1 as a classical tumor suppressor gene. Oncogene. 2003;22:538–547. doi: 10.1038/sj.onc.1206141. [DOI] [PubMed] [Google Scholar]
- Dong Y, Hakimi MA, Chen X, Kumaraswamy E, Cooch NS, Godwin AK, Shiekhattar R. Regulation of BRCC, a holoenzyme complex containing BRCA1 and BRCA2, by a signalosome-like subunit and its role in DNA repair. Mol Cell. 2003;12:1087–1099. doi: 10.1016/S1097-2765(03)00424-6. [DOI] [PubMed] [Google Scholar]
- Shostak K, Chariot A. NF-kappaB, stem cells and breast cancer: the links get stronger. Breast Cancer Res. 2011;13:214. doi: 10.1186/bcr2886. [DOI] [PMC free article] [PubMed] [Google Scholar]
- Liu W, Bagaitkar J, Watabe K. Roles of AKT signal in breast cancer. Front Biosci. 2007;12:4011–4019. doi: 10.2741/2367. [DOI] [PubMed] [Google Scholar]
- Zhou Y, Eppenberger-Castori S, Eppenberger U, Benz CC. The NFkappaB pathway and endocrine-resistant breast cancer. Endocr Relat Cancer. 2005;1(12):S37–46. doi: 10.1677/erc.1.00977. [DOI] [PubMed] [Google Scholar]
- Coussens LM, Werb Z. Inflammation and cancer. Nature. 2002;420:860–867. doi: 10.1038/nature01322. [DOI] [PMC free article] [PubMed] [Google Scholar]
- Mantovani A, Marchesi F, Porta C, Sica A, Allavena P. Inflammation and cancer: breast cancer as a prototype. Breast. 2007;2(16):S27–33. doi: 10.1016/j.breast.2007.07.013. [DOI] [PubMed] [Google Scholar]
- Powell BL, Piersma D, Kevenaar ME, van Staveren IL, Themmen AP, Iacopetta BJ, Berns EM. Luteinizing hormone signaling and breast cancer: polymorphisms and age of onset. J Clin Endocrinol Metab. 2003;88:1653–1657. doi: 10.1210/jc.2002-021585. [DOI] [PubMed] [Google Scholar]
- Pike MC, Spicer DV, Dahmoush L, Press MF. Estrogens, progestogens, normal breast cell proliferation, and breast cancer risk. Epidemiol Rev. 1993;15:17–35. doi: 10.1093/oxfordjournals.epirev.a036102. [DOI] [PubMed] [Google Scholar]
- Hinshelwood RA, Huschtscha LI, Melki J, Stirzaker C, Abdipranoto A, Vissel B, Ravasi T, Wells CA, Hume DA, Reddel RR, Clark SJ. Concordant epigenetic silencing of transforming growth factor-beta signaling pathway genes occurs early in breast carcinogenesis. Cancer Res. 2007;67:11517–11527. doi: 10.1158/0008-5472.CAN-07-1284. [DOI] [PubMed] [Google Scholar]
- Kleinerman RA. Cancer risks following diagnostic and therapeutic radiation exposure in children. Pediatr Radiol. 2006;36(Suppl 2):121–125. doi: 10.1007/s00247-006-0191-5. [DOI] [PMC free article] [PubMed] [Google Scholar]
- Mettler FAJ, Voelz GL. Major radiation exposure--what to expect and how to respond. N Engl J Med. 2002;346:1554–1561. doi: 10.1056/NEJMra000365. [DOI] [PubMed] [Google Scholar]
Associated Data
This section collects any data citations, data availability statements, or supplementary materials included in this article.
Supplementary Materials
All the upregulated canonical pathways mapped by Ingenuity Pathway Analysis are presented. The colored (blue) pathways have p-value <0.05.
All the downregulated canonical pathways mapped by Ingenuity Pathway Analysis are presented. The colored (blue) pathways have p-value <0.05.
Complete list of upregulated signaling networks generated by Ingenuity Pathway Analysis are presented. Highlighted (bold) genes are from the microarray dataset.
Complete list of downregulated signaling networks generated by Ingenuity Pathway Analysis are presented. Highlighted (bold) genes are from the microarray dataset.


