

Abstract
Venezuelan equine encephalitis virus (VEEV) is a positive-strand RNA Alphavirus endemic in Central and South America, and the causative agent of fatal encephalitis in humans. In an effort to better understand the mechanisms of infection, including differences between people who produce a neutralizing antibody response to the vaccine and those who do not, we performed whole genome transcriptional analysis in human PBMCs exposed in vitro to the live-attenuated vaccine strain of VEEV, TC-83. We compared the molecular responses in cells from three groups of individuals: naïve; previously vaccinated individuals who developed a neutralizing antibody response to the vaccine (responders); and those who did not develop a neutralizing antibody response to the vaccine (nonresponders). Overall, the changes in gene expression were more intense for the naïve group after TC-83 challenge and least potent in the nonresponder group. The main canonical pathways revealed the involvement of interferon and interferon-induced pathways, as well as toll-like receptors TLR- and interleukin (IL)-12-related pathways. HLA class II genotype and suppression of transcript expression for TLR2, TLR4 and TLR8 in the nonresponder group may help explain the lack of vaccine response in this study group. Because TL3 and TLR7 transcripts were elevated in all study groups, these factors may be indicators of the infection and not the immunological state of the individuals. Biomarkers were identified that differentiate between the vaccine responder and the vaccine nonresponder groups. The identified biomarkers were contrasted against transcripts that were unique to the naïve population alone upon induction with TC-83. Biomarker analysis allowed for the discernment between the naïve (innate) responses; the responder (recall) responses; and the nonresponder (alternative) changes to gene transcription that were caused by infection with TC-83. The study also points to the existence of HLA haplotypes that may discriminate between vaccine low- and high-responder phenotypes.
Keywords: biomarkers, gene expression, microarray, neutralizing antibody, vaccination, vaccine responder, Venezuelan equine encephalitis virus
Introduction
VEEV is a new world Alphavirus and a member of the family Togaviridae.1 The members of this family are positive-strand RNA viruses which are characterized in part by arthropod-borne vector transmission.1 In recent years, numerous outbreaks in Mexico and South America as well as extensive tropical urbanization and continuing expansion and colonization of former jungle areas by anthropophilic mosquitoes have rendered VEEV as a re-emerging threat.1, 2 Human infection with VEEV is characterized by an acute onset fever, chills, aches, sore throat, nausea, and diarrhea.3 The development of encephalitis as a consequence of VEEV infection is a chief concern. The case-fatality rate for VEEV is typically between 0.5 and 1.0%; however, in cases where the infection develops encephalitic complications, the case-fatality rate may exceed 20% .4, 5
An experimental live-attenuated VEEV vaccine, TC-83, was generated from the fully virulent parental strain VEEV Trinidad after serial passage through guinea pig heart cells in 1961 and has been extensively tested as an Investigational New Drug (IND).6 As a vaccine, TC-83 has shown adverse side effects which make it less than ideal for use in humans, although it has indeed been used for human vaccination for individuals at high risk of infection (i.e., laboratory workers and as a military vaccine for high-risk groups).7 One complication noted with the TC-83 vaccine is that as many as 26% of all individuals vaccinated do not develop neutralizing antibodies against the virus; neutralizing antibody production is believed to a critical component of the protective efficacy of the vaccine.7, 8 Additionally, human vaccination studies have demonstrated immunological interference from other, related alphaviruses which impede the ability to induce neutralizing antibody production after VEEV vaccination.7, 9 A similar observation of altered ability to produce neutralizing antibody to VEEV has also been made in equines first vaccinated with eastern equine encephalitis virus (EEEV) vaccine or western equine encephalitis virus (WEEV) vaccine.9 Exploratory attempts have been made to understand the host response mechanisms involved in VEEV immunity and infection. Knockout mouse studies for the IFNα/β receptor and for interferon regulatory factors, IRF1 and IRF2 have shown that these animals were susceptible to peripheral infection by virulent or attenuated strains of VEEV.10 Infection of mice with VEEV resulted in elevated levels of the transcripts for interferons, interferon-regulated factors and toll-like receptors (TLRs) in the brain.11 These factors included IFNβ, IRF1, IRF7, MyD88, TLR 1, TLR2, TLR3, TLR7 and TLR9.11 Integrins and other cell adhesion molecules were also induced by VEEV in the brain of mice.12
The purpose of the present study was to investigate and describe the changes in global gene expression after in vitro exposure of human PBMCs to live-attenuated VEEV vaccine strain, TC-83. By defining the changes that occur in blood cells in response to viral presentation, we aimed to elucidate the molecular changes which are involved in the development of immunity and to characterize a molecular signature of TC-83 infection for pre-symptomatic diagnostic detection. In addition, by comparing TC-83-induced reactions in PBMCs from vaccine responders and nonresponders we aimed to identify the mechanisms of protective immunity to VEEV infection. The overarching goal of the project is to produce better diagnostic and detection tools but also to provide molecular rationale for improved vaccine development. The experimental VEEV vaccines that are currently available are not expected to become licensed for human use; therefore, new preventive countermeasures are needed for VEEV, which can be fully developed into licensed products.
Results
The in vitro experimental model employed in these studies was designed to explore the changes in gene expression in human PBMCs exposed to a live-attenuated vaccine strain of VEEV, TC-83. A list of statistically significant transcripts was obtained by cataloging the transcripts identified by ANOVA with a false discovery rate (FDR) of 10%.13Table 1 lists the cut-off p value for each condition at a 10% FDR and the corresponding number of significant transcripts that met the qualification at each time point after TC-83 infection.
Table 1. False Discovery Rate Report.
| FDR Report | ||
|---|---|---|
| Significance Level: 0.1; Total number of p-values: 54675 | ||
| Method: Step Up |
|
|
| Variable Name | Cutoff Value | # of Significant p-values |
| p-value(Time) |
0.044 |
24057 |
| p-value(Treatment Group) |
0.0151422 |
8279 |
| p-value(Time * Treatment Group) |
0.0104856 |
5733 |
| p-value(1 h * naïve TC-83 vs. 1 h * naive saline) |
1.83E-06 |
0 |
| p-value(4 h * naive TC-83 vs. 4 h * naïve saline) |
1.83E-06 |
0 |
| p-value(12 h * naive TC-83 vs. 12 h * naïve saline) |
1.83E-06 |
0 |
| p-value(24 h * naive TC-83 vs. 24 h * naïve saline) |
0.0211431 |
11560 |
| p-value(1 h * responder TC-83 vs. 1 h * naïve saline) |
1.83E-06 |
0 |
| p-value(4 h * responder TC-83 vs. 4 h * naïve saline) |
1.83E-06 |
0 |
| p-value(12 h * responder TC-83 vs. 12 h * naïve saline) |
1.83E-06 |
0 |
| p-value(24 h * responder TC-83 vs. 24 h * naïve saline) |
0.010043 |
5491 |
| p-value(1 h * nonresponder TC-83 vs. 1 h * naïve saline) |
0.00749154 |
4096 |
| p-value(4 h * nonresponder TC-83 vs. 4 h * naïve saline) |
0.00317695 |
1737 |
| p-value(12 h * nonresponder TC-83 vs. 12 h * naïve saline) |
0.0060503 |
3308 |
| p-value(24 h * nonresponder TC-83 vs. 24 h * naïve saline) | 0.0180155 | 9850 |
Overall TC-83 effects on the distinct vaccination groups (naïve, responder and nonresponders)
Exposure of PBMCs to live-attenuated TC-83 in vitro caused changes in the host cell transcriptome that were evident as early as 1 h postinfection (Table 1). The most expansive differences were observed in PBMCs from nonresponders infected in vitro with TC-83 where thousands of transcripts showed an altered pattern of expression. At 1 h postinfection, there were 4,096 transcripts differentially induced, 1,737 transcripts at 4 h, 3,308 transcripts at 12 h, and 9,850 at 24 h postinfection (Table 1). This has unexpected implications for the mechanisms of what has been termed a “non-response” to date; the implication is that while the result is clearly different from that of the responders, it is also vastly different from the innate response of naïve PBMCs stimulated with TC-83. Interestingly, no significant changes in gene expression were observed when naïve PBMCs infected with TC-83 in vitro were compared with the responses of naïve PBMCs mock-infected with saline until 24 h postinfection (Table 1). This trend is also seen in PBMCs from responders treated with TC-83 in vitro compared with mock-infection with saline.
Principal component analysis (PCA) was used to assess the internal structure of the microarray data in a way that best explains the variance in the data. Figure 1 illustrates the PCA of the data comprised of control, responder, and nonresponder volunteers subjected to TC-83 infection over time. The first dimension of the PCA results showed that the greatest amount of variance in the samples was attributed to treatment (Fig. 1). Examination of the second dimension displays differences that can be attributed to have occurred over time.

Figure 1. Principal component analysis (PCA) of naïve, vaccine responder and non responder microarray data. PCA results shown are a reflection of the sources of variation within the data, due primarily to treatment with TC-83 and the temporal nature of the experiment.
The Venn diagram in Figure 2 depicts a different spatial view and illustrates how many transcripts were shared or were unique among the vaccinated and non-vaccinated groups when challenged with TC-83. The significant genes (FDR = 10%) also displayed at least a 2-fold differential transcript expression in comparison to saline-exposed naïve PBMCs. This step in the analysis allowed us to better assess the degree to which change in global gene expression could be seen. Altogether, the Venn diagram indicated that the nonresponder group maintained the higher ratio of genes differentially regulated in response to TC-83 with a greater than 2-fold difference from control. Indeed, the nonresponder group had more unique transcripts after exposure to TC-83 in vitro than either the naïve or responder groups.
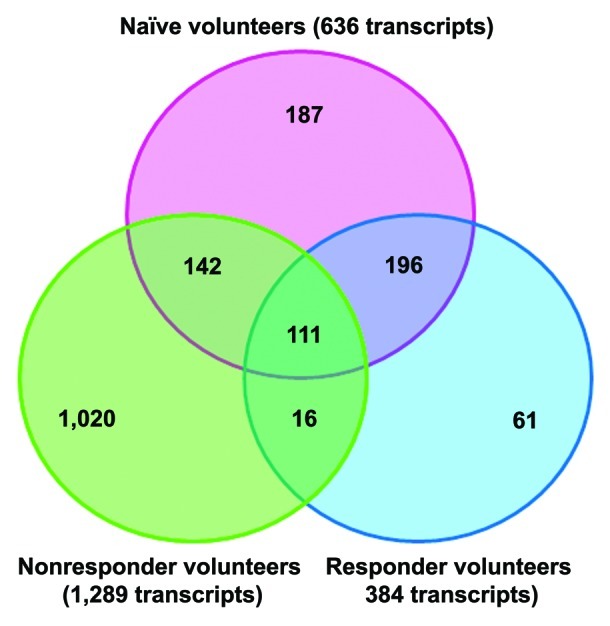
Figure 2. Venn diagram of overlapping and unique transcripts between naïve and previously vaccinated individuals. Common and unique transcripts are shown with a 2-fold change in expression. The genes in this analysis had an FDR-corrected p value ≤ 0.1.
Because the nonresponders were the only group showing a considerable number of significant genes at each time point tested, a Venn diagram was created to analyze unique and common transcripts among the study time points within the nonresponder group (Fig. 3). Figure 3 shows the interaction of transcripts across time, with an overwhelming proportion of genes showing differential expression at 24 h postinfection.
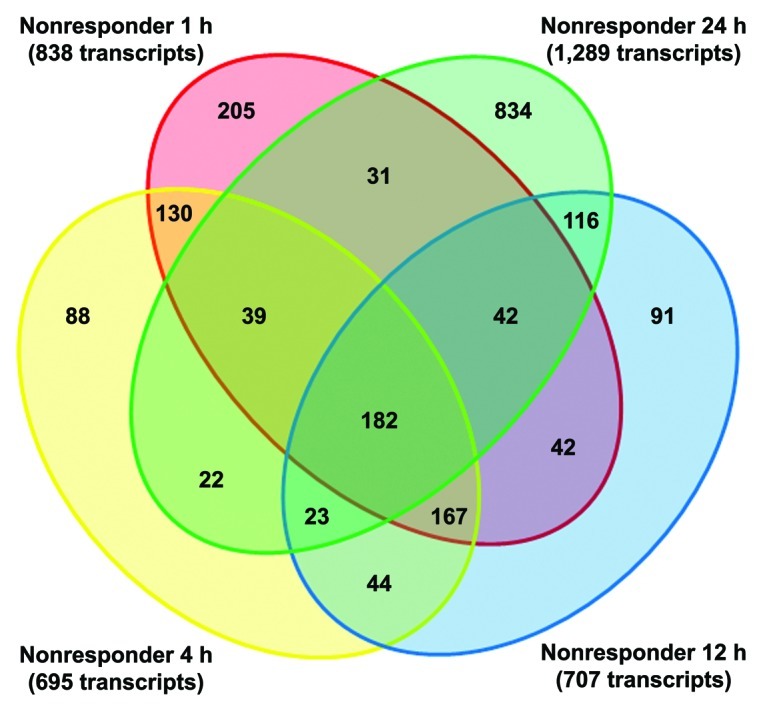
Figure 3. Venn diagram representing the overlapping and unique spread of transcripts through time in the TC-83-challenged nonresponder group. The analysis consisted of significant genes having a FDR-corrected p value ≤ 0.1, with a fold-change set at ±2-fold for all time points in the nonresponder subject category.
HLA haplotypes present in responders and nonresponders to the TC-83 vaccine
HLA typing was performed in all members of the three TC-83-exposed PBMC groups: naïve, TC-83 vaccine responder and TC-83 vaccine nonresponder (Table 2). A common aspect of the human volunteers in the nonresponder group was the presence of either the DQB1 *0301 allele or the DQB1 *0302 allele. Interestingly, in the TC-83 vaccine responder group, the volunteers with the lowest postvaccination titers (5 out of the 10 responders, with titers of 40 or less) also displayed either the DQB1 *0301 or the DBQ1 *0302 allele. On the other hand, the individuals with the highest postvaccination titers displayed the DQB1 *0501 allele (Table 2). At the transcriptional level, analysis of HLA class II genes in the three study groups did not reveal a regulatory effect on HLA-DQ transcripts in PBMCs after TC-83 exposure (data not shown). HLA-DOB was the only HLA class II transcript shown to be upregulated by TC-83 treatment in the vaccine nonresponder group (Fig. 4A). The responder group was consistently not affected by TC-83 treatment when the two existing Affymetrix probe set IDs were evaluated for this transcript. However, in the naïve and vaccine responder groups, transcripts for the MHC class I molecule HLA-G were upregulated at 24 h (Fig. 4B).
Table 2. Post vaccination Titer and HLA-DQB1 phenotype.
| Sample | HLA-DQB1 Phenotype | Day 28 Post-TC-83 Vaccination Titer |
|---|---|---|
| naive 1 |
0202/0301 |
nd |
| naive 2 |
0302/0301 |
nd |
| naive 3 |
0301/0602 |
nd |
| naive 4 |
0501/0303 |
nd |
| naive 5 |
0501/0602 |
nd |
| naive 6 |
0301/0603 |
nd |
| naive 7 |
0602/0603 |
nd |
| naive 8 |
0301/0604 |
nd |
| naive 9 |
0501 |
nd |
| naive 10 |
0202/0301 |
nd |
| responder 1 |
0202/0203 / 0301/0304 |
20 |
| responder 2 |
0502/0609 |
40 |
| responder 3 |
0501/0502 |
640 |
| responder 4 |
0501/0604 |
1280 |
| responder 5 |
0301/0603 |
40 |
| responder 6 |
0302/0202 |
20 |
| responder 7 |
0301 |
20 |
| responder 8 |
0501/0602 |
160 |
| responder 9 |
0501/0303 |
160 |
| responder 10 |
0202/0301 |
40 |
| nonresponder 1 |
0302/0602 |
< 10 |
| nonresponder 2 |
0302/0603 |
< 10 |
| nonresponder 3 | 0301/0319 / 0604/0634 | < 10 |
nd = not done
nd = not done

Figure 4. Differential regulation of MHC class I and MHC class II transcripts in PBMCs from naïve and TC-83-vaccinated individuals. (A) The MHC class II molecule HLA-DOB is shown upregulated in PBMCs of the vaccine non responder group after TC-83 treatment. Changes in gene expression for MHC class II, HLA DO β (205671_s_at) were significant between both naïve PBMCs exposed to TC-83 (FDR-corrected Step up p value = 2.86 × 10⁻⁵) and nonresponder PBMCs exposed to TC-83 (FDR-corrected Step up p value = 0.06) when compared with naïve PBMCs exposed to saline at 24 h postinfection. (B) In contrast, only the MHC class I molecule HLA-G was upregulated in the naïve and TC-83 vaccine responder groups. Changes in gene expression for MHC class I, HLA G (211528_x_at) were significant between both naïve PBMCs exposed to TC-83 (FDR-corrected Step up p value = 3.0 × 10⁻⁴) and responder PBMCs (FDR-corrected Step up p value = 0. 1) exposed to TC-83 when compared with naïve PBMCs exposed to saline.
Cellular pathway analysis and biomarker identification for TC-83 in human PBMCs
The host responses of PBMCs from naïve individuals were compared with those from vaccine responders and from vaccine nonresponders, when those cells were exposed to TC-83 in vitro. The results were evaluated to determine whether they would resemble those of a primary challenge, a secondary immune response, or an inadequate immune response to the virus, respectively. Ingenuity pathway analysis was used to assess the main canonical pathways for each of the three study groups so that a better understanding of the host defense mechanisms against TC-83 could be pursued. The most transcriptionally active time point was at 24 h after TC-83 exposure. Table 3 summarizes a comparison of the expression levels for the genes participating in some of the major canonical pathways identified for TC-83 infection in human PBMCs from both naïve and vaccinated individuals. TC-83 affected transcription of genes with recognized roles as pattern recognition receptors for the identification of pathogen-associated molecular patterns (Table 3). Those genes included OAS transcripts, interferon and other interferon-related transcripts (e.g., IFNB1, IRF7). The level of increased transcriptional regulation for these genes was greater in the naïve category, relative to the responders, and was usually only slightly induced in the nonresponder group. A number of interferon α subtypes were identified, and these genes are known to play a role in IL12 signaling and production in macrophages (e.g., IFNA2, 4, 5, 7, 8 and 10). Pathways for IL15 production and TREM-1 signaling were also noted (Table 3). Irrespectively of pathways, however, toll-like receptor molecules were affected by TC-83 in several host canonical pathways. TLR3 was upregulated in all study groups upon TC-83 challenge; and TLR 4 and TLR8 were consistently downregulated in the nonresponder group (Table 3 and data not shown). Of the many canonical pathways affected by TC-83 infection, the data seemed to indicate the involvement of the inflammation signaling pathways of IL1 and toll-like receptor superfamily as a common, unifying factor among the different study groups. In those pathways, TLR 7 was found slightly induced in all groups as well, which coincided with the induction of MyD88 and downregulation of IRAK3 and IKBKB (Table 3 and data not shown). Ingenuity pathway analysis of the PBMC microarray data also identified potential biomarkers for detection in biofluids that are either common to all groups examined or specific for the naïve, responder or the nonresponder group as shown in Table 4. The biomarkers shown here were selected by restricting to the first 10 genes showing the highest expression levels for the group in question. Of the 10 chosen genes, those showing consistent expression profiles through time, among the different probe set IDs for the same gene, were maintained and those with inconsistencies among probe sets were deleted from the list. The biomarkers selected for the vaccine responder group were the only biomarkers that also showed similar expression profiles in the TC-83-induced naïve group. This could be potentially explained by the fact that different probe sets for a common gene may hybridize to more than one message variant.
Table 3. Canonical pathways involved in TC-83 infection in PBMCs at 24 h postinfection.
| Pathways and Genes |
Affymetrix ID |
Naïve |
Responders |
Nonresponders |
|||
|---|---|---|---|---|---|---|---|
| Fold Change |
corrected p-value |
Fold Change |
corrected p-value |
Fold Change |
corrected p-value |
||
| Role of Pattern Recognition Receptors in Recognition of Bacteria and Viruses | |||||||
| OAS1 |
205552_s_at |
7.18165 |
1.11E-08 |
6.05691 |
3.21E-04 |
1.47301 |
6.38E-01 |
| OAS2 |
206553_at |
5.32721 |
5.84E-10 |
3.90412 |
1.76E-04 |
1.20529 |
7.67E-01 |
| OAS3 |
218400_at |
7.81281 |
2.78E-08 |
5.04432 |
1.92E-03 |
1.81756 |
4.52E-01 |
| IFNB1 |
208173_at |
11.4727 |
1.15E-08 |
4.52685 |
1.16E-03 |
1.89218 |
3.48E-01 |
| IL6 |
205207_at |
3.89609 |
2.21E-02 |
1.75846 |
6.89E-01 |
1.61739 |
7.96E-01 |
| IFIH1 |
219209_at |
5.19081 |
1.65E-08 |
3.87712 |
7.86E-05 |
2.41444 |
1.08E-01 |
| IRF7 |
208436_s_at |
4.37266 |
1.31E-08 |
3.33054 |
1.67E-04 |
1.89873 |
1.38E-01 |
| C5AR1 |
220088_at |
-2.32673 |
2.58E-04 |
-1.27391 |
5.64E-01 |
-3.17431 |
2.55E-02 |
| DDX58 |
218943_s_at |
7.35369 |
4.32E-10 |
4.75587 |
7.84E-05 |
2.89944 |
4.42E-02 |
| CASP1 |
211366_x_at |
1.91882 |
4.64E-05 |
1.58748 |
1.23E-02 |
1.0979 |
8.07E-01 |
| TLR3 |
206271_at |
3.56098 |
2.81E-07 |
2.9058 |
1.21E-04 |
2.5376 |
2.62E-02 |
| TLR4 |
1552798_a_at |
-1.03719 |
8.57E-01 |
1.33597 |
3.83E-01 |
-2.37796 |
9.55E-02 |
| TLR7 |
222952_s_at |
1.54863 |
6.83E-03 |
1.6968 |
7.05E-03 |
1.52812 |
1.70E-01 |
| TLR8 |
220832_at |
1.18455 |
4.39E-01 |
-1.0012 |
9.98E-01 |
-2.55352 |
1.27E-02 |
| EIF2AK2 |
204211_x_at |
3.75043 |
8.39E-10 |
2.94064 |
8.74E-05 |
2.10221 |
1.21E-01 |
| TNF |
207113_s_at |
3.21849 |
1.38E-04 |
2.29775 |
4.23E-02 |
1.37156 |
6.28E-01 |
| IFNA5 |
214569_at |
3.8725 |
1.13E-05 |
1.84686 |
1.06E-01 |
1.33046 |
5.88E-01 |
| NLRC4 |
1552554_a_at |
-1.76921 |
1.85E-03 |
-1.40852 |
2.84E-01 |
-3.60691 |
2.42E-04 |
| CLEC7A |
1555756_a_at |
-1.30726 |
2.52E-01 |
-1.17421 |
7.43E-01 |
-3.91283 |
5.20E-04 |
| SYK |
244023_at |
-1.39986 |
1.19E-02 |
-1.02961 |
9.44E-01 |
-1.72695 |
4.24E-02 |
| C1QA |
218232_at |
-1.09903 |
6.90E-01 |
-1.29948 |
4.42E-01 |
-2.70881 |
6.61E-03 |
| C1QB |
202953_at |
-1.01857 |
9.61E-01 |
1.08117 |
9.00E-01 |
-2.48811 |
3.26E-02 |
| C1Q3 |
225353_s_at |
-1.04007 |
9.32E-01 |
1.22896 |
7.96E-01 |
-4.52356 |
7.73E-02 |
| MYD88 |
209124_at |
1.74327 |
3.45E-06 |
1.76279 |
1.54E-04 |
1.14827 |
6.34E-01 |
|
IL-12 Signaling and Production in Macrophages | |||||||
| IL12A |
207160_at |
1.43184 |
3.48E-04 |
1.17283 |
2.33E-01 |
1.11418 |
5.14E-01 |
| IFNG |
210354_at |
2.09617 |
4.26E-03 |
1.33645 |
6.66E-01 |
1.59239 |
5.68E-01 |
| IFNA8 |
207932_at |
6.57798 |
4.69E-06 |
2.93952 |
2.26E-02 |
1.32594 |
7.11E-01 |
| IFNA4 |
207964_x_at |
5.96872 |
1.85E-06 |
2.92517 |
1.15E-02 |
1.63872 |
4.08E-01 |
| IFNA10 |
208261_x_at |
5.6489 |
7.29E-06 |
1.99648 |
1.58E-01 |
1.55256 |
4.90E-01 |
| IFNA16 |
208448_x_at |
8.59878 |
1.70E-06 |
3.36576 |
1.82E-02 |
2.40895 |
2.00E-01 |
| IFNA1/IFNA13 |
208344_x_at |
7.97474 |
2.29E-07 |
3.81843 |
2.61E-03 |
1.41746 |
6.25E-01 |
| IFNA14 |
208182_x_at |
6.94134 |
2.27E-06 |
3.33919 |
9.13E-03 |
2.03925 |
2.68E-01 |
| FOS |
209189_at |
-2.25941 |
6.20E-03 |
-1.55701 |
3.12E-01 |
-5.51096 |
1.24E-03 |
| IFNA17 |
211405_x_at |
3.70937 |
6.88E-06 |
1.77908 |
1.08E-01 |
1.22509 |
6.92E-01 |
| IFNA7 |
208259_x_at |
5.20854 |
3.88E-06 |
2.27019 |
5.27E-02 |
1.41465 |
5.70E-01 |
| IFNA2 |
211338_at |
12.4612 |
3.86E-07 |
4.97288 |
3.68E-03 |
1.78866 |
4.84E-01 |
| IFNA21 |
211145_x_at |
4.10508 |
1.11E-05 |
2.01801 |
6.92E-02 |
1.23613 |
7.20E-01 |
| STAT1 |
AFFX-HUMISGF3A/M97935_5_at |
2.27412 |
4.95E-04 |
1.69575 |
2.91E-01 |
-1.26396 |
8.36E-01 |
| TNF |
207113_s_at |
3.21849 |
1.38E-04 |
2.29775 |
4.23E-02 |
1.37156 |
6.28E-01 |
| IFNA5 |
214569_at |
3.8725 |
1.13E-05 |
1.84686 |
1.06E-01 |
1.33046 |
5.88E-01 |
| TLR4 |
1552798_a_at |
-1.03719 |
8.57E-01 |
1.33597 |
3.83E-01 |
-2.37796 |
9.55E-02 |
| IKBKB |
209341_s_at |
-1.09247 |
3.13E-01 |
-1.16727 |
2.07E-01 |
-1.25778 |
1.84E-01 |
| IFNGR1 |
202727_s_at |
-1.53795 |
2.30E-04 |
-1.1964 |
4.46E-01 |
-1.96029 |
1.19E-02 |
| CEBPB |
212501_at |
-1.2812 |
6.81E-03 |
-1.10015 |
6.03E-01 |
-2.39874 |
3.35E-05 |
| RXRA |
202449_s_at |
-1.66362 |
4.84E-05 |
-1.24289 |
2.62E-01 |
-2.58075 |
8.49E-06 |
| SPI1 |
205312_at |
-1.13057 |
6.74E-01 |
1.25054 |
5.44E-01 |
-2.2477 |
8.33E-02 |
| PRKCB |
209685_s_at |
-1.25908 |
3.66E-04 |
-1.15774 |
3.10E-01 |
1.15312 |
4.31E-01 |
|
IL-15 Production | |||||||
| IL15 |
217371_s_at |
2.38794 |
5.73E-05 |
2.04286 |
2.18E-02 |
1.24353 |
6.60E-01 |
| IFNB1 |
208173_at |
11.4727 |
1.15E-08 |
4.52685 |
1.16E-03 |
1.89218 |
3.48E-01 |
| JAK2 |
1562031_at |
1.84929 |
1.43E-04 |
1.54047 |
1.03E-01 |
1.4369 |
3.46E-01 |
| IL6 |
205207_at |
3.89609 |
2.21E-02 |
1.75846 |
6.89E-01 |
1.61739 |
7.96E-01 |
| STAT1 |
AFFX-HUMISGF3A/M97935_5_at |
2.27412 |
4.95E-04 |
1.69575 |
2.91E-01 |
-1.26396 |
8.36E-01 |
| IFNA5 |
214569_at |
3.8725 |
1.13E-05 |
1.84686 |
1.06E-01 |
1.33046 |
5.88E-01 |
|
TREM1 Signaling |
|
|
|
|
|
|
|
| TLR3 |
206271_at |
3.56098 |
2.81E-07 |
2.9058 |
1.21E-04 |
2.5376 |
2.62E-02 |
| TLR4 |
1552798_a_at |
-1.03719 |
8.57E-01 |
1.33597 |
3.83E-01 |
-2.37796 |
9.55E-02 |
| TLR7 |
222952_s_at |
1.54863 |
6.83E-03 |
1.6968 |
7.05E-03 |
1.52812 |
1.70E-01 |
| TLR8 |
220832_at |
1.18455 |
4.39E-01 |
-1.0012 |
9.98E-01 |
-2.55352 |
1.27E-02 |
| CCL3 |
205114_s_at |
3.57888 |
1.03E-04 |
2.14753 |
2.43E-01 |
-1.44155 |
7.64E-01 |
| CCL7 |
208075_s_at |
5.49785 |
2.56E-07 |
2.60841 |
3.05E-01 |
-7.08919 |
7.22E-02 |
| CASP1 |
211366_x_at |
1.91882 |
4.64E-05 |
1.58748 |
1.23E-02 |
1.0979 |
8.07E-01 |
| CD86 |
205685_at |
1.12258 |
3.81E-01 |
1.34357 |
2.60E-01 |
-1.55864 |
2.09E-01 |
| JAK2 |
1562031_at |
1.84929 |
1.43E-04 |
1.54047 |
1.03E-01 |
1.4369 |
3.46E-01 |
| TNF |
207113_s_at |
3.21849 |
1.38E-04 |
2.29775 |
4.23E-02 |
1.37156 |
6.28E-01 |
| IL6 |
205207_at |
3.89609 |
2.21E-02 |
1.75846 |
6.89E-01 |
1.61739 |
7.96E-01 |
| IL8 |
211506_s_at |
-1.34059 |
4.29E-01 |
-2.46374 |
1.94E-01 |
-16.2076 |
1.11E-03 |
| TYROBP |
204122_at |
-1.00444 |
9.85E-01 |
1.20233 |
4.84E-01 |
-2.14947 |
1.52E-02 |
| ITGAX | 210184_at | -1.57576 | 3.93E-05 | 1.0436 | 9.21E-01 | -2.2391 | 5.69E-03 |
Table 4. List of common and group-specific biomarkers identified at 24 h postinfection.
| Symbol |
Entrez Gene Name |
Biomarker Affymetrix ID |
Naïve |
Responder |
Nonresponder |
Blood |
PBMCs |
Plasma/Serum |
|
|---|---|---|---|---|---|---|---|---|---|
| Common | Fold Change |
|
|||||||
| CXCL11 |
chemokine (C-X-C motif) ligand 11 |
211122_s_at, 210163_at |
91.652 |
36.567 |
16.62 |
x |
|
|
|
| IFIT2 |
interferon-induced protein with tetratricopeptide repeats 2 |
217502_at, 226757_at |
23.674 |
13.435 |
4.781 |
x |
|
|
|
| NEXN |
nexilin (F actin binding protein) |
226103_at, 1552309_a_at |
14.209 |
7.678 |
4.988 |
x |
|
x |
|
| TNFSF10 |
tumor necrosis factor (ligand) superfamily, member 10 |
202687_s_at |
12.527 |
8.19 |
4.343 |
x |
x |
|
|
| DDX58 |
DEAD (Asp-Glu-Ala-Asp) box polypeptide 58 |
218943_s_at |
7.354 |
4.756 |
2.899 |
x |
|
|
|
| SAMD9L |
sterile α motif domain containing 9-like |
230036_at |
6.24 |
3.869 |
3.427 |
x |
|
x |
|
| XAF1 |
XIAP associated factor 1 |
242234_at |
5.772 |
3.227 |
2.922 |
x |
|
x |
|
| CD38 |
CD38 molecule |
205692_s_at |
4.843 |
3.607 |
2.579 |
x |
|
x |
|
| HSH2D |
hematopoietic SH2 domain containing |
1552623_at |
3.692 |
2.526 |
2.534 |
x |
x |
|
|
|
Naïve |
|
|
|
|
|
|
|
|
|
| IFNA10 |
interferon, α 10 |
208261_x_at |
5.649 |
|
|
x |
x |
x |
|
| ENPP2 |
ectonucleotide pyrophosphatase/phosphodiesterase 2 |
209392_at |
4.581 |
|
|
|
|
|
|
| LAMP3 |
lysosomal-associated membrane protein 3 |
205569_at |
3.94 |
|
|
x |
|
|
|
| IFNA5 |
interferon, α 5 |
214569_at |
3.872 |
|
|
x |
x |
x |
|
| IFNA17 |
interferon, α 17 |
211405_x_at |
3.709 |
|
|
x |
x |
x |
|
| SLAMF7 |
SLAM family member 7 |
219159_s_at |
3.28 |
|
|
x |
|
|
|
| IFNE |
interferon, epsilon |
1553574_at |
3.067 |
|
|
x |
|
|
|
|
Responder |
|
|
|
|
|
|
|
|
|
| CCRL2 |
chemokine (C-C motif) receptor-like 2 |
211434_s_at |
|
1.982 |
|
x |
|
|
|
| TCN2 |
transcobalamin II |
204043_at |
|
1.813 |
|
x |
|
x |
|
| LYN |
v-yes-1 Yamaguchi sarcoma viral related oncogene homolog |
202626_s_at |
|
1.742 |
|
x |
|
|
|
| NOD2 |
nucleotide-binding oligomerization domain containing 2 |
220066_at |
|
1.731 |
|
x |
x |
|
|
| CD68 |
CD68 molecule |
203507_at |
|
1.661 |
|
x |
x |
|
|
| EPDR1 |
ependymin related protein 1 (zebrafish) |
223253_at |
|
1.637 |
|
|
|
|
|
| CCR5 |
chemokine (C-C motif) receptor 5 |
206991_s_at |
|
1.629 |
|
x |
x |
|
|
|
Non Responder |
|
|
|
|
|
|
|
|
|
| TAF15 |
TAF15 RNA polymerase II, TBP-associated factor, 68kDa |
202840_at |
|
|
3.292 |
x |
|
|
|
| PF4 |
platelet factor 4 |
206390_x_at |
|
|
2.776 |
x |
|
x |
|
| ATP8A1 |
ATPase, aminophospholipid transporter (APLT), class I, type 8A, member 1 |
210192_at |
|
|
2.537 |
x |
|
|
|
| ALDH8A1 |
aldehyde dehydrogenase 8 family, member A1 |
220148_at |
|
|
2.094 |
|
|
|
|
| USF1 |
upstream transcription factor 1 |
231768_at |
|
|
1.989 |
x |
|
|
|
| CD160 |
CD160 molecule |
207840_at |
|
|
1.914 |
x |
|
|
|
| RASGRP1 |
RAS guanyl releasing protein 1 (calcium and DAG-regulated) |
205590_at |
|
|
1.907 |
x |
|
|
|
| MYH3 | myosin, heavy chain 3, skeletal muscle, embryonic | 205940_at | 1.896 | x | |||||
Discussion
Venezuelan equine encephalitis virus (VEEV) has been the source of disease for numerous cases of infection in equines and humans, since its discovery in the mid-1930s.14 Recently VEEV has re-emerged as an arboviral threat and a potential biothreat agent. These public health concerns have fostered a renewed interest in understanding VEEV infection, the ensuing human disease, and mechanisms of immune development.15, 16 Several studies have evaluated VEEV infection and disease; although the molecular responses occurring during human infection remain largely unknown.12, 17–21
The present study assessed the molecular components of an effective immune response to VEEV by studying the in vitro responses of naïve human PBMCs to infection with the live-attenuated TC-83 vaccine strain and comparing these responses to those from vaccine responder and nonresponder PBMCs exposed to TC-83. In doing so, we aimed to mimic the host responses to VEEV challenge in a primary (innate), a secondary (memory), or a non-productive immune response, respectively. From this comparison we observed that the naïve and TC-83 vaccine responder groups showed a later, but more intense, host transcriptional response to TC-83 than the vaccine nonresponder group, which demonstrated a diluted or apathetic response in many key signaling pathways. Cumulatively, transcriptional responses were most noticeable at 24 h postinfection. The foremost canonical pathways affected by TC-83 infection were the interferon signaling, toll-like receptor (TLR) pathways, and IL12 responses, although there is considerable overlap in the genes that participate in each of those pathways (Table 3). The heavy representation of an interferon response and of classic innate immune response components was consistent with the expected outcome of a viral infection.11, 22 Of note were the broad involvement of interferon-inducible genes (e.g., OAS and Mx genes) and interferon β 1. Interferon α subtypes also frequently demonstrated increased transcription upon TC-83 infection, most notably in the naïve and responder exposure groups; with a notable lack of involvement of interferon-related transcripts in the nonresponder group (Table 3). Previous work has grouped interferon α subtypes into either acute or delayed interferon α response genes.23 IFNα4 has shown an association with an immediate and rapid interferon α induction during viral infection; whereas IFNα2, 5 and 8 have been associated with delayed expression and with the requirement of IRF7 expression, protein synthesis and phosphorylation.23 These observations correlate with our results of acute virus-induced changes in IFNα response genes in both the naïve and responder groups, and highlight the greatly reduced molecular responses in these same transcripts from the nonresponder group, where viral infection consistently led to lower, statistically insignificant expression levels of IFNα genes. The interferon α genes and other innate immune response factors, such as IRF7, IL6, IFNγ and TNF, were significantly elevated for naïve and responder study groups but the changes in transcript expression were often modest and frequently not statistically significant in the nonresponder group upon TC-83 infection. We also observed that transcripts of the IL12 pathway (e.g., IL12A, JAK2, STAT3, STAT5a, IL-18R1, IRF1, IRF4) were typically elevated in the naive group induced with TC-83 more so than samples from responder or the nonresponder groups. We interpret this result as an indication of vaccine responsiveness being mediated, at least in part, through IL12 signal transduction, particularly for the naïve group. This is in agreement with results obtained in a human study of vaccine response to hepatitis B vaccine.24 The involvement of elevated IL12 cytokine levels correlated positively with postvaccination titer and other cytokines indicative of a TH1-driven response.24 Previous work in mice has suggested that exogenous IL12 treatment may have a detrimental effect on survival during VEEV infection and not a potentiating effect on the innate immune response.25 A possible explanation for these apparent differences may be accounted for by the precise, temporal regulation of the IL12 signaling pathway, as opposed to reactive responses which may occur as a result of the addition of exogenous cytokine. The contribution of IL12 signaling to the classic, innate response in the naïve group leading to interferon production may not be a critical pathway in the responder group, with the observation that a predominantly interferon-mediated response is independent of IL12 signaling effects.
Agonists to toll-like receptors have also been shown to play a role in vaccine responsiveness against a viral infection.26 In the present study, we observed increased transcription of TLR9, previously reported as a potentiator of vaccine responsiveness, to be upregulated at 24 h in the non responder group (data not shown). As TC-83 failed to induce TLR9 transcription in PBMCs from naïve or VEEV immune individuals, TLR9 may not have a critical role in classic vaccine responsiveness to VEEV, but could be involved in the mediation of an alternate response, such as we have observed in the nonresponder group. However, it cannot be ruled out that other TLR molecules could also be serving in the role to facilitate a vaccine response. In the non responder group, the transcripts for TLR2, TLR4 and TLR8 were observed to be downregulated (Table 3 and data not shown). Transcriptional downregulation of TLR2, TLR4 or TLR8 in the non responder group suggests that the effect of these molecules leads to the dampening of the immune response and consequently, the vaccinee responsiveness to VEEV. Although, TLR2 is induced in the brain of VEEV-infected mice, the same effect was not observed after stimulation of naïve or vaccine responder PBMCs with VEEV in vitro.11 On the other hand, TLR3, and to a lesser extent TLR7, were upregulated for all groups (Table 3). This induction is consistent with the activation of the toll-like receptor pathway by VEEV, which is in turn consistent with the observed upregulation of MyD88 in the naïve and vaccine responder groups and the downregulation of IKBKB and IRAK3 (Table 3 and data not shown).11 Inhibition of both IRAK3 and IKBKB play an important role in the positive regulation of the TLR7 signaling cascade, as both of these molecules are negative regulators of downstream NFκB. Interestingly, TLR3 and TLR7 have been shown to be induced by dsRNA and mRNA poly (I:C) or ssRNA, respectively.27 It is noteworthy that TLR3 and TLR7 are induced in all groups, even in vaccine nonresponders. This suggests that TLR3 and TLR7 respond to the infection, indiscriminately of a productive VEEV immune response being developed.
The involvement of cell to cell adhesion molecules and extracellular matrix protein genes in VEEV inflammatory response has been reported to occur in the mouse brain.12 We examined our results to see if this could also be observed in PBMCs from human blood. In our exposure experiments for human PBMCs, the participation of cell adhesion molecules and chemotactic factors was indeed noted. The responses between naïve and vaccine responders were in many ways distinct from those of the vaccine nonresponders. For example, CCL3 and CCL7 were upregulated in naïve and responders but downregulated in nonresponders. IL8, a potent neutrophilic chemoattractant, was significantly downregulated in the non responder group. Expression of the integrin ITGAX was observed to have a greater degree of reduced transcript expression in the vaccine non responder group than in the naïve or responder groups. Induction of the acute phase response transcript IL6 was more evident in naïve group than in the vaccine responder and nonresponder groups, while the genes for the complement subcomponent C1q (i.e., C1QA, C1QB and C1Q3), an indicator of acquired immune responses, were greatly reduced in the non responder group by TC-83, in comparison with either the naïve or responder samples. The significance of the reduced expression of complement subcomponent transcripts (as a marker of acquired immunity) is unclear, given that the nonresponder group also did not show changes in gene expression that would be consistent with an innate response.
During virulent VEEV infection with the Trinidad strain, we have previously observed that transcripts for IL15 were increased in the lungs of non-human primates, when compared with transcript expression in the spleen and brain.19 IL15 is normally secreted by mononuclear phagocytes during a viral infection and participates in the proliferation of natural killer cells during the innate immune response. In PBMCs, we observed that TC-83 induced IL15 in all study groups; but, the IL15 response was only marginal for the non responder group. These results agree with the non responder reaction being effectively dampened in response to TC-83 infection.
The study design also allowed us to identify host gene biomarkers that would differentiate between TC-83 challenge in naïve PBMCs from that of either vaccine responder or vaccine nonresponder PBMCs. The ability to identify and distinguish such results is central to the development of better diagnostic tools, and opens the possibility of accounting for molecular processes of immune development in the design and generation of modern vaccines. With that in mind, we created a list of potential unique and common biomarkers among these three conditions (Table 4). The top common biomarker genes included IFN-regulated transcripts (e.g., CXCL11 and IFIT2) and modulators of the apoptotic response (e.g., XAF1, TNFSF10 and HSH2D).28, 29, 30 One of these factors, HSH2D, is also known for its involvement in B or T cell responses, as it is also noted for the common biomarker CD38.30, 31, 32 For the naïve PBMCs, exposure to TC-83 produced a predominant, classical antiviral response including a number of IFN α subtypes as biomarkers (e.g., IFNA5, IFNA10 and IFNA17). The top biomarkers specific for the vaccine responder group included chemokine receptor transcripts (e.g., CCR5 and CCRL2), reflecting the involvement of the mediators in the recruitment of effector immune cells to the site of inflammation. Additional biomarkers for the responder group included a recognized macrophage lineage marker (CD68), a monocyte product involved in antiviral innate immunity (NOD2) and a factor participating in B cell antigen receptor-mediated signaling pathway (Lyn).33, 34, 35 The top biomarkers identified for the vaccine nonresponder group did not provide a solid molecular rationale for the lack of vaccine responsiveness by this group of vaccinees. A chemokine and its transcription activator (i.e., PF4 and USF1) and a natural killer receptor that recognizes MHC class Ia and Ib molecules (CD160) were among the top biomarkers for the vaccine nonresponder group.36, 37 It is worth noting that the majority of observations of transcriptional changes among the nonresponder group were indicative of downregulation of transcripts. Measureable biomarkers of disease state tend to be those transcripts which show positive transcription in order to measure changes; negative regulation is difficult to reliably demonstrate. The value of studying the molecular changes in the nonresponders is to identify and predict points of intervention or to advance the foundation of knowledge for rational vaccine design. The changes between responders and nonresponders provide insight into the intricacies of the dampened, apathetic immune response observed by the nonresponder group which may be further clarified by addressing these differences at the protein level, rather than at the transcriptional level. The nature of the difference between the two groups was not impacted by previous alphavirus vaccination as the neutralizing antibody titers displayed by these individuals had no correlation with responsiveness to VEEV vaccination (data not shown). The lack of confirmation of expression data at the protein level is a potential limitation of the study that could potentially provide us with a more comprehensive understanding of this alternate, disparate reaction to the vaccine. Future endeavors should address this aspect of VEEV vaccine efficacy.
HLA typing was also used to gain information on the immunological state of the study participants to see if that could help explain vaccine unresponsiveness. Previous work had identified the association of gender and age-related differences with vaccineresponsiveness.7 Although only a small number of individuals participated in this study (naïve: n = 10; responders: n = 10 and nonresponders: n = 3), the HLA data were informative. For example, HLA DQB1 *0301 and *0302 alleles were present in individuals with the lowest titers after VEEV vaccination and those with the highest titers displayed the DQB1 *0501 allele. The HLA DQB1 *0301 allele has been found to play an important role in spontaneous viral clearance of hepatitis C virus (HCV), and the association with clearance was decreased after interferon treatment.38 A possible explanation of the role of the HLA DQB1 *0301 allele in the nonresponders, as well as responders with very low neutralizing antibody titers, is that the individuals cleared the virus administered during the initial vaccination too quickly to produce adequate neutralizing antibody. It would be interesting to further evaluate these haplotypes and their possible relationship with VEEV vaccine responsiveness, given the small sample size of our study. The observation of HLA DQB1 *0301 phenotype coinciding with low neutralizing antibody titer challenges the idea of what constitutes a non-response to vaccination. Thousands of transcripts were differentially expressed at each time point after virus re-stimulation of nonresponder PBMCs (Fig. 3); our results suggest that the lack of production of neutralizing antibody is an alternate response, rather than no response in these individuals. We also investigated the transcriptional changes for MHC genes. The MHC class II transcript, HLA-DOB, was clearly upregulated in nonresponders. This observation is interesting as ectopic expression of HLA-DO in murine dendritic cells has been shown to diminish MHC class II antigen presentation.39 In contrast, the MHC class I transcript, HLA-G, was elevated in naïve and responders. HLA-G has been suggested to participate in the escape of viruses from the immune response generated by the nervous system.40 We previously observed an increase of HLA-G transcripts in the brain of VEEV-exposed nonhuman primates, and we see it in the present study in the naïve or vaccine responders PBMCs but not in the vaccine nonresponder group.19
There are some potential limitations to the study. We recognize that challenging PBMCs with a virulent VEEV strain (e.g., Trinidad) could have provided valuable additional information on the molecular mechanisms of infectivity and lethality of the virus; however, the use of TC-83 was critical to provide a challenge with the original vaccine strain to mimic in vitro the primary challenge responses that would have taken place in vivo. In fact, we observed an overall stronger magnitude of the classic antiviral response (e.g., stronger interferon response) in the naïve challenge with TC-83 than in the challenges of the other two groups. In the recall responses of the vaccine responder group, immune cell trafficking factors were more evident and for the nonresponder group much less robust transcriptional responses were observed overall. Future studies should explore the transcriptional changes that are produced in human cells (in vitro) upon infection with a virulent strain of VEEV, so that differences between immunity and virulence can be better appreciated in the host. Previous studies in non-human primates exposed to fully virulent aerosolized VEEV (Trinidad) demonstrated transcriptional responses in the lungs which corroborated many of the results seen for PBMCs in our study for the naïve and responder groups, including altered transcription of IL15, CASP1, IRF7, CXCL11, OAS1, OAS2 and STAT1 among other transcripts; suggesting that challenge with virulent VEEV strains in different tissues may raise certain common host transcriptional responses.19
Vaccination subjects have the potential to either respond or not to the TC-83 vaccine, as measured by the production of neutralizing antibody. Currently there is no method of determining whether an individual will become a vaccine responder or nonresponder prior to vaccination; for that reason, future studies should include pre-bleed PBMC samples from all volunteers prior to vaccination with TC-83 so that subsequent naïve control PBMCs can be assigned from groups that are known to have either developed an appropriate responder phenotype (as measured by the production on neutralizing antibody) or a nonresponder phenotype (lack of production of neutralizing antibody). This would allow assignment within a naïve population, induced with TC-83 in vitro, with a pre-distinction of the host responses between vaccine responders and nonresponders. Such additional refinement of study conditions would provide further insight into the mechanisms of immune development in the naïve population. The inability to discern the potential response phenotype of the naïve controls is a limitation of the present work. Some of the responder and nonresponder individuals (n = 6 responders and n = 2 nonresponders) received either EEEV or EEEV and WEEV IND vaccaines prior to participation in the present study. Although subjects were all negative for antibodies against EEEV and WEEV prior to study participation, we cannot rule out that the act of vaccination with these vaccines may have altered the immune response in such a manner that the antibody response to VEE vaccination may have been influenced in some way.
Additionally, it must be recognized that although we were unable to recruit 10 individuals into the nonresponder group (actual n = 3), this did not preclude the ability to detect statistically significant differences in gene expression. Microarray experiments using 10 individuals per group should typically yield 95% power to detect differences in gene expression using a two-sample t-test at the 0.001 two-sided significance level, assuming that the coefficient of variation was 0.50. Although we were only able to recruit 3 nonresponders to the study, the results that were obtained and reported were statistically significant; the sample size of individuals that we recruited into the study for the nonresponders does not alter the precision of the study since results were obtained.
The present work has provided initial insight into the molecular mechanisms that are common to the naïve, responder vaccinated groups, and for the nonresponder vaccinated group, as well as transcripts that are unique to each group. It was apparent that induction of interferon-related transcription was overwhelming in response to TC-83 infection in vitro, with the strongest increase in transcription seen in naïve PBMCs and the weakest in vaccine nonresponders. The observation of apathetic IFN and TLR transcriptional responses should be investigated further as potential factors in vaccine unresponsiveness. The HLA DQB1 *0301 allele was present in individuals where the postvaccination titer was the lowest, although further evaluation of the gene expression and HLA phenotype data are necessary. Evaluation of the transcripts and biomarkers that were identified as unique to each group may explicate the mechanisms of TC-83 infection and vaccine efficacy in humans.
Materials and Methods
Data set
The data set used in the present study consists of three groups of subjects; unvaccinated controls, TC-83 vaccine responders, and TC-83 vaccine nonresponders. The control volunteers were demonstrated to be naïve to alphavirus infection (as measured by specific enzyme-linked immunosorbent assay (ELISA) to determine the presence or absence of IgG antibodies against VEEV, EEEV and WEEV, independently); the responders were volunteers who had been previously vaccinated with TC-83 as part of the Special Immunizations Program at the United States Army Medical Research Institute of Infectious Diseases (USAMRIID) and demonstrated to have adequate neutralizing antibody titer [plaque reduction neutralizing test (PRNT)-80 ≥ 1:20] against the virus; and finally, the remaining group, nonresponders, consisted of volunteers who had been previously vaccinated with TC-83 but who failed to develop a threshold neutralizing antibody titer against the virus (PRNT-80 ≤ 1:10). Some of the responder and nonresponder participants had previously received either an EEEV vaccine alone or consecutive vaccinations with EEEV and WEEV prior to participation in the study (n = 6 responders and n = 2 nonresponders) and all were demonstrated to be negative for the presence of either EEEV or WEEV antibodies by ELISA prior to participation in the present study. The procedures for both the alphavirus-specific ELISA and the PRNT-80 assay have been described previously.9 The study design consisted of 10 volunteers per group, and that target was met in both the control and responder groups. The nonresponder group consisted of three volunteers. Certain parameters stipulated for the current study included those expected to reduce the confounding impact on global gene expression, such as those potentially caused by normal hormonal variations caused by estrogen throughout the menstrual cycle of women, for example. To decrease such a potential variation, only male volunteers were selected for the study. In addition, all volunteers were between the ages of 18–45, and each responder/non responder was age-matched to a control donor. Blood for PBMC isolation was drawn an average of 5.5 mo after TC-83 vaccination, but ranged from as few as 2 mo to as long as 10 mo. The human study was approved by the USAMRIID Human Use Committee and conducted in accordance with human use protocol FY06–13.
Isolation of PBMCs
Human PBMCs were isolated by Ficoll gradient from 200 ml of whole blood from age-matched male volunteers, selected as previously described. Blood was diluted with 20 mM phosphate-buffered saline (PBS) without Ca2+ or Mg2+ and layered over Ficoll Histopaque-1077 (Sigma, #10771). The samples were centrifuged at 700 × g for 30 min at 25°C with no centrifuge brake applied. After centrifugation, lymphocytes and other mononuclear cells were carefully pipetted from the plasma/Ficoll interface and transferred to a new tube. Cells were washed once with PBS, resuspended in 10 ml of complete medium (RPMI 1640 medium containing 10 mM HEPES, 1 mM sodium pyruvate, 2 mM L-glutamine, 4500 mg/L glucose, 1500 mg sodium bicarbonate and supplemented with 10% human A/B serum, and 50 IU, 50 μg/ml penicillin/streptomycin, respectively) then counted with an hemocytometer.
In vitro infection with live-attenuated TC-83
Freshly explanted PBMCs in complete RPMI-1640 medium were plated in 6-well plates at a density of 1 × 10⁷ cells per well in a total volume of 3 ml. Cells were incubated overnight at 37°C, supplemented with 5% CO2. The next day, 1 x10⁴ plaque-forming units (pfu) of live-attenuated TC-83 (IND NDBR102, Lot#4–3) was added to appropriate wells and the plates were incubated for an additional 1, 4, 12 or 24 h at 37°C, supplemented with 5% CO2.
RNA isolation and sample preparation for microarray analysis
At the designated time points, medium was collected and centrifuged, and 1 ml of TRIzol reagent (Invitrogen, #15596–026) was added to each well of cells remaining adhered to the culture dish. Cells were dissolved in the TRIzol reagent, replicates at each time point (n = 3) were combined and frozen for subsequent RNA isolation.RNA was isolated from frozen cells dissolved in TRIzol reagent according to manufacturer’s specifications. Quality control (QC) of the RNA samples was performed using Agilent BioAnalyzer 2100 (Agilent Technologies). Total RNA samples passing QC were subjected to target preparation for hybridization to the Affymetrix Human Genome U133 plus 2.0 Genechip arrays according to manufacturer’s specifications (Affymetrix, Inc.).
Microarray data analysis
The data were imported from 120 Affymetrix .CEL files into Partek Genomics Suite v6.0 software (Partek Inc.). Using the robust multi-array average (RMA) algorithm, expression values were log2 transformed to normalize the data.41 To detect differential expression, a linear mixed-model analysis of variance (ANOVA) was employed to partition time, treatment, and subject variability from variances due to biological and experimental noise. PCA was performed on the data to identify the sources of global variation in gene expression among the different samples. RMA, mixed model ANOVA, FDR, PCA, and fold-change calculations were performed. A list of significant genes for each of the three study groups (2-fold, FDR-corrected p ≤ 0.1) was used to generate networks and perform biomarker identification and functional canonical pathway analyses of the human data through the use of Ingenuity Pathway Analysis (IPA) (Ingenuity Systems). Requests for the complete microarray data should be directed to the corresponding author.
Glossary
Abbreviations:
- Peripheral blood mononuclear cells
PBMC
- Venezuelan equine encephalitis virus
VEEV
- false discovery rate
FDR
- principal component analysis
PCA
Disclosure of Potential Conflicts of Interest
No potential conflicts of interest were disclosed.
Acknowledgments
The following human use protocol was associated with the work described in this presentation: FY-06–13. USAMRIID work has been funded through DOD grant under Plan# 05–4-8I-052.
Opinions, interpretations, conclusions, and recommendations are those of the author and are not necessarily endorsed by the US. Army.
The authors thank Dr. Mohan Ranadive, Mr. Vincent Fulton, Ms. Denise Bovenzi, and Mr. Larry Korman for expert help with the execution of this study.
Footnotes
Previously published online: www.landesbioscience.com/journals/vaccines/article/20300
References
- 1.Ryman KD, Klimstra WB. Host responses to alphavirus infection. Immunol Rev. 2008;225:27–45. doi: 10.1111/j.1600-065X.2008.00670.x. [DOI] [PubMed] [Google Scholar]
- 2.Weaver SC, Reisen WK. Present and future arboviral threats. Antiviral Res. 2010;85:328–45. doi: 10.1016/j.antiviral.2009.10.008. [DOI] [PMC free article] [PubMed] [Google Scholar]
- 3.Weaver SC, Ferro C, Barrera R, Boshell J, Navarro JC. Venezuelan equine encephalitis. Annu Rev Entomol. 2004;49:141–74. doi: 10.1146/annurev.ento.49.061802.123422. [DOI] [PubMed] [Google Scholar]
- 4.Weaver SC, Salas R, Rico-Hesse R, Ludwig GV, Oberste MS, Boshell J, et al. VEE Study Group Re-emergence of epidemic Venezuelan equine encephalomyelitis in South America. Lancet. 1996;348:436–40. doi: 10.1016/S0140-6736(96)02275-1. [DOI] [PubMed] [Google Scholar]
- 5.Zacks MA, Paessler S. Encephalitic alphaviruses. Vet Microbiol. 2010;140:281–6. doi: 10.1016/j.vetmic.2009.08.023. [DOI] [PMC free article] [PubMed] [Google Scholar]
- 6.Berge TO, Banks IS, Tigertt WD. Attenuation of Venezuelan equine encephalomyelitis virus by in vitro cultivation in guinea pig heart cells. Am J Epidemiol. 1961;73:209–18. [Google Scholar]
- 7.Pittman PR, Makuch RS, Mangiafico JA, Cannon TL, Gibbs PH, Peters CJ. Long-term duration of detectable neutralizing antibodies after administration of live-attenuated VEE vaccine and following booster vaccination with inactivated VEE vaccine. Vaccine. 1996;14:337–43. doi: 10.1016/0264-410X(95)00168-Z. [DOI] [PubMed] [Google Scholar]
- 8.Pittman PR, Liu C-T, Cannon TL, Mangiafico JA, Gibbs PH. Immune interference after sequential alphavirus vaccine vaccinations. Vaccine. 2009;27:4879–82. doi: 10.1016/j.vaccine.2009.02.090. [DOI] [PubMed] [Google Scholar]
- 9.McClain DJ, Pittman PR, Ramsburg HH, Nelson GO, Rossi CA, Mangiafico JA, et al. Immunologic interference from sequential administration of live attenuated alphavirus vaccines. J Infect Dis. 1998;177:634–41. doi: 10.1086/514240. [DOI] [PubMed] [Google Scholar]
- 10.Grieder FB, Vogel SN. Role of interferon and interferon regulatory factors in early protection against Venezuelan equine encephalitis virus infection. Virology. 1999;257:106–18. doi: 10.1006/viro.1999.9662. [DOI] [PubMed] [Google Scholar]
- 11.Sharma A, Maheshwari RK. Oligonucleotide array analysis of Toll-like receptors and associated signalling genes in Venezuelan equine encephalitis virus-infected mouse brain. J Gen Virol. 2009;90:1836–47. doi: 10.1099/vir.0.010280-0. [DOI] [PubMed] [Google Scholar]
- 12.Sharma A, Bhomia M, Honnold SP, Maheshwari RK. Role of adhesion molecules and inflammation in Venezuelan equine encephalitis virus infected mouse brain. Virol J. 2011;8:197. doi: 10.1186/1743-422X-8-197. [DOI] [PMC free article] [PubMed] [Google Scholar]
- 13.Benjamini Y, Hochberg Y. Controlling the false discovery rate: a practical and powerful approach to multiple testing. J R Stat Soc, B. 1995;57:289–300. [Google Scholar]
- 14.Weaver SC, Barrett AD. Transmission cycles, host range, evolution and emergence of arboviral disease. Nat Rev Microbiol. 2004;2:789–801. doi: 10.1038/nrmicro1006. [DOI] [PMC free article] [PubMed] [Google Scholar]
- 15.Gubler DJ. The global emergence/resurgence of arboviral diseases as public health problems. Arch Med Res. 2002;33:330–42. doi: 10.1016/S0188-4409(02)00378-8. [DOI] [PubMed] [Google Scholar]
- 16.Reichert E, Clase A, Bacetty A, Larsen J. Alphavirus antiviral drug development: scientific gap analysis and prospective research areas. Biosecur Bioterror. 2009;7:413–27. doi: 10.1089/bsp.2009.0032. [DOI] [PubMed] [Google Scholar]
- 17.Schoneboom BA, Lee JS, Grieder FB. Early expression of IFN-alpha/beta and iNOS in the brains of Venezuelan equine encephalitis virus-infected mice. J Interferon Cytokine Res. 2000;20:205–15. doi: 10.1089/107999000312621. [DOI] [PubMed] [Google Scholar]
- 18.Gardner CL, Burke CW, Tesfay MZ, Glass PJ, Klimstra WB, Ryman KD. Eastern and Venezuelan equine encephalitis viruses differ in their ability to infect dendritic cells and macrophages: impact of altered cell tropism on pathogenesis. J Virol. 2008;82:10634–46. doi: 10.1128/JVI.01323-08. [DOI] [PMC free article] [PubMed] [Google Scholar]
- 19.Koterski J, Twenhafel N, Porter A, Reed DS, Martino-Catt S, Sobral B, et al. Gene expression profiling of nonhuman primates exposed to aerosolized Venezuelan equine encephalitis virus. FEMS Immunol Med Microbiol. 2007;51:462–72. doi: 10.1111/j.1574-695X.2007.00319.x. [DOI] [PubMed] [Google Scholar]
- 20.Hammamieh R, Barmada M, Ludwig G, Peel S, Koterski N, Jett M. Blood genomic profiles of exposures to Venezuelan equine encephalitis in Cynomolgus macaques (Macaca fascicularis) Virol J. 2007;4:82. doi: 10.1186/1743-422X-4-82. [DOI] [PMC free article] [PubMed] [Google Scholar]
- 21.Bhomia M, Balakathiresan N, Sharma A, Gupta P, Biswas R, Maheshwari R. Analysis of microRNAs induced by Venezuelan equine encephalitis virus infection in mouse brain. Biochem Biophys Res Commun. 2010;395:11–6. doi: 10.1016/j.bbrc.2010.03.091. [DOI] [PubMed] [Google Scholar]
- 22.Grieder FB, Davis BK, Zhou XD, Chen SJ, Finkelman FD, Gause WC. Kinetics of cytokine expression and regulation of host protection following infection with molecularly cloned Venezuelan equine encephalitis virus. Virology. 1997;233:302–12. doi: 10.1006/viro.1997.8617. [DOI] [PubMed] [Google Scholar]
- 23.Marié I, Durbin JE, Levy DE. Differential viral induction of distinct interferon-alpha genes by positive feedback through interferon regulatory factor-7. EMBO J. 1998;17:6660–9. doi: 10.1093/emboj/17.22.6660. [DOI] [PMC free article] [PubMed] [Google Scholar]
- 24.Velu V, Saravanan S, Nandakumar S, Shankar EM, Vengatesan A, Jadhav SS, et al. Relationship between T-lymphocyte cytokine levels and sero-response to hepatitis B vaccines. World J Gastroenterol. 2008;14:3534–40. doi: 10.3748/wjg.14.3534. [DOI] [PMC free article] [PubMed] [Google Scholar]
- 25.Lukaszewski RA, Brooks TJ. Pegylated alpha interferon is an effective treatment for virulent venezuelan equine encephalitis virus and has profound effects on the host immune response to infection. J Virol. 2000;74:5006–15. doi: 10.1128/JVI.74.11.5006-5015.2000. [DOI] [PMC free article] [PubMed] [Google Scholar]
- 26.Malaspina A, Moir S, DiPoto AC, Ho J, Wang W, Roby G, et al. CpG oligonucleotides enhance proliferative and effector responses of B Cells in HIV-infected individuals. J Immunol. 2008;181:1199–206. doi: 10.4049/jimmunol.181.2.1199. [DOI] [PMC free article] [PubMed] [Google Scholar]
- 27.Tissari J, Sirén J, Meri S, Julkunen I, Matikainen S. IFN-alpha enhances TLR3-mediated antiviral cytokine expression in human endothelial and epithelial cells by up-regulating TLR3 expression. J Immunol. 2005;174:4289–94. doi: 10.4049/jimmunol.174.7.4289. [DOI] [PubMed] [Google Scholar]
- 28.Liston P, Fong WG, Kelly NL, Toji S, Miyazaki T, Conte D, et al. Identification of XAF1 as an antagonist of XIAP anti-Caspase activity. Nat Cell Biol. 2001;3:128–33. doi: 10.1038/35055027. [DOI] [PubMed] [Google Scholar]
- 29.Ekchariyawat P, Thitithanyanont A, Sirisinha S, Utaisincharoen P. Apoptosis induced by avian H5N1 virus in human monocyte-derived macrophages involves TRAIL-inducing caspase-10 activation. Innate Immun. 2011 doi: 10.1177/1753425911410998. In press. [DOI] [PubMed] [Google Scholar]
- 30.King RG, Herrin BR, Justement LB. Differential expression of the adaptor protein HSH2 controls the quantitative and qualitative nature of the humoral response. J Immunol. 2011;187:3565–77. doi: 10.4049/jimmunol.1101534. [DOI] [PMC free article] [PubMed] [Google Scholar]
- 31.Perchonock CE, Fernando MC, Quinn WJ, 3rd, Nguyen CT, Sun J, Shapiro MJ, et al. Negative regulation of interleukin-2 and p38 mitogen-activated protein kinase during T-cell activation by the adaptor ALX. Mol Cell Biol. 2006;26:6005–15. doi: 10.1128/MCB.02067-05. [DOI] [PMC free article] [PubMed] [Google Scholar]
- 32.Herrin BR, Justement LB. Expression of the adaptor protein hematopoietic Src homology 2 is up-regulated in response to stimuli that promote survival and differentiation of B cells. J Immunol. 2006;176:4163–72. doi: 10.4049/jimmunol.176.7.4163. [DOI] [PubMed] [Google Scholar]
- 33.Holness CL, Simmons DL. Molecular cloning of CD68, a human macrophage marker related to lysosomal glycoproteins. Blood. 1993;81:1607–13. [PubMed] [Google Scholar]
- 34.Sabbah A, Chang TH, Harnack R, Frohlich V, Tominaga K, Dube PH, et al. Activation of innate immune antiviral responses by Nod2. Nat Immunol. 2009;10:1073–80. doi: 10.1038/ni.1782. [DOI] [PMC free article] [PubMed] [Google Scholar]
- 35.Yamamoto T, Yamanashi Y, Toyoshima K. Association of Src-family kinase Lyn with B-cell antigen receptor. Immunol Rev. 1993;132:187–206. doi: 10.1111/j.1600-065X.1993.tb00843.x. [DOI] [PubMed] [Google Scholar]
- 36.Okada Y, Matsuura E, Tozuka Z, Nagai R, Watanabe A, Matsumoto K, et al. Upstream stimulatory factors stimulate transcription through E-box motifs in the PF4 gene in megakaryocytes. Blood. 2004;104:2027–34. doi: 10.1182/blood-2003-09-3107. [DOI] [PubMed] [Google Scholar]
- 37.Le Bouteiller P, Tabiasco J, Polgar B, Kozma N, Giustiniani J, Siewiera J, et al. CD160: a unique activating NK cell receptor. Immunol Lett. 2011;138:93–6. doi: 10.1016/j.imlet.2011.02.003. [DOI] [PubMed] [Google Scholar]
- 38.Harcourt G, Hellier S, Bunce M, Satsangi J, Collier J, Chapman R, et al. Effect of HLA class II genotype on T helper lymphocyte responses and viral control in hepatitis C virus infection. J Viral Hepat. 2001;8:174–9. doi: 10.1046/j.1365-2893.2001.00289.x. [DOI] [PubMed] [Google Scholar]
- 39.Fallas JL, Tobin HM, Lou O, Guo D, Sant’Angelo DB, Denzin LK. Ectopic expression of HLA-DO in mouse dendritic cells diminishes MHC class II antigen presentation. J Immunol. 2004;173:1549–60. doi: 10.4049/jimmunol.173.3.1549. [DOI] [PubMed] [Google Scholar]
- 40.Lafon M, Prehaud C, Megret F, Lafage M, Mouillot G, Roa M, et al. Modulation of HLA-G expression in human neural cells after neurotropic viral infections. J Virol. 2005;79:15226–37. doi: 10.1128/JVI.79.24.15226-15237.2005. [DOI] [PMC free article] [PubMed] [Google Scholar]
- 41.Irizarry RA, Hobbs B, Collin F, Beazer-Barclay YD, Antonellis KJ, Scherf U, et al. Exploration, normalization, and summaries of high density oligonucleotide array probe level data. Biostatistics. 2003;4:249–64. doi: 10.1093/biostatistics/4.2.249. [DOI] [PubMed] [Google Scholar]