Abstract
Particle-based vaccine delivery systems are under exploration to enhance antigen-specific immunity against safe but poorly immunogenic polypeptide antigens. Chitosan is a promising biomaterial for antigen encapsulation and delivery due to its ability to form nano- and microparticles in mild aqueous conditions thus preserving the antigenicity of loaded polypeptides. In this study, the influence of chitosan encapsulation on antigen uptake, activation and presentation by antigen presenting cells (APCs) is explored. Fluorescein isothiocyanate-labeled bovine serum albumin (FITC-BSA) and ovalbumin (OVA) were used as model protein antigens and encapsulated in chitosan particles via precipitation-coacervation at loading efficiencies >89%. Formulation conditions were manipulated to create antigen-encapsulated chitosan particles (AgCPs) with discrete nominal sizes (300nm, 1µm, and 3µm). Uptake of AgCPs by dendritic cells and macrophages was found to be dependent on particle size, antigen concentration and exposure time. Flow cytometry analysis revealed that uptake of AgCPs enhanced upregulation of surface activation markers on APCs and increased the release of pro-inflammatory cytokines. Lastly, antigen-specific T cells exhibited higher proliferative responses when stimulated with APCs activated with AgCPs versus soluble antigen. These data suggest that encapsulation of antigens in chitosan particles enhances uptake, activation and presentation by APCs.
Keywords: Chitosan particles, Antigen delivery, Antigen presentation, Adjuvant, Co-stimulation
1. Introduction
Over the last several decades, vaccine development has shifted away from using attenuated or inactivated whole pathogens in favor of recombinant subunit antigens [1–3]. This shift is partly due to safety concerns over potentially harmful pathogens and partly due to an increasing interest in inducing immunity towards non-pathogenic self or self-like antigens such as tumor-associated antigens or overexpressed proteins implicated in disease (e.g. amyloid beta) [4–6]. While subunit antigens are much safer, they are also much less immunogenic than whole pathogens. Subunit antigens are rapidly degraded by proteases and lack the requisite secondary immune stimulus, i.e. co-stimulation and/or danger signals, required for the generation of antigen-specific immunity [7]. As a result, a great deal of effort has been spent developing delivery systems and/or adjuvants capable of enhancing vaccine responses to subunit and polypeptide antigens [7–9].
The encapsulation of polypeptide antigens in nano- and/or microparticles has been explored extensively as a strategy to enhance immunogenicity. The advantage of this strategy is three-fold: First, encapsulation of antigens in particles can prevent antigen degradation and enhance antigen persistence. Second, antigen presenting cells (APCs), such as macrophages and dendritic cells, have been shown to readily phagocytose and process particles ranging in size from 150 nm to 4.5 µm [10, 11]. Third, most particle-based platforms can be engineered to contain additional adjuvants and/or targeting moieties to further influence immunogenicity [1, 2]. In general, antigens in particulate form have been shown to be more immunogenic than their soluble counterparts [12, 13]. A myriad of particle-based antigen delivery approaches including liposomes, immune stimulating complexes (ISCOMs), and polymeric particles are under development and have been reviewed elsewhere [1, 14, 15].
Chitosan-based vaccine delivery systems have received increasing attention due to chitosan’s remarkable versatility and unique characteristics [16–23]. Chitosan is a natural polysaccharide derived primarily from the exoskeletons of crustaceans. Chitosan nano- and microparticles can be manufactured via either precipitation-coacervation [24] or ionotropic gelation [25]. Polypeptides can be encapsulated either during particle formation [26] or adsorbed to particle surfaces after formation [27]. Chitosan’s mucoadhesiveness and ability to loosen epithelial gap junctions justifies its use in mucosal vaccines. Several studies have shown that chitosan nano- and microparticles loaded with antigens can generate mucosal immunity following intranasal vaccination [28, 29]. However, chitosan particles are also expected to elicit robust immune responses via non-mucosal routes. Yet, in the only s.c. vaccination study to date, no significant immunity was generated with a vaccine comprised of ovalbumin (OVA) adsorbed to chitosan nanoparticles [27].
While the above study may have failed to induce immune activation due to a documented change in antigen conformation, it is important to note that vaccine responses are highly complex, involve multiple cell types and require successful completion of many interdependent processes including antigen uptake, cytokine release, immune cell trafficking, antigen presentation, co-stimulation, etc. To simplify the contributions of chitosan-based particles, in this study, we focused solely on APC function. In particular, we evaluated the ability of antigenen-capsulated chitosan particles (AgCPs) to enhance antigen uptake, APC activation and antigen presentation. The effect of particle size on antigen uptake by both bone marrow-derived dendritic cells and RAW 264.7 macrophages was quantified via spectrophotometry and flow cytometry. The ability of AgCPs to induce APC activation was determined by measuring upregulation of surface activation markers as well as cytokine release. Finally, APCs exposed to AgCPs or soluble antigens were compared for their ability to present antigen and induce proliferation of antigen-specific T cells.
2. Materials and methods
2.1. Reagents and antibodies
Chitosan (molecular weight: 95 ± 20 kDa), sodium sulfate, polysorbate 80 (Tween 80), acetic acid, fluorescein isothiocyanate-labeled bovine serum albumin (FITC-BSA), and OVA were purchased from Sigma (St. Louis, MO). Cell culture media components, including L-glutamine, HEPES buffer, trypsin-EDTA, FBS, antibiotics, DMEM, and RPMI-1640, were purchased from Thermo Scientific (Rockford, IL). Recombinant murine granulocyte-macrophage colony-stimulating factor (rmGM-CSF) was purchased from Peprotech (Rocky Hill, NJ). OVA257–264 peptide was purchased from AnaSpec, Inc., Fremont, CA. All antibodies used for flow cytometry along with cytometric bead array kits were purchased from BD Biosciences (San Jose, CA).
2.2. Laboratory Animals
Female C57BL/6J, OT-1 and OT-II mice were purchased from The Jackson Laboratory (Bar Harbor, ME). Mice were housed in microisolator cages and used at 8 to 12 weeks of age. All experimental procedures were approved by the Institutional Animal Care and Use Committee at the University of Arkansas. Animal care was in compliance with The Guide for Care and Use of Laboratory Animals (National Research Council).
2.3. Cell culture
RAW 264.7 mouse macrophage cells obtained from American Type Culture Collection (Manassas, VA) were cultured in complete media consisting of DMEM supplemented with 20% FBS and 1% penicillin/streptomycin. Bone marrow-derived dendritic cells (BMDCs) were cultured from bone marrow cells using an established protocol [30].
2.4. Preparation of AgCPs
AgCPs were prepared via precipitation-coacervation as described previously with slight modifications [24, 26, 27]. Briefly, chitosan was dissolved in 2% acetic acid and passed through a 0.2µm filter. AgCPs were formed by adding a 10% w/v sodium sulfate solution containing either FITC-BSA or OVA as model protein antigens, henceforth referred to as BsaCPs or OvaCPs, respectively. Chitosan particles containing no antigen (CPs) were formed in the same manner but without BSA or OVA. Tween 80 was added as a nonionic stabilizer and particles were stirred for 2 hrs with intermittent sonication (S4000, Misonix, Farmingdale, NY). Chitosan particles were separated through centrifugation at 25,000g for 10 min and freeze dried before further use. Particles of various sizes were obtained by varying chitosan concentration, the rate of sodium sulfate addition, sonication power, and chitosan:antigen ratio as seen in Table 1. These parameters and the levels of these parameters were selected based on results from ongoing AgCP optimization studies (data not shown).
Table 1.
Formulation parameters and measurements for AgCPs and CPs
| “300nm” AgCPs |
“1µm” AgCPs |
“3µm” AgCPs |
“300nm” CPs |
|
|---|---|---|---|---|
| Chitosan concentration (mg/ml) | 1 | 5 | 8 | 1 |
| Sodium sulfate addition rate (ml/min) | 8 | 5 | 0.2 | 8 |
| Sonication Power (Watts) | 40 | 10 | 0 | 40 |
| Chitosan:FITC-BSA ratio | 10:1 | 10:1 | 10:1 | - |
| Mean diameter† (nm) | 332 ± 19 | 1034 ± 74 | 2918 ± 333 | 289 ± 9 |
| Polydispersity Index† | 0.09 ± 0.03 | 0.16 ± 0.09 | 0.33 ± 0.05 | 0.10 ± 0.06 |
| Surface charge† (mV) | 16.8 ± 0.8 | 17.8 ± 0.5 | 18.0 ± 0.7 | 36.8 ± 1.4 |
| Protein loading efficiency† (%) | 89.2 ± 0.1 | 91.0 ± 0.1 | 96.2 ± 0.2 | - |
Measured data are presented as mean ± standard deviation of three independent experiments
2.5. Characterization of AgCPs
Particle size and surface charge were measured via dynamic light scattering (DLS) (Nano ZS90, Malvern Instruments, Malvern, UK). Morphological characteristics were documented using scanning electron microscopy (SEM) (Nanolab 200, FEI, Hillsboro, OR). Briefly, AgCPs were dispersed in DI water and vacuum dried onto a glass slide. The slides were sputter coated with gold using an Emitech SC7620 (Quorum Technologies, Ashford, Kent, UK) prior to imaging. SEM images were acquired at a beam voltage of 10–15kV. The encapsulation efficiencies of FITC-BSA in AgCPs were quantified spectrophotometrically (Synergy2, Biotek, Winooski. VT) by measuring the supernatant after centrifugation. Antigen encapsulation efficiency (EE) was calculated as:
2.6. Uptake of AgCPs by APCs
RAW 264.7 macrophages or BMDCs were collected and seeded at a density of 50,000 cells/well in 24 well plates. To determine the effect of particle size on uptake, cells were co-incubated with of 300nm, 1µm, or 3µm BsaCPs. To determine the effect of antigen concentration on uptake, cells were co-incubated with BsaCPs at an effective antigen concentration of 1, 5, 10, 20, or 30 µg/ml. To determine the effect of incubation time on uptake, cells were co-incubated with 1µm BsaCPs at an effective antigen concentration of 30 µg/ml for 12, 24, or 48 hrs. After each co-incubation, cells were rinsed three times with PBS and lysed with 1% triton solution. The amount of FITC-BSA released was quantified via fluorescence spectroscopy. To assess the percentage of cells taking up BsaCPs, cells were rinsed three times with PBS and briefly trypsinized to form a single cell suspension prior to analyzing on a FACSCantoII (BD biosciences, San Jose, CA).
2.7. APC activation
Activation markers on macrophages and BMDCs co-cultured with AgCPs were analyzed via flow cytometry. Briefly, RAW 264.7 macrophages and BMDCs were seeded onto 6 well plates at a density of 1 × 10⁶ cells/well and cultured in their respective growth media for 24 hrs. Media containing BsaCPs was then added at a final antigen concentration of 30 µg/ml. Unloaded 300nm CPs that contained no antigen were used at the same dry weight as 300nm AgCPs. Media alone was used as a negative control. After 24 hrs, cells were rinsed three times with PBS and briefly trypsinized to form a single cell suspension. FcII and FcIII receptors were blocked via incubation with 1 µg purified anti-mouse CD16/CD32 (clone: 2.4G2) per 1×10⁶ cells for 15 min on ice. Cells were stained for 30 min on ice with fluorescence-labeled antibodies (1 µg/1×106 cells) to the following markers: MHC I (clone: AF6-88.5), MHC II (clone: 2G9), CD11b (clone: M1/70), CD11c (clone: HL3), CD80 (clone: 16-10A1), CD86 (clone: GL1), CD40 (clone: HM40-3) and CD53 (clone: 3E2). Cells were then washed twice with cold PBS and analyzed on a six-color FACS CantoII. Data analysis was performed using BD FACSDiva software (BD biosciences, San Jose, CA).
Cytokines released from macrophages and BMDCs were quantified via cytometric bead array (CBA) analysis. In brief, RAW 264.7 macrophages and BMDCs were seeded at 5 × 10⁵ cells/well in 96 well plates. Cells were co-incubated with FITC-BSA alone or BsaCPs with approximate mean diameters of 300 nm, 1 µm or 3 µm. Once again, unloaded CPs and media alone were used as controls. After 72 hrs, culture supernatants were harvested to quantify concentrations of inflammatory cytokines including, IL-1β, IL-6, TNF-α, MCP-1α, and MIP-1 with a customized CBA flex set (BD Biosciences, San Jose, CA). The multiplex beads were read on a FACSCantoII and analyzed using FACP Array software (Soft Flow, Burnsville, MN).
2.8. Antigen presentation
The antigen presenting ability of BMDCs co-incubated with AgCPs was evaluated by quantifying proliferation of Ag-specific T-cells. Briefly, BMDCs were seeded onto 6 well plates at a density of 1 × 10⁶ cells/well and cultured with OvaCPs with approximate mean diameters of 300nm, 1µm, or 3µm at final antigen concentration of 10 µg/ml. BMDCS were pulsed with MHC I-restricted peptide OVA257–264 (SIINFEKL) or whole OVA protein, and unloaded CPs were used as positive and negative controls, respectively. After 24 hrs, BMDCs were collected and co-cultured with CD8+ or CD4+ T-cells isolated via negative selection using magnetic beads (Invitrogen, Grand Island, NY) from the spleens of OT-I and OT-II mice, respectively. After 72 hrs of co-culture, T-cell proliferation was assessed by the CellTiter-Glo (Promega, Madison, WI) cell proliferation assay.
2.9. Statistical Analysis
All particle characterization measurements, i.e. mean diameter, polydispersity index, encapsulation efficiency and surface charge, are presented as mean ± standard deviation for 3 independent chitosan particle preparations. Antigen uptake, APC activation and cytokine release experiments were carried out in triplicate. Antigen presentation experiments, which evaluated the proliferation of antigen-specific T cells, were performed in duplicate. Student’s t-test was used to compare data from two groups of interest as indicated. For example, cytokine release and T cell proliferation data in response to the soluble antigen treatment group and an AgCP treatment group were compared. Analysis of variance was used to identify treatment-related differences among the three different AgCP sizes. All statistical analyses were performed using JMP software (SAS, Cary, NC). Significance was accepted at the p ≤ 0.05 level.
3. Results
3.1. Characterization of AgCPs
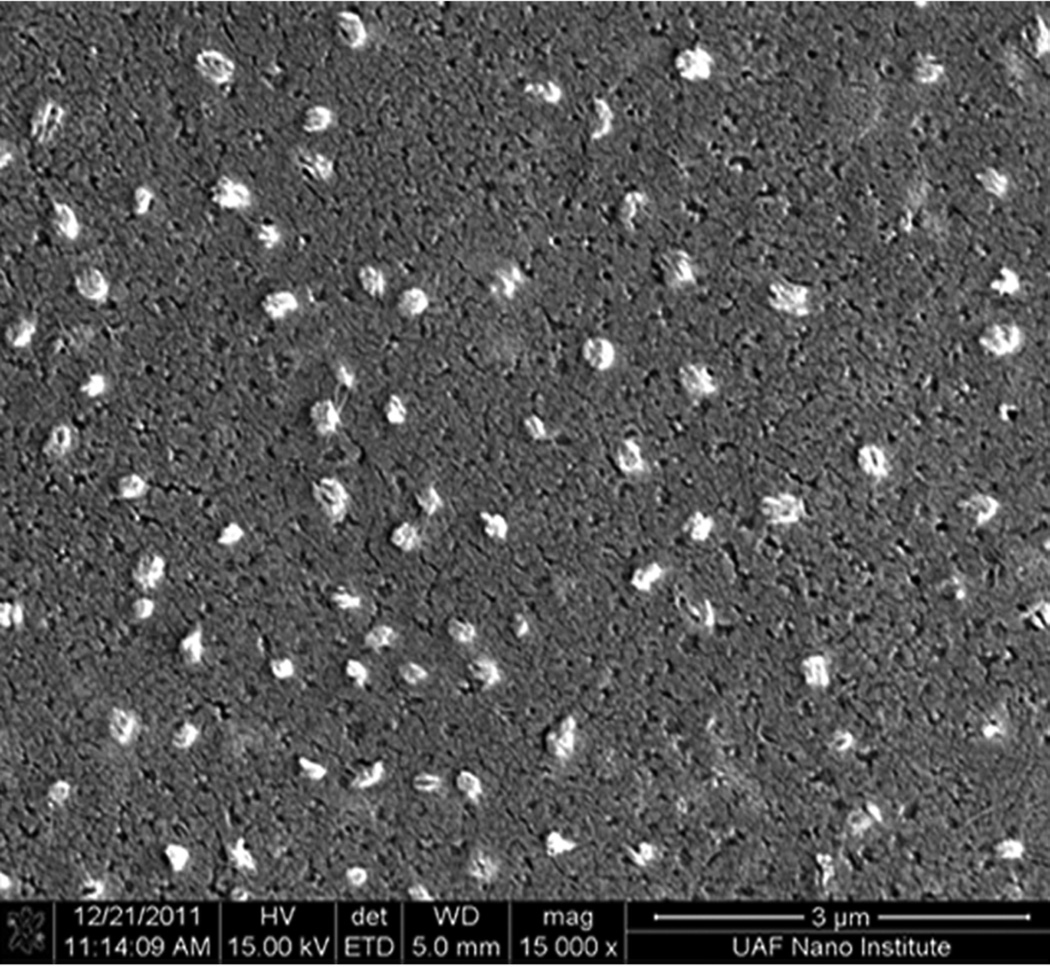
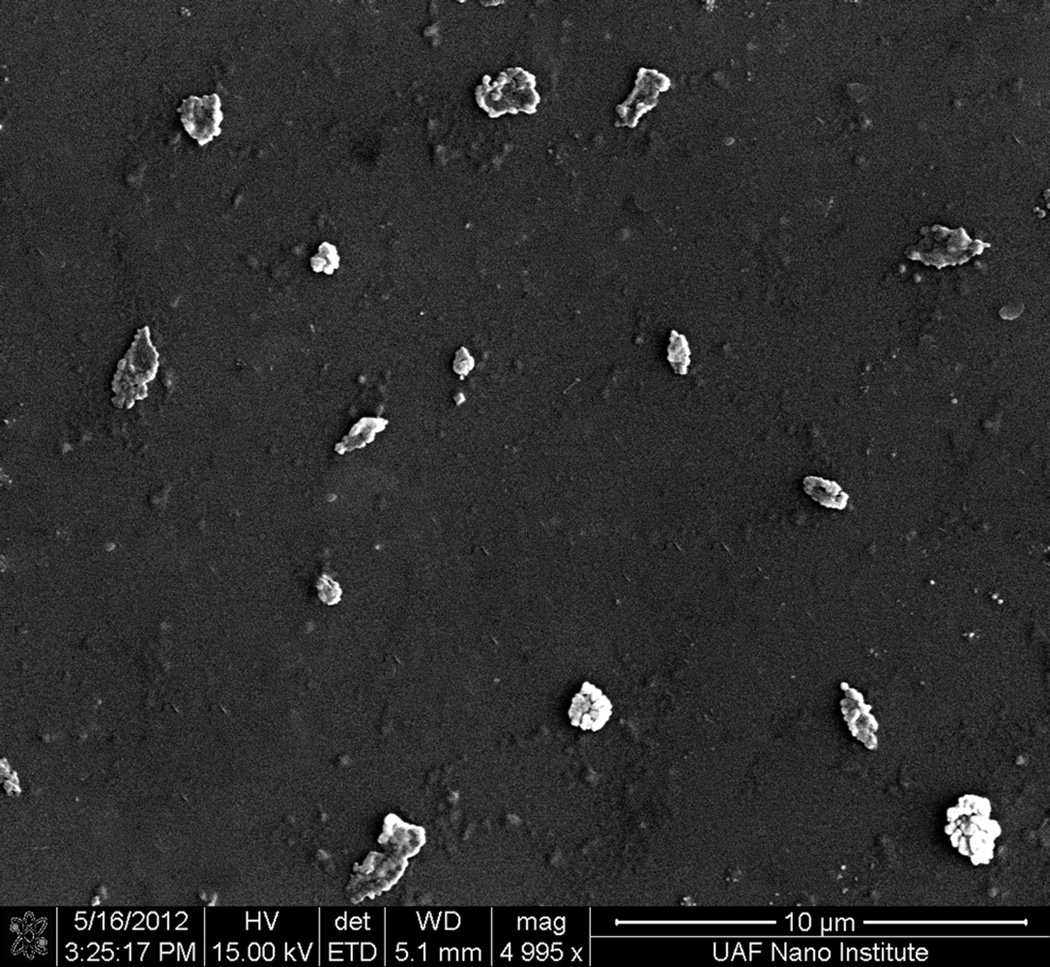
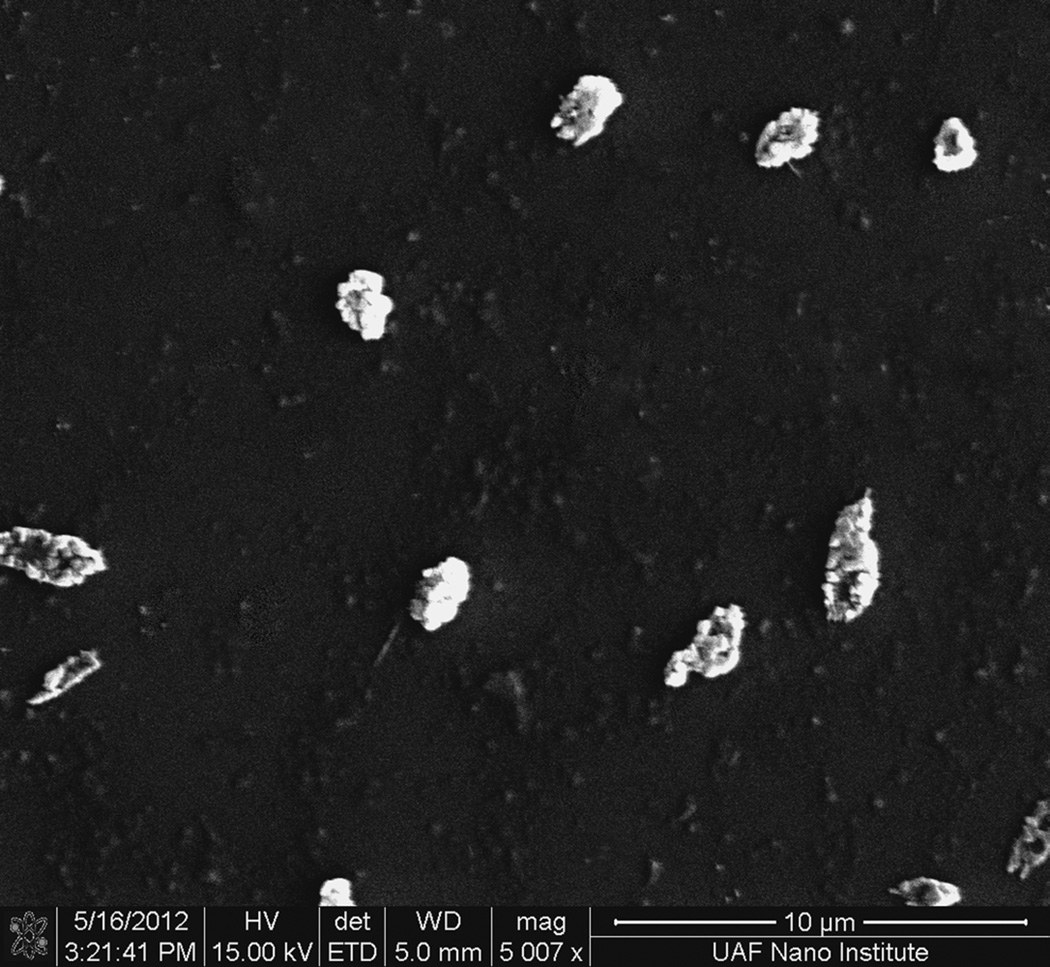
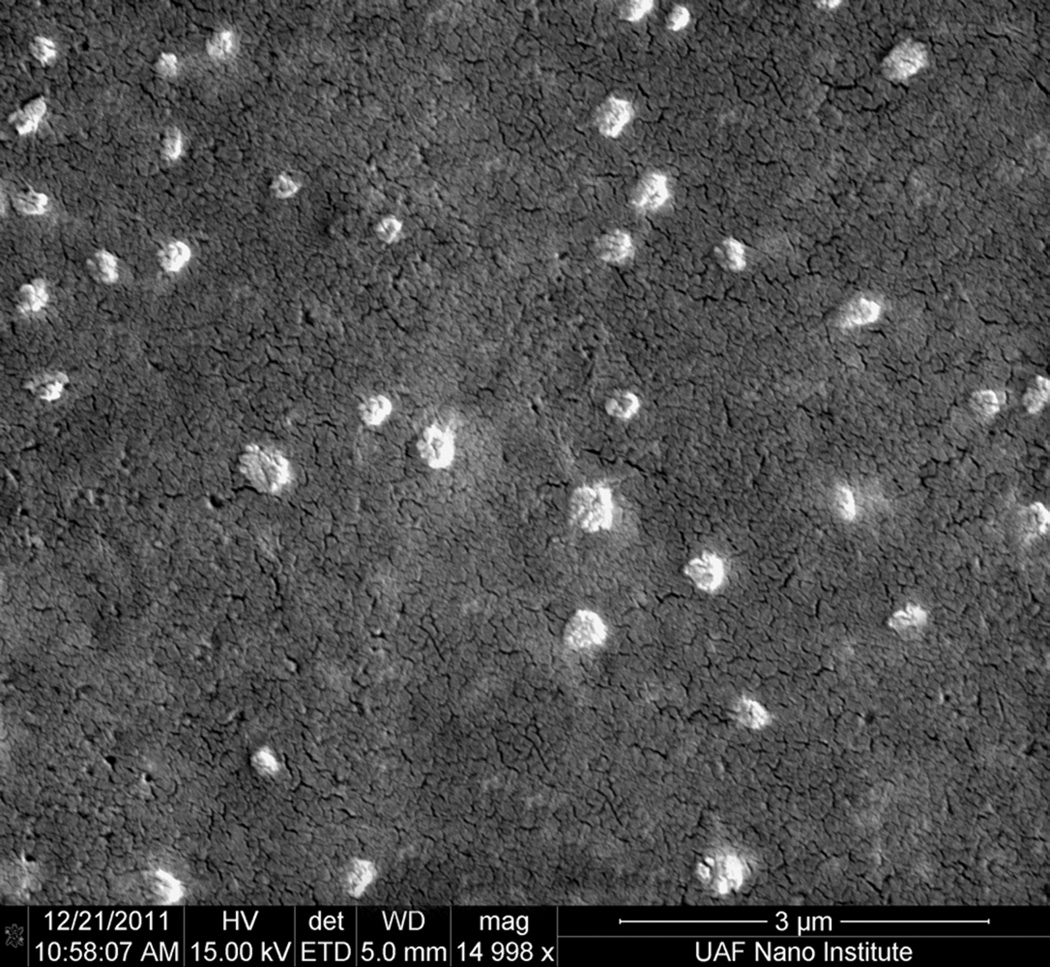
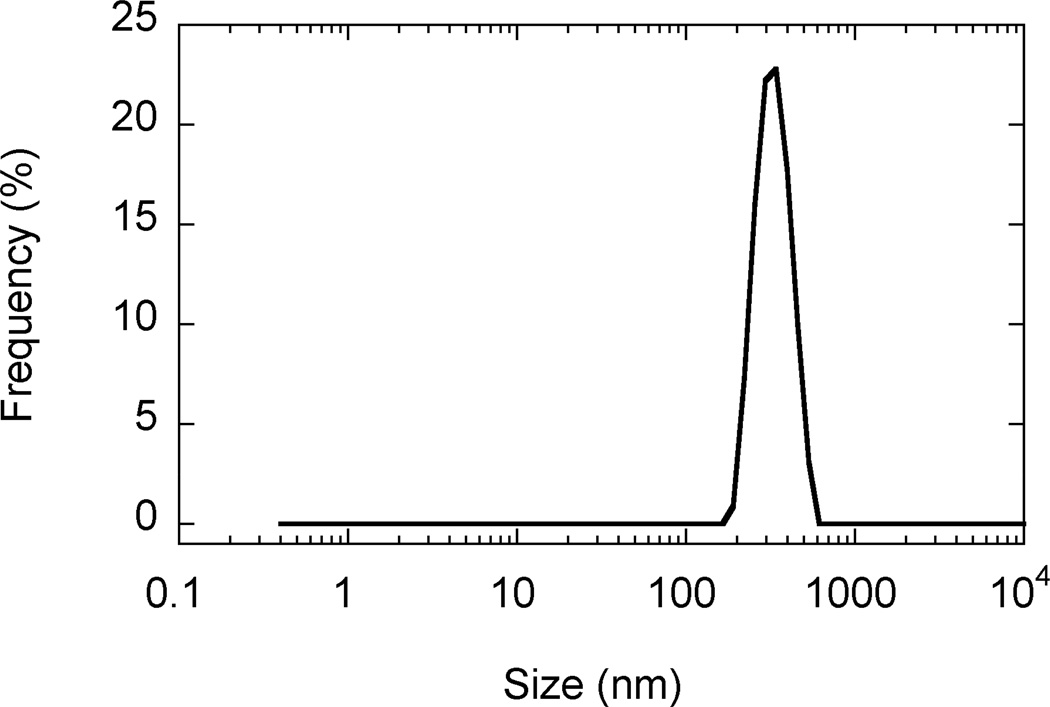
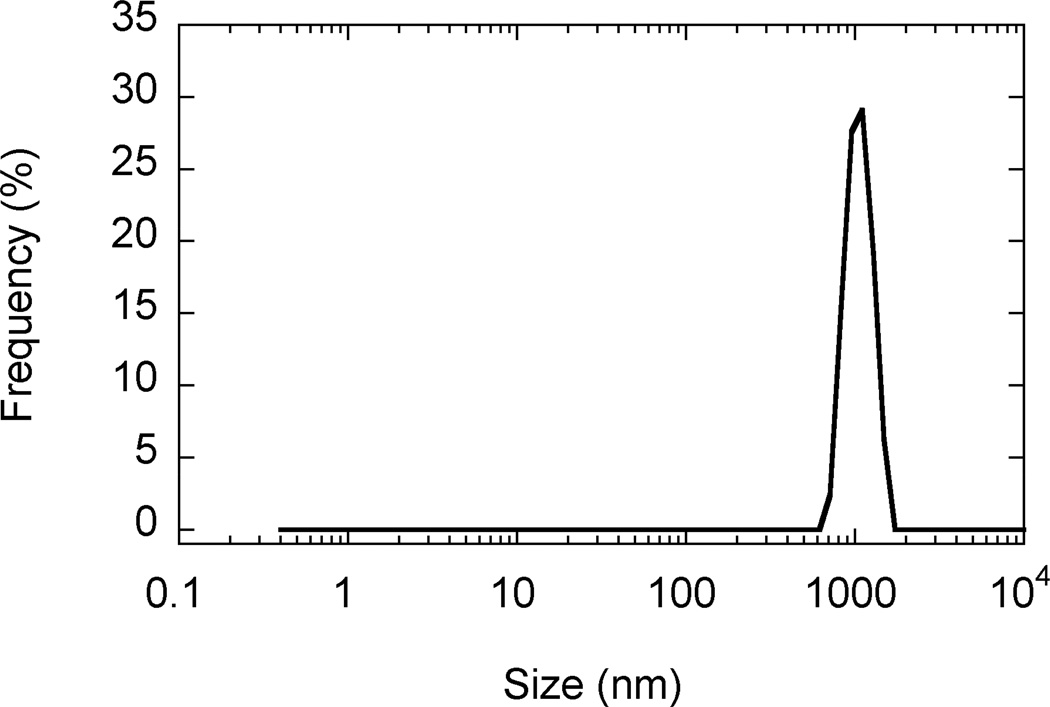
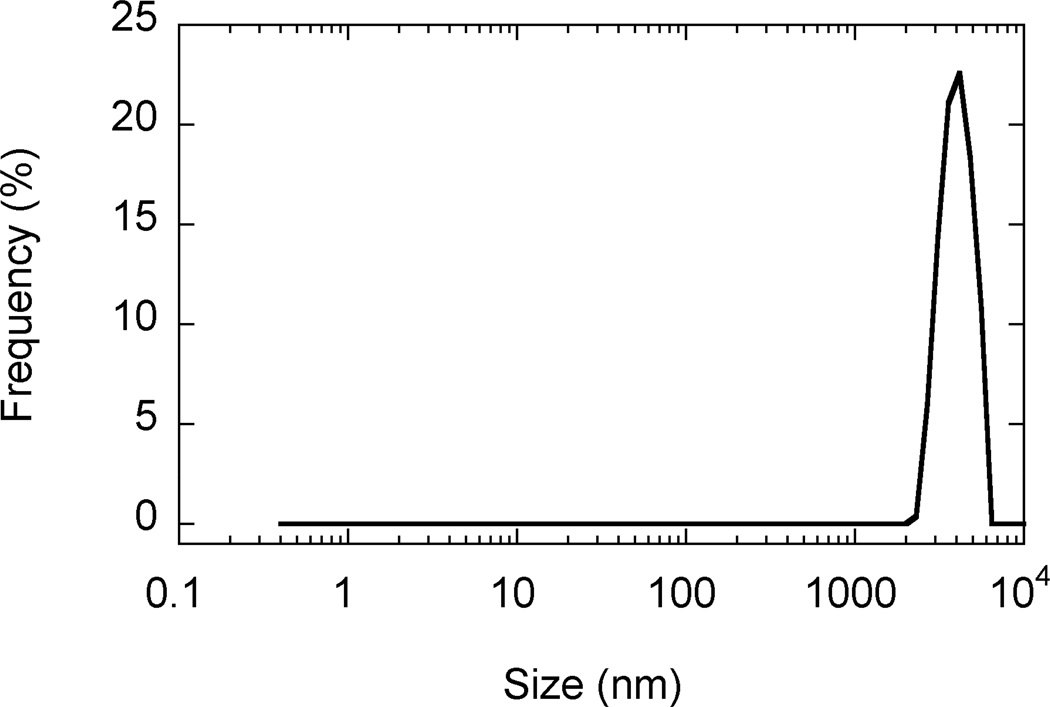
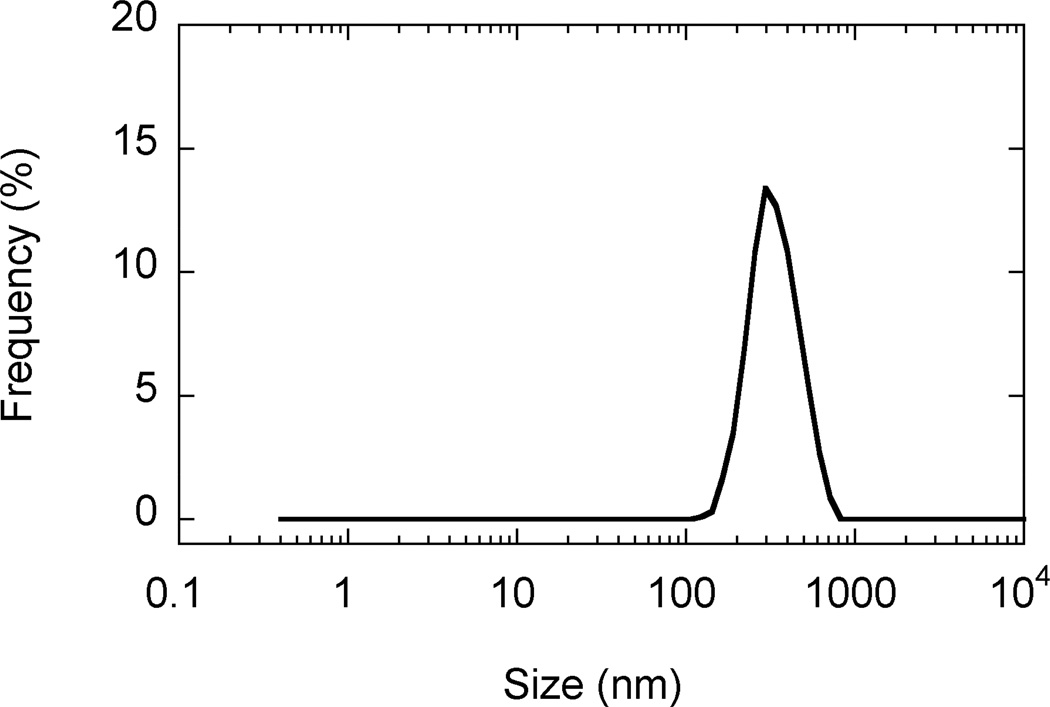
SEM images revealed that AgCPs were spherical to elliptical in shape with porous non-uniform structures (Figure 1a). Formulation factors including chitosan concentration, sodium sulfate addition rate, and sonication power were varied to generate AgCPs with nominal sizes of 300nm, 1µm, or 3µm. The measured mean diameters of these particles as determined by DLS were 332 ± 19 nm, 1034 ± 74 nm, and 2918 ± 333 nm (Table 1). All preparations displayed a unimodal size distribution (Figure 1b) with modest polydispersity (Table 1). Antigen encapsulation efficiencies were very reproducible and increased slightly with particle size from 89.2% to 96.2%. To determine the effect of antigen on particle size and charge, unloaded CPs were prepared using the same conditions as the “300nm” AgCPs except without antigen. The mean diameter of CPs was slightly smaller than similarly prepared AgCPs − 289 ± 9nm vs. 332 ± 19nm (Table 1). Also, the surface charge of CPs, +36.8 mV, was higher than the surface charge of similarly sized AgCPs, +16.8 mV.
Fig. 1.
Morphology and size distribution of AgCPs. Representative SEM images and DLS data show that (a,e) 300nm AgCPs, (b,f) 1µm AgCPs, (c,g) 3µm AgCPs, and (d,h) 300nm CPs are unimodally distributed and spherical to elliptical with porous non-uniform structures.
3.2. Uptake of AgCPs by APCs
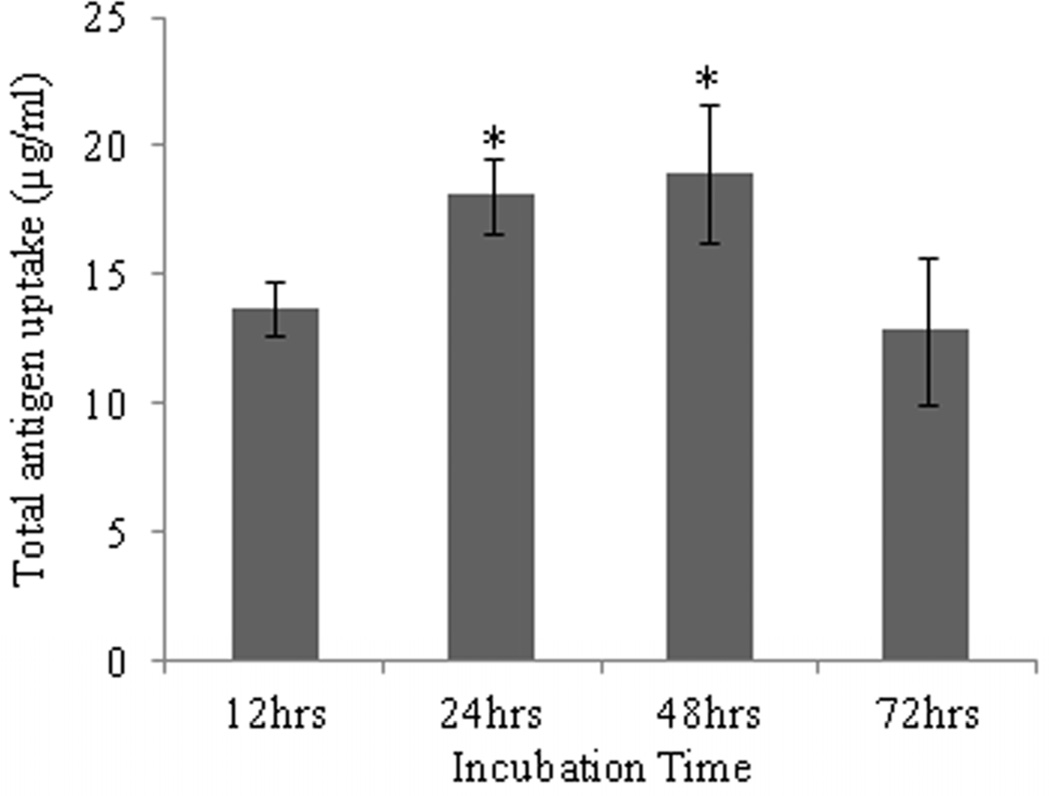
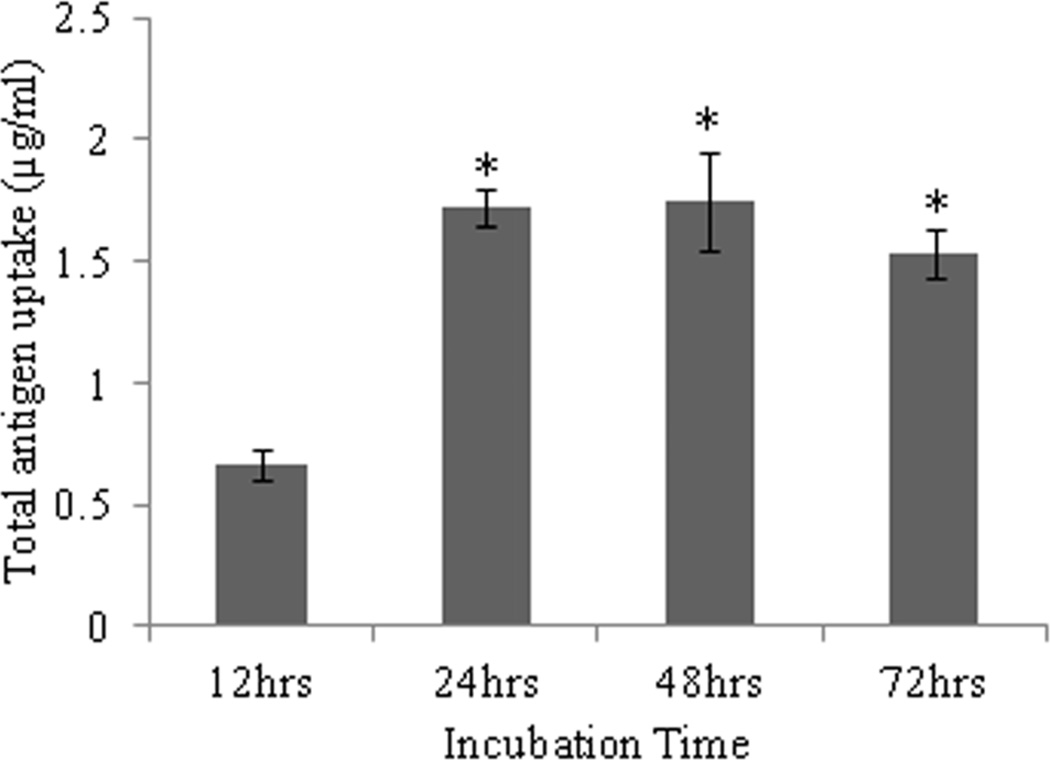
Uptake of AgCPs by APCs was found to depend on particle size, total antigen concentration, and incubation time. Regarding incubation time, uptake of AgCPs by both macrophages and BMDCs increased from 12 h to 24 h (Figure 2a, c). After 24h, no significant increase in antigen uptake was observed. Flow cytometry analysis revealed that 100% of macrophages and BMDCs exposed to AgCPs produced a strong FITC signal indicating that every cell had internalized some amount of AgCPs (Supplemental Figure 1).
Fig. 2.
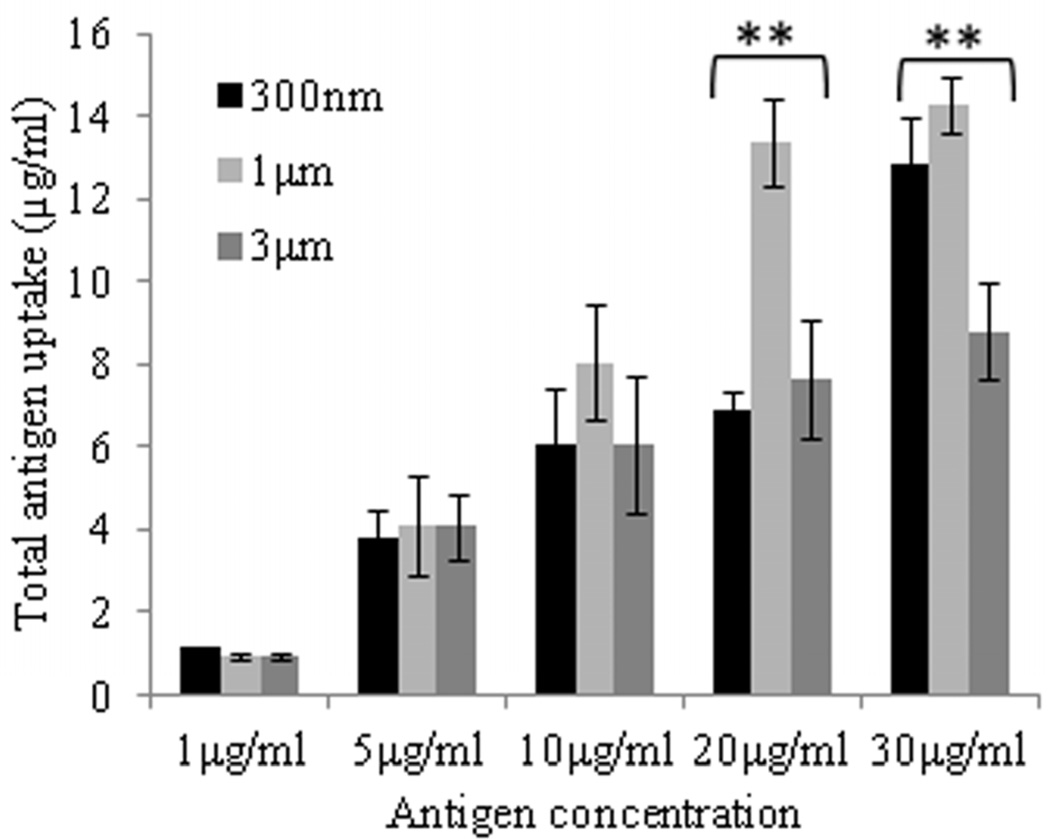
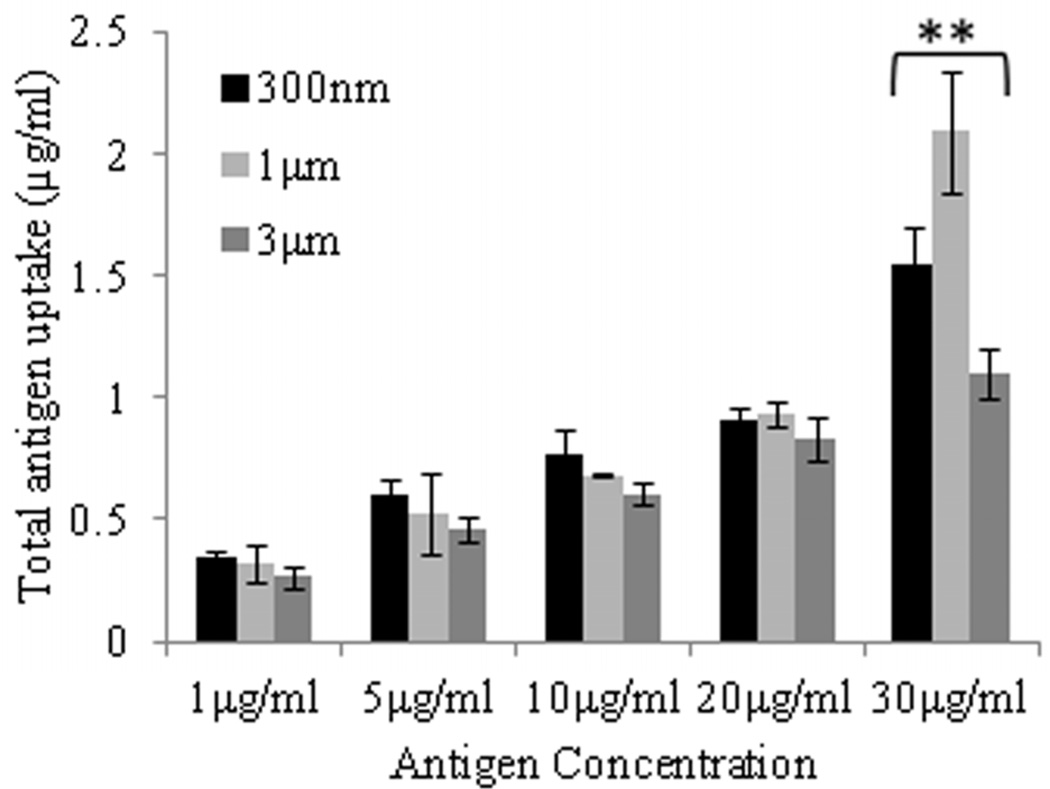
Effect of size, concentration, and incubation time on uptake of AgCPs by APCs. (a) RAW 264.7 macrophages or (c) BMDCs were co-incubated with 1µm AgCPs at an effective antigen/FITC-BSA concentration of 30µg/ml for 12, 24, or 48 hrs. (b) RAW 264.7 macrophages or (d) BMDCs were co-incubated with 300nm, 1µm, or 3µm AgCPs at effective antigen concentrations of 1, 5, 10, 20, or 30µg/ml for 24 hrs. After each co-incubation, cells were rinsed three times with PBS and lysed with 1% triton solution. The amount of FITC-BSA released was quantified via fluorescence spectroscopy. Data are presented as mean ± standard deviation from three independent experiments. *p ≤ 0.05 vs. 12 hrs incubation; **p ≤ 0.05 comparing AgCP sizes for a particular antigen concentration.
Regarding antigen concentration, antigen uptake by both macrophages and BMDCs increased steadily up to the maximum total antigen concentration of 30µg/ml (Figure 2b, d). At lower concentrations, nearly all of the AgCPs co-incubated with macrophages were internalized. As antigen concentration increased, uptake efficiency decreased for both cell types. Macrophages were found to be more efficient at antigen uptake as they had phagocytosed 3- to 14-times as much AgCPs than did BMDCs.
Regarding particle size, maximum antigen uptake by macrophages was observed with 1µm AgCPs (Figure 2b). Increasing particle size to 3µm reduced antigen uptake by macrophages. Antigen uptake by BMDCs was independent of particle size up to 20µg/ml (Figure 2d). However, at 30µg/ml concentration, BMDCs performed similarly to macrophages in that maximum antigen uptake was observed with 1µm AgCPs.
3.3. Macrophage activation
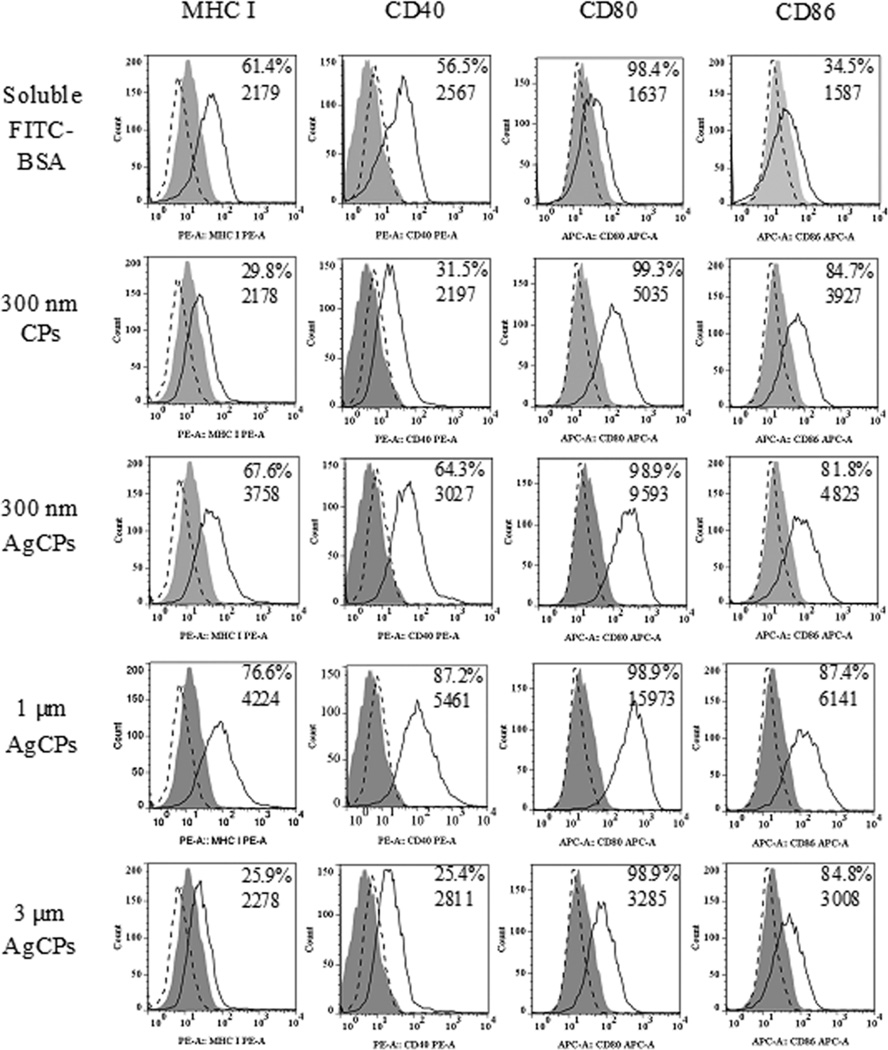
AgCPs outperformed soluble antigen in enhancing upregulation of antigen presenting machinery, co-stimulatory and activation markers on macrophages. Specifically, up to 2-fold increases in MHC I and CD80 expressions, up to a 3-fold increase in CD86 expression, and up to a 10-fold increase in CD80 expression were observed following APC exposure to AgCPs compared to soluble antigens (Figure 3). Increases in MHC II and CD54 were also observed albeit to a lesser degree (data not shown). Upregulation of all markers was dependent on AgCP size with 1µm AgCPs producing maximum responses.
Fig. 3.
Surface marker expression by RAW 264.7 macrophages following exposure to soluble antigen, CPs without antigen or AgCPs. Macrophages were co-incubated with soluble or particulate antigens at a final antigen concentration of 30 µg/ml. After 24 hrs, cells were rinsed three times, harvested, blocked with purified anti-mouse CD16/CD32 and stained with fluorescence-labeled antibodies to MHC molecules and activation markers (solid lines). Filled histograms represent cells treated with media alone. Dotted line histograms are treated cells stained with appropriate isotype controls. All histograms are from one representative experiment of three independent experiments producing similar results. Panel numbers indicate the mean percentages of positive cells (top number) and mean fluorescence intensities (bottom number) of respective samples.
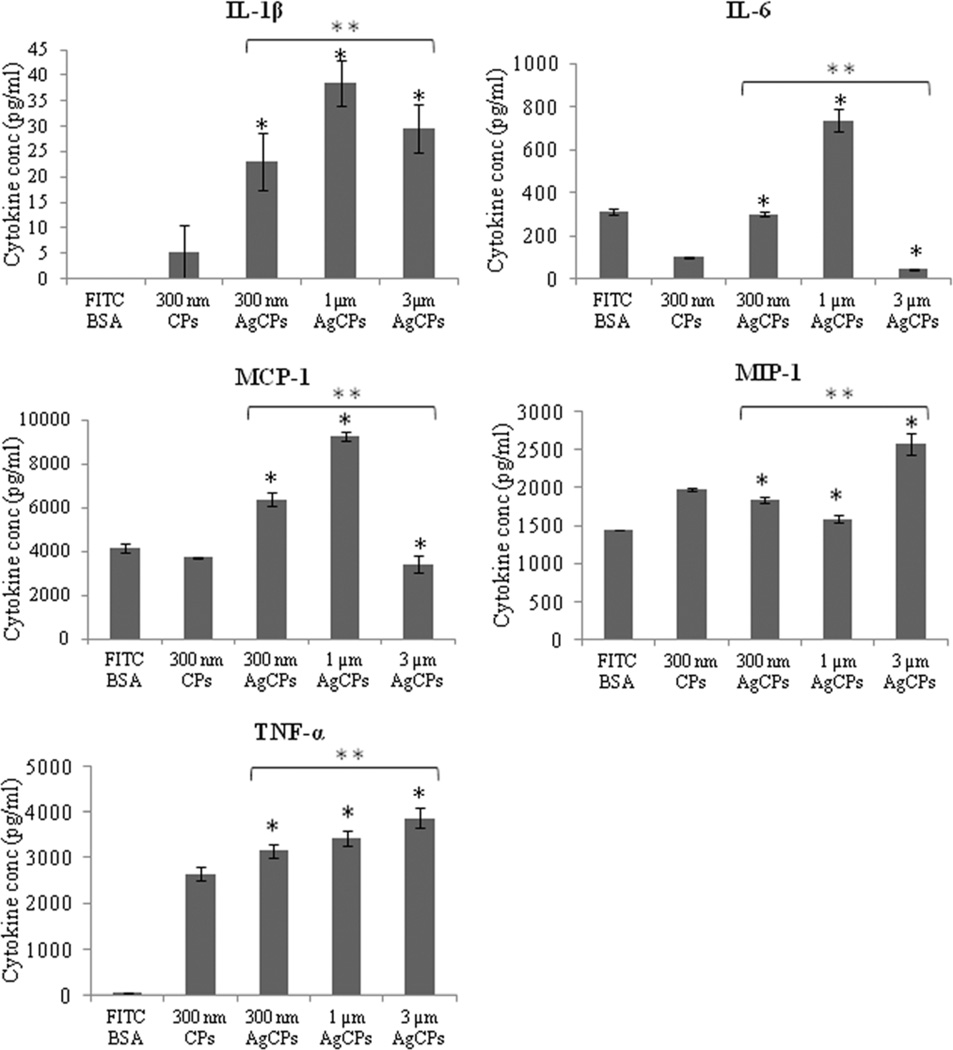
In addition to higher activation status, CBA analyses revealed that macrophages co-incubated with AgCPs released higher amounts of pro-inflammatory cytokines (Figure 4). IL-6 and MCP-1 secretions were more than doubled with 1µm AgCPs compared to soluble antigen while TNF-α production increased by more than 70-fold. MIP-1α release was also modestly, but significantly increased with AgCP co-incubation. IL-1β was not secreted by macrophages exposed to soluble antigen but secreted at high levels with AgCPs co-incubation. Similar to macrophage surface marker expression, cytokine release was dependent on AgCP size. IL-1β, MCP-1 and IL-6 secretions were maximum with 1µm AgCPs while TNF–α and MIP-1α responses were highest with 3µm AgCPs.
Fig. 4.
Cytokine release by RAW 264.7 macrophages. Cells were co-incubated with soluble or particulate antigens at a final antigen concentration of 30 µg/ml. After 24 hrs, supernatants of all groups were collected and analyzed for cytokine production using a customized CBA flex set. Data are presented as mean ± standard deviation from three independent experiments. *p ≤ 0.05 vs. soluble antigen (FITC-BSA); ** p ≤ 0.05 vs. other sizes of AgCPs.
3.4. BMDC activation
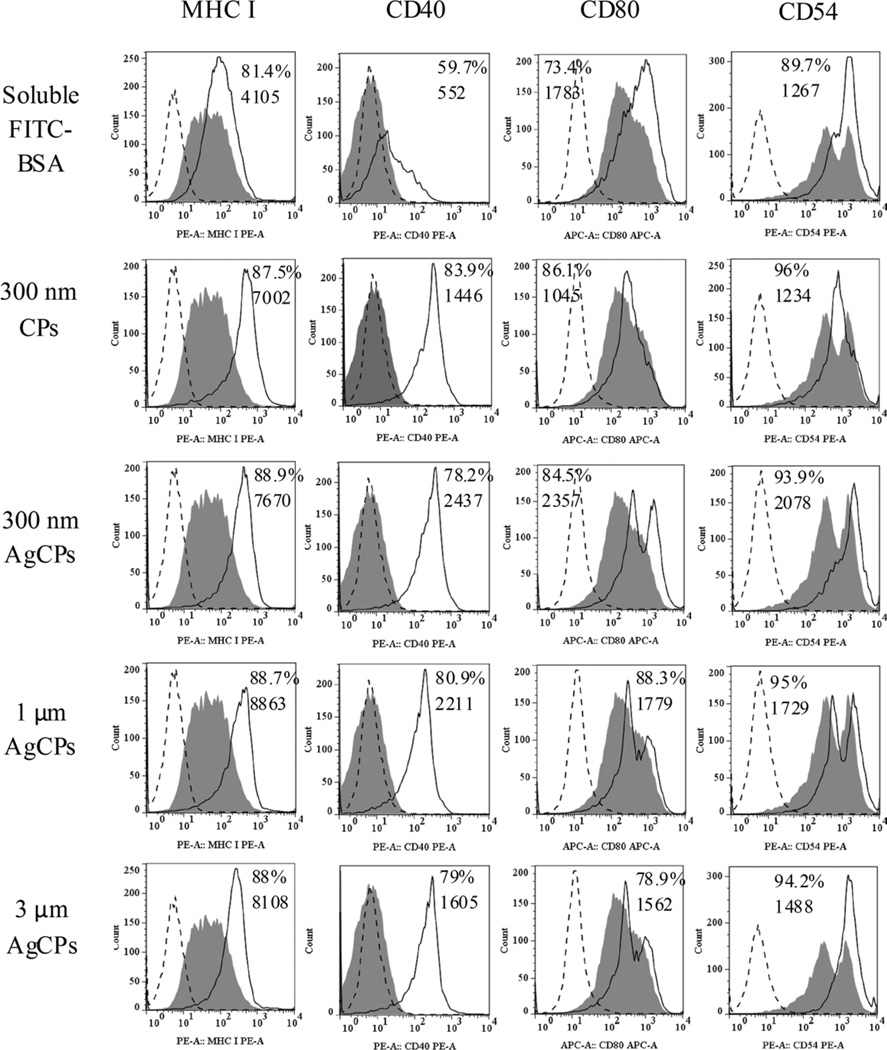
Similar to the above studies with macrophage, AgCPs were more effective than soluble antigen at enhancing upregulation of antigen presenting molecules, co-stimulatory molecules and activation markers on BMDCs. Specifically, CD40 was increased by up to 5-fold, MHC I and CD54 expressions were increased by up to 2-fold on BMDCs treated with AgCPs compared to soluble antigens (Figure 5). To a lower degree, upregulation of MHC II and CD86 was also observed (data not shown). The dependence of BMDC surface marker expression on AgCP size showed a different pattern than was observed for macrophages. Maximum responses for CD40, CD80 and CD54 expressions were elicited by 300nm AgCPs, whereas a slightly higher expression of MHC I was produced by 1µm AgCPs.
Fig. 5.
Surface marker expression by BMDCs following exposure to soluble antigen, CPs without antigen or AgCPs. Macrophages were co-incubated with soluble or particulate antigens at a final antigen concentration of 30 µg/ml. After 24 h, cells were rinsed three times, harvested, blocked with purified anti-mouse CD16/CD32 and stained with fluorescence-labeled antibodies to MHC molecules and activation markers (solid lines). Filled histograms represent cells treated with media alone. Dotted line histograms are treated cells stained with appropriate isotype controls. All histograms are from one representative experiment of three independent experiments producing similar results. Panel numbers indicate the mean percentages of positive cells (top number) and mean fluorescence intensities (bottom number) of respective samples.
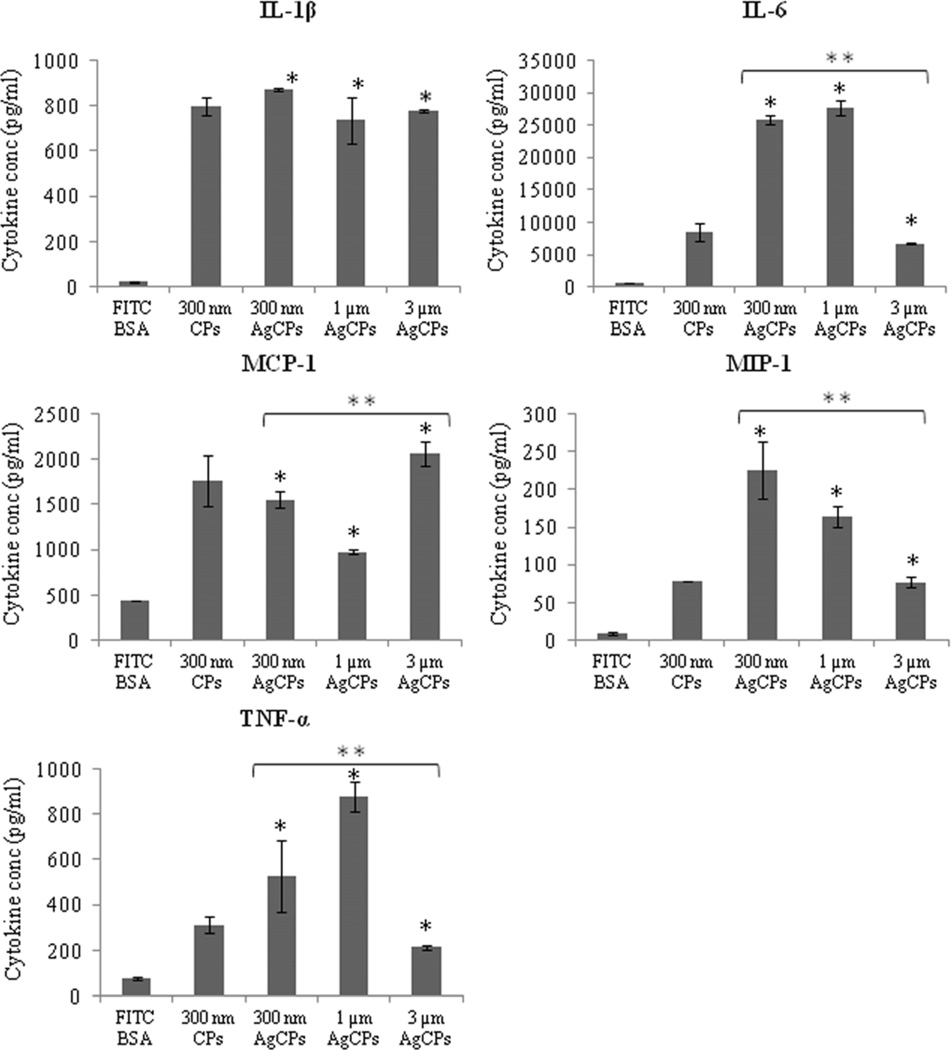
CBA analysis revealed that BMDCs co-incubated with AgCPs release greater levels of pro-inflammatory cytokines (Figure 6). Secretions of IL-1β, IL-6, MCP-1, MIP-1α and TNF–α were increased from 5- to more than 45-fold when BMDCs were co-incubated with AgCPs rather than soluble antigen. For IL-1β and MCP-1, cytokine release was driven by the presence of chitosan since CPs alone account for most, if not all, of the response. Particle size significantly affected cytokine release for 4 of the 5 cytokines measured. Maximum MIP-1α release was achieved with 300nm AgCPs, maximum IL-6 and TNF-α release with 1µm AgCPs while MCP-1 release was maximized with 3µm AgCPs.
Fig. 6.
Cytokine release by BMDCs. Cells were co-incubated with soluble or particulate antigens at a final antigen concentration of 30 µg/ml. After 24 hrs, supernatants of all groups were collected and analyzed for cytokine production using a customized CBA flex set. Data are presented as mean ± standard deviation from three independent experiments. *p ≤ 0.05 vs. soluble antigen (FITC-BSA); ** p ≤ 0.05 vs. other sizes of AgCPs.
3.5. Antigen presentation by BMDCs
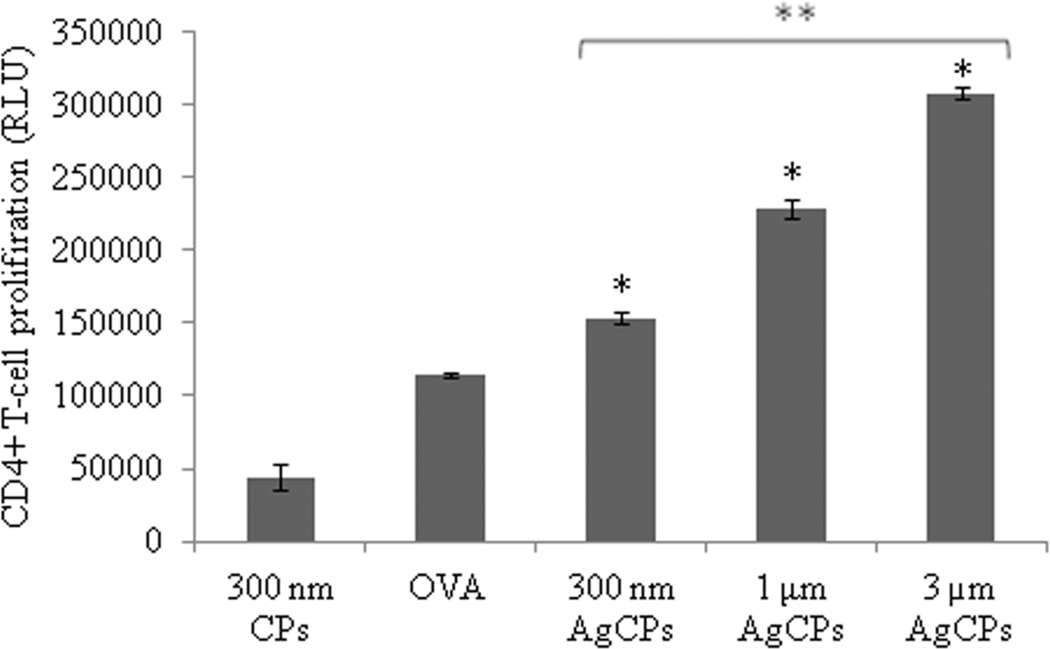
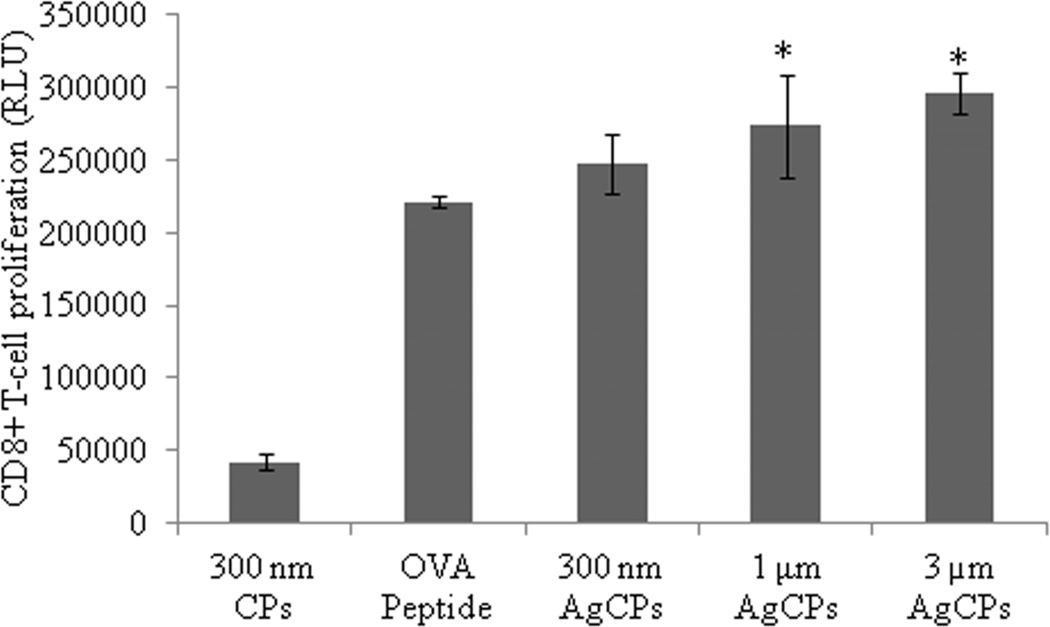
To investigate the effect of encapsulation on antigen presentation, OVA was encapsulated in chitosan particles (OvaCPs) and co-incubated with BMDCs. The pulsed BMDCs were then co-cultured with CD4+ and CD8+ T-cells isolated from the spleens of OVA transgenic OT-II and OT-I mice, respectively, to investigate whether BMDCs pulsed with OvaCPs were capable of priming naive antigen-specific T-cells in vitro. BMDCs pulsed with OvaCPs induced significantly higher levels of proliferation in CD4+ OT-II cells compared to BMDCs pulsed with OVA antigen alone (Figure 7a). Furthermore, CD4+ proliferation increased significantly with the size of OvaCPs. BMDCs pulsed with 1µm and 3µm OvaCPs also induced significantly higher proliferative responses in CD8+ OT-I cells compared to BMDCs pulsed with OVA257–264 peptide alone (Figure 7b). Once again, larger particles resulted in greater proliferation.
Fig. 7.
Proliferation of (a) OVA-specific CD4+ T-cells, and (b) OVA-specific CD8+ T-cells in response to presentation of antigen by BMDCs. BMDCs were pulsed with CPs, AgCPs, soluble full length OVA or the MHC I-restricted OVA257–264 peptide for 24 hrs and then co-incubated with CD4+ or CD8+ T-cells from OT-II or OT-I mice, respectively. After 72 hrs, T cell proliferation was determined via a non-radioactive proliferation assay (CellTiter Glo; Promega, Madison, WI). Data are presented as mean relative light unit (RLU) ± standard deviation from one of two independent experiments with similar results. *p ≤ 0.05 vs. OVA or OVA peptide; **p ≤ 0.05 vs other AgCP sizes.
4. Discussion
The synthesis of chitosan nano- and microparticles to deliver drugs as well as polypeptides has been reported previously [24–28]. However, formulation conditions, starting materials and resulting particle sizes vary considerably in the literature. Because uptake of particles by APCs was found to be dependent on particle size [10, 11], it was important to reproducibly synthesize AgCPs of discrete sizes to explore their effects on APC function. Consequently, we developed a set of parameters, which when manipulated, could reproducibly control chitosan particle size. SEM images and DLS data confirmed the formation of AgCPs that were unimodal and well dispersed in aqueous media. Zeta potential measurements demonstrated that encapsulation of FITC-BSA significantly reduced the cationic surface charge of similarly sized particles from +36.8 mV to +16.8 mV. This was expected given that the pI of BSA is 4.7 and thus BSA carries an overall negative charge at neutral pH. These data are similar to those of Gordon et al, who reported a reduction from +28.8 mV to +18.3 mV when ovalbumin was adsorbed to the surfaces of chitosan nanoparticles [27]. The fact that AgCPs retained a positive surface charge in our study likely facilitated uptake by APCs. Previous research has shown that cationic particles interact with negatively charged cell membranes thus encouraging endocytosis [10, 31].
Antigen encapsulation efficiency increased slightly with particle size as anticipated. The high encapsulation efficiencies were consistent with values observed by others [24, 32]. It is likely that the negative charge of BSA facilitated a high encapsulation rate by encouraging interaction with polycationic chitosan. The effect of polypeptide charge on encapsulation efficiency is the subject of ongoing research.
Uptake studies demonstrated that particle size, concentration, and incubation time influenced AgCP uptake by APCs (Figure 2). Maximum uptake of AgCPs by both macrophages and dendritic cells was achieved by 24 h to 48 h of co-incubation. The decrease in antigen uptake after 48 h may be explained by breakdown of antigen and a subsequent loss of fluorescence signal from FITC-BSA.
For macrophages, AgCP uptake increased with particle size from 300nm to 1µm. However, a further increase to 3µm, reduced antigen uptake. These data were in agreement with previous studies which demonstrated that macrophage uptake reached a maximum with 1µm polystyrene particles with a similar positive surface charge [10, 33]. For BMDCs, antigen uptake was independent of AgCP size until the highest concentration whereupon 1µm particles were preferentially internalized. While it is not surprising that higher concentrations of AgCPs resulted in higher levels of antigen uptake, it is noteworthy that the percentage of antigen that was internalized decreased with increasing AgCP concentration. For instance, at 1µg/ml AgCPs, nearly all of the antigen could be detected in macrophages after 24 hours. However, at 30µg/ml, only about 25–50% of antigen could be detected. These data indicate that uptake may become saturated at higher antigen concentrations.
As seen in Figures 3 and 5, AgCPs outperformed soluble antigen and unloaded CPs in inducing the upregulation of antigen presenting molecules MHC I, MHC II as well as activation and co-stimulatory markers CD40, CD80, and CD86. These marker in particular were chosen as their upregulation is important for APC function during T-cell priming [34, 35]. The finding that unloaded CPs caused modest increases in surface marker expression demonstrated that chitosan itself may have modest immunostimulatory properties or that uptake of particles caused a phenotypic change. Additional studies in our lab are focused on defining the immunomodulatory contributions of chitosan in vitro and in vivo.
Surface marker upregulation was more obvious with the macrophage cell line than with BMDCs which likely contained multiple cell types at different stages of differentiation. Nevertheless, these experiments demonstrated that delivery of encapsulated antigen provided an additive or synergistic effect compared to either soluble antigens or unloaded CPs alone. Similar to the uptake studies, macrophages responded most strongly to 1µm AgCPs, while BMDCs responded to all sizes more or less the same.
The enhanced activation status of APCs exposed to AgCPs was confirmed in cytokine release studies. In both macrophages and BMDCs, AgCPs induced robust increases in production of all pro-inflammatory cytokines tested: IL-1β, IL-6, TNF-α, MCP-1 and MIP-1α. These cytokines were selected based on their potential to stimulate antigen-specific immune responses. IL-1β helps stimulate helper T cells; IL-6 is a B cell differentiation factor and a T cell activator; TNF-α induces T cell proliferation; MCP-1 induces chemotaxis of APCs; and MIP-1α is a granulocyte activator/chemokine and induces the synthesis of other pro-inflammatory cytokines. Macrophages, not surprisingly, released greater levels of monocyte/macrophage specific cytokines MCP-1 and MIP-1. BMDCs on the other hand, produced much higher levels of IL-1β and IL-6. In general, our results are consistent with other studies showing that particulate antigens enhance inflammatory responses by APCs [36, 37].
Up to this point, our results had indicated that AgCPs outperformed soluble antigen in all measures of APC activation. However, these findings would be futile if encapsulated antigens were not appropriately processed and presented. To this end, the ability of BMDCs pulsed with OvaCPs to stimulate OVA-specific T cells was assessed. In accordance with our surface marker and cytokine release studies, we found that BMDCs pulsed with OvaCPs induced significantly higher OVA-specific CD4+ T-cell proliferation than BMDCs pulsed with soluble OVA protein. Unlike the activation studies, the CD4+ T-cell proliferative response, and hence, BMDC antigen presenting function increased with increasing AgCP size. It is possible that the higher concentration of antigen per 3µm particles outweighed any advantages of other AgCP sizes in cytokine release or activation status.
Similarly, BMDCs pulsed with OvaCPs induced higher OVA-specific CD8+ T-cell proliferation than BMDCs pulsed with OVA257–264 peptide. It should be noted that, while BMDCs pulsed with peptide alone were effective at stimulating OVA-specific CD8+ T-cells in vitro, peptides are rapidly degraded and highly inefficient without an delivery system in vivo. Our planned studies will assess vaccine responses to AgCPs in vivo.
It is also worth noting that full length OVA protein was encapsulated in chitosan particles for both CD4+ and CD8+ stimulation studies. Therefore, our findings indicate that encapsulated OVA antigens were presented via both MHC I and II pathways. In fact, encapsulation of antigens by chitosan particles may facilitate endosomal escape and cross presentation [38].
5. Conclusion
Delivery systems which enhance vaccine responses to weakly immunogenic subunit and polypeptide antigens are critical for future vaccine development. Chitosan is a versatile biomaterial with unique properties that support vaccine delivery applications. In this study, we demonstrated that chitosan particles are capable of efficiently delivering encapsulated antigens and enhancing the activation status of both macrophages and dendritic cells. In all measures of APC activation and presentation, AgCPs outperformed soluble antigen. The ability of BMDC’s pulsed with AgCP to present both MHC I and MHC II epitopes is particularly encouraging. Potential modifications of chitosan or incorporation of additional immune response modifiers underscore the versatility of this technology to enhance or control vaccine responses. Our results indicate that AgCPs are a promising vaccine delivery platform deserving of continued exploration. Future studies will explore factors affecting antigen encapsulation and evaluate the in vivo immune response to chitosan particle-based antigen delivery systems.
Supplementary Material
(a) RAW 264.7 macrophages or (b) BMDCs were co-incubated with 1µm AgCPs (solid line) or soluble FITC-BSA (dotted line) at an effective antigen/FITC-BSA concentration of 30 µg/ml. After 24 hrs, cells were rinsed three times, harvested, and read on a flow cytometer using the FITC channel only. Filled histograms represent cells treated with media alone.
Acknowledgements
This work was supported by the National Cancer Institute (K22CA131567 to D.A.Z.).
Footnotes
Publisher's Disclaimer: This is a PDF file of an unedited manuscript that has been accepted for publication. As a service to our customers we are providing this early version of the manuscript. The manuscript will undergo copyediting, typesetting, and review of the resulting proof before it is published in its final citable form. Please note that during the production process errors may be discovered which could affect the content, and all legal disclaimers that apply to the journal pertain.
References
- 1.O'Hagan DT, Singh M, Ulmer JB. Microparticle-based technologies for vaccines. Methods. 2006;40:10–19. doi: 10.1016/j.ymeth.2006.05.017. [DOI] [PubMed] [Google Scholar]
- 2.O'Hagan DT, Valiante NM. Recent advances in the discovery and delivery of vaccine adjuvants. Nat Rev Drug Discov. 2003;2:727–735. doi: 10.1038/nrd1176. [DOI] [PMC free article] [PubMed] [Google Scholar]
- 3.Clark TG, Cassidy-Hanley D. Recombinant subunit vaccines: potentials and constraints. Dev Biol (Basel) 2005;121:153–163. [PubMed] [Google Scholar]
- 4.Schlom J, Gulley JL, Arlen PM. Paradigm shifts in cancer vaccine therapy. Exp Biol Med (Maywood) 2008;233:522–534. doi: 10.3181/0708-MR-226. [DOI] [PMC free article] [PubMed] [Google Scholar]
- 5.Schlom J, Gulley JL, Arlen PM. Role of vaccine therapy in cancer: biology and practice. Curr Oncol. 2007;14:238–245. doi: 10.3747/co.2007.158. [DOI] [PMC free article] [PubMed] [Google Scholar]
- 6.Qu B, Rosenberg RN, Li L, Boyer PJ, Johnston SA. Gene vaccination to bias the immune response to amyloid-beta peptide as therapy for Alzheimer disease. Arch Neurol. 2004;61:1859–1864. doi: 10.1001/archneur.61.12.1859. [DOI] [PMC free article] [PubMed] [Google Scholar]
- 7.Perrie Y, Mohammed AR, Kirby DJ, McNeil SE, Bramwell VW. Vaccine adjuvant systems: enhancing the efficacy of sub-unit protein antigens. Int J Pharm. 2008;364:272–280. doi: 10.1016/j.ijpharm.2008.04.036. [DOI] [PubMed] [Google Scholar]
- 8.Morein B, Villacres-Eriksson M, Sjolander A, Bengtsson KL. Novel adjuvants and vaccine delivery systems. Vet Immunol Immunopathol. 1996;54:373–384. doi: 10.1016/S0165-2427(96)05697-8. [DOI] [PMC free article] [PubMed] [Google Scholar]
- 9.O'Hagan DT, Rappuoli R. Novel approaches to vaccine delivery. Pharm Res. 2004;21:1519–1530. doi: 10.1023/B:PHAM.0000041443.17935.33. [DOI] [PMC free article] [PubMed] [Google Scholar]
- 10.He C, Hu Y, Yin L, Tang C, Yin C. Effects of particle size and surface charge on cellular uptake and biodistribution of polymeric nanoparticles. Biomaterials. 2010;31:3657–3666. doi: 10.1016/j.biomaterials.2010.01.065. [DOI] [PubMed] [Google Scholar]
- 11.Thiele L, Rothen-Rutishauser B, Jilek S, Wunderli-Allenspach H, Merkle HP, Walter E. Evaluation of particle uptake in human blood monocyte-derived cells in vitro. Does phagocytosis activity of dendritic cells measure up with macrophages? J Control Release. 2001;76:59–71. doi: 10.1016/s0168-3659(01)00412-6. [DOI] [PubMed] [Google Scholar]
- 12.Scheicher C, Mehlig M, Dienes HP, Reske K. Uptake of bead-adsorbed versus soluble antigen by bone marrow derived dendritic cells triggers their activation and increases their antigen presentation capacity. Adv Exp Med Biol. 1995;378:253–255. doi: 10.1007/978-1-4615-1971-3_56. [DOI] [PubMed] [Google Scholar]
- 13.Scheicher C, Mehlig M, Dienes HP, Reske K. Uptake of microparticle-adsorbed protein antigen by bone marrow-derived dendritic cells results in up-regulation of interleukin-1 alpha and interleukin-12 p40/p35 and triggers prolonged, efficient antigen presentation. Eur J Immunol. 1995;25:1566–1572. doi: 10.1002/eji.1830250615. [DOI] [PubMed] [Google Scholar]
- 14.Singh M, Chakrapani A, O'Hagan D. Nanoparticles and microparticles as vaccine-delivery systems. Expert Rev Vaccines. 2007;6:797–808. doi: 10.1586/14760584.6.5.797. [DOI] [PubMed] [Google Scholar]
- 15.Pearse MJ, Drane D. ISCOMATRIX adjuvant for antigen delivery. Adv Drug Deliv Rev. 2005;57:465–474. doi: 10.1016/j.addr.2004.09.006. [DOI] [PubMed] [Google Scholar]
- 16.Zaharoff DA, Hance KW, Rogers CJ, Schlom J, Greiner JW. Intratumoral immunotherapy of established solid tumors with chitosan/IL-12. J Immunother. 2010;33:697–705. doi: 10.1097/CJI.0b013e3181eb826d. [DOI] [PMC free article] [PubMed] [Google Scholar]
- 17.Zaharoff DA, Hoffman BS, Hooper HB, Benjamin CJ, Jr, Khurana KK, Hance KW, et al. Intravesical immunotherapy of superficial bladder cancer with chitosan/interleukin-12. Cancer Res. 2009;69:6192–6199. doi: 10.1158/0008-5472.CAN-09-1114. [DOI] [PMC free article] [PubMed] [Google Scholar]
- 18.Zaharoff DA, Rogers CJ, Hance KW, Schlom J, Greiner JW. Chitosan solution enhances the immunoadjuvant properties of GM-CSF. Vaccine. 2007;25:8673–8686. doi: 10.1016/j.vaccine.2007.10.037. [DOI] [PMC free article] [PubMed] [Google Scholar]
- 19.Zaharoff DA, Rogers CJ, Hance KW, Schlom J, Greiner JW. Chitosan solution enhances both humoral and cell-mediated immune responses to subcutaneous vaccination. Vaccine. 2007;25:2085–2094. doi: 10.1016/j.vaccine.2006.11.034. [DOI] [PMC free article] [PubMed] [Google Scholar]
- 20.Arca HC, Gunbeyaz M, Senel S. Chitosan-based systems for the delivery of vaccine antigens. Expert Rev Vaccines. 2009;8:937–953. doi: 10.1586/erv.09.47. [DOI] [PubMed] [Google Scholar]
- 21.Bernkop-Schnurch A. Chitosan and its derivatives: potential excipients for peroral peptide delivery systems. Int J Pharm. 2000;194:1–13. doi: 10.1016/s0378-5173(99)00365-8. [DOI] [PubMed] [Google Scholar]
- 22.Kreuter J. Nanoparticles and microparticles for drug and vaccine delivery. J Anat. 1996;189(Pt 3):503–505. [PMC free article] [PubMed] [Google Scholar]
- 23.van der Lubben IM, Verhoef JC, Borchard G, Junginger HE. Chitosan and its derivatives in mucosal drug and vaccine delivery. Eur J Pharm Sci. 2001;14:201–207. doi: 10.1016/s0928-0987(01)00172-5. [DOI] [PubMed] [Google Scholar]
- 24.Berthold A, Cremer K, Kreuter J. Preparation and characterization of chitosan microspheres as drug carrier for prednisolone sodium phosphate as model for antiinflammatory drugs. J Control Release. 1996;39:17–25. [Google Scholar]
- 25.Gan Q, Wang T. Chitosan nanoparticle as protein delivery carrier--systematic examination of fabrication conditions for efficient loading and release. Colloids Surf B Biointerfaces. 2007;59:24–34. doi: 10.1016/j.colsurfb.2007.04.009. [DOI] [PubMed] [Google Scholar]
- 26.Ozbas-Turan S, Akbuga J, Aral C. Controlled release of interleukin-2 from chitosan microspheres. J Pharm Sci. 2002;91:1245–1251. doi: 10.1002/jps.10122. [DOI] [PubMed] [Google Scholar]
- 27.Gordon S, Saupe A, McBurney W, Rades T, Hook S. Comparison of chitosan nanoparticles and chitosan hydrogels for vaccine delivery. J Pharm Pharmacol. 2008;60:1591–1600. doi: 10.1211/jpp/60.12.0004. [DOI] [PubMed] [Google Scholar]
- 28.Nagamoto T, Hattori Y, Takayama K, Maitani Y. Novel chitosan particles and chitosan-coated emulsions inducing immune response via intranasal vaccine delivery. Pharm Res. 2004;21:671–674. doi: 10.1023/b:pham.0000022414.17183.58. [DOI] [PubMed] [Google Scholar]
- 29.van der Lubben IM, Verhoef JC, Borchard G, Junginger HE. Chitosan for mucosal vaccination. Adv Drug Deliv Rev. 2001;52:139–144. doi: 10.1016/s0169-409x(01)00197-1. [DOI] [PubMed] [Google Scholar]
- 30.Inaba K, Swiggard WJ, Steinman RM, Romani N, Schuler G, Brinster C. Isolation of dendritic cells. Curr Protoc Immunol. 2009;Chapter 3(Unit 3):7. doi: 10.1002/0471142735.im0307s86. [DOI] [PubMed] [Google Scholar]
- 31.Harush-Frenkel O, Rozentur E, Benita S, Altschuler Y. Surface charge of nanoparticles determines their endocytic and transcytotic pathway in polarized MDCK cells. Biomacromolecules. 2008;9:435–443. doi: 10.1021/bm700535p. [DOI] [PubMed] [Google Scholar]
- 32.Pan Y, Li YJ, Zhao HY, Zheng JM, Xu H, Wei G, et al. Bioadhesive polysaccharide in protein delivery system: chitosan nanoparticles improve the intestinal absorption of insulin in vivo. Int J Pharm. 2002;249:139–147. doi: 10.1016/s0378-5173(02)00486-6. [DOI] [PubMed] [Google Scholar]
- 33.Shanbhag AS, Jacobs JJ, Black J, Galante JO, Glant TT. Macrophage/particle interactions: effect of size, composition and surface area. J Biomed Mater Res. 1994;28:81–90. doi: 10.1002/jbm.820280111. [DOI] [PubMed] [Google Scholar]
- 34.Banchereau J, Briere F, Caux C, Davoust J, Lebecque S, Liu YJ, et al. Immunobiology of dendritic cells. Annu Rev Immunol. 2000;18:767–811. doi: 10.1146/annurev.immunol.18.1.767. [DOI] [PubMed] [Google Scholar]
- 35.Banchereau J, Steinman RM. Dendritic cells and the control of immunity. Nature. 1998;392:245–252. doi: 10.1038/32588. [DOI] [PubMed] [Google Scholar]
- 36.Elamanchili P, Diwan M, Cao M, Samuel J. Characterization of poly(D,L-lactic-co-glycolic acid) based nanoparticulate system for enhanced delivery of antigens to dendritic cells. Vaccine. 2004;22:2406–2412. doi: 10.1016/j.vaccine.2003.12.032. [DOI] [PubMed] [Google Scholar]
- 37.Sharp FA, Ruane D, Claass B, Creagh E, Harris J, Malyala P, et al. Uptake of particulate vaccine adjuvants by dendritic cells activates the NALP3 inflammasome. Proc Natl Acad Sci U S A. 2009;106:870–875. doi: 10.1073/pnas.0804897106. [DOI] [PMC free article] [PubMed] [Google Scholar]
- 38.Chang KL, Higuchi Y, Kawakami S, Yamashita F, Hashida M. Efficient gene transfection by histidine-modified chitosan through enhancement of endosomal escape. Bioconjug Chem. 2010;21:1087–1095. doi: 10.1021/bc1000609. [DOI] [PubMed] [Google Scholar]
Associated Data
This section collects any data citations, data availability statements, or supplementary materials included in this article.
Supplementary Materials
(a) RAW 264.7 macrophages or (b) BMDCs were co-incubated with 1µm AgCPs (solid line) or soluble FITC-BSA (dotted line) at an effective antigen/FITC-BSA concentration of 30 µg/ml. After 24 hrs, cells were rinsed three times, harvested, and read on a flow cytometer using the FITC channel only. Filled histograms represent cells treated with media alone.


