Abstract
Children born with univentricular heart disease typically must undergo three open heart surgeries within the first 2–3 years of life to eventually establish the Fontan circulation. In that case the single working ventricle pumps oxygenated blood to the body and blood returns to the lungs flowing passively through the Total Cavopulmonary Connection (TCPC) rather than being actively pumped by a subpulmonary ventricle. The TCPC is a direct surgical connection between the superior and inferior vena cava and the left and right pulmonary arteries. We have postulated that a mechanical pump inserted into this circulation providing a 3–5 mmHg pressure augmentation will reestablish bi-ventricular physiology serving as a bridge-to-recovery, bridge-to-transplant or destination therapy as a “biventricular Fontan” circulation. The Viscous Impeller Pump (VIP) has been proposed by our group as such an assist device. It is situated in the center of the 4-way TCPC intersection and spins pulling blood from the vena cavae and pushing it into the pulmonary arteries. We hypothesized that Large Eddy Simulation (LES) using high-order numerical methods are needed to capture unsteady powered and unpowered Fontan hemodynamics. Inclusion of a mechanical pump into the CFD further complicates matters due to the need to account for rotating machinery. In this study, we focus on predictions from an in-house high-order LES code (WenoHemo™) for unpowered and VIP-powered idealized TCPC hemodynamics with quantitative comparisons to Stereoscopic Particle Imaging Velocimetry (SPIV) measurements. Results are presented for both instantaneous flow structures and statistical data. Simulations show good qualitative and quantitative agreement with measured data.
Keywords: High Order Large Eddy Simulation, Fontan circulation, Viscous Impeller Pump
1. Introduction
Compared to normal circulation, children born with single ventricle heart disease typically undergo a series of three staged open heart surgeries within the first 2–3 years of life to eventually live with a Fontan circulation (Gewillig, 2005). The anatomy of the Fontan circulation involves a direct connection between the Superior and Inferior Vena Cavae (SVC and IVC) and the Right and Left Pulmonary Arteries (RPA and LPA) forming the Total Cavopulmonary Connection or TCPC. Effectively, these patients have a single working ventricle which pumps oxygenated blood to the body and deoxygenated blood passively flows through the TCPC to the lungs in series, but without a subpulmonary power source. It is an inherently inefficient circulation which is associated with elevated systemic venous pressures and reduced ventricular filling (Deleval, 1998). The TCPC hemodynamics effectively involve two confined impinging jets and complex unsteady chaotic vortical flow patterns resulting in undesirable pressure loss and irregular streaming. For more than the past decade researchers have focused on reducing pressure losses at the TCPC junction by passive geometric means such as introducing off-set (Migliavacca et al., 2003), or splitting the SVC and/or IVC (Soerensen et al., 2007; Marsden et al., 2009). Those solutions prevent the two jets coming from the IVC and SVC from colliding. By doing so, the competition between the two jets is avoided, and so are the strong pressure losses. In contrast, our group has focused on a cavopulmonary assist device, which consists in inserting a mechanical pump into the Fontan circulation to provide the estimated 3–5 mmHg needed to reestablish normal biventricular pressure levels as a means to bridge-to-recovery or bridge-to-transplant (Rodefeld et al., 2003). Previous designs have been proposed, from axial blood pumps placed in the vena cavae (Rodefeld et al., 2003) to a folding propeller design (Throckmorton et al., 2007). Our current design has evolved substantially from prior device concepts, is based on the von Karman viscous pump principle and involves spinning a double-sided cone featuring 6 mild vanes at the center of the TCPC junction (Rodefeld et al., 2010). The pump design is motivated by the desire for a percutaneous expandable rotary blood pump. This pump could be used to reduce the number of surgeries required for the survival of the infants from three to two or even one. In addition, this would minimize the Fontan-related disease caused by the current staged procedures while older. This pump would also be used in older patients showing signs of heart failure. Placing a right-sided power source in the univentricular Fontan circulation will restore conditions closer to a normal two-ventricle circulation. This will ease the symptoms of Fontan failure and allow the physician to take care of the patient as a “biventricular Fontan”. Preliminary performance, biocomptability and CFD studies of a rigid prototype have demonstrated the feasibility of the Viscous Impeller Pump (VIP) (Kennington et al., 2011; Giridharan et al., 2012).
Computational fluid dynamics (CFD) of pathological and medical device hemodynamics has become very popular over the past decade due to the widespread availability of medical images, associated processing software, and open-source and commercial CFD packages. Many of these studies assume laminar flow or use Reynolds Averaged Navier-Stokes (RANS) based turbulence models for predictions. This is potentially a problem when dealing with pathological and medical device hemodynamics due to the flow regime being transitional or low Reynolds number turbulence, and featuring flow curvature and rotation. Traditional RANS-based turbulence models are known to have accuracy issues in dealing with these flow features. These issues were recently brought out in paper reporting on an FDA-approved computational and experimental study of an idealized medical device (Stewart et al., 2012). In addition, blood damage prediction models typically require accurate predictions of instantaneous wall shear stress and flow residence time, and this information is typically not available in a RANS simulation. Other simulations of Fontan circulation involved the use of low order finite element methods allowing an easier coupling between fluid and solid domains (Marsden et al., 2009).
In this study, the focus is on Large Eddy Simulation (LES) and its potential to predict pathological and medical device hemodynamics. In LES the large-scale unsteady three-dimensional flow features are numerically resolved and the effect of the unresolved small-scale eddies on the large-scales is modeled using a Subgrid-Scale (SGS) model (Pope, 2000). While it is debatable, there is a general consensus in the literature that LES calls for the use of a high-order numerical method to accurately capture the still relatively wide-range of large eddy length scales. The use of high-order numerical methods often makes application to complex geometries, especially those involving patient-specific geometries and rotating machinery, difficult. Also, accurate SGS models that can handle transitional flows are still a challenge. Furthermore, validation of LES predictions through quantitative comparisons to measured velocity profiles, and not just more global measures like pressure drop or pump performance, is critical.
Our approach is based on the use of a finite-difference method using a structured Cartesian grid combined with a version of the immersed boundary method for handling complex geometries and rotating machinery. In the next section, the computational method is described in detail. This is followed by a brief description of the experimental method used to obtain the measured data for validation. More details on this experiments and a full description of the measurements appear in a separate publication (Kerlo et al., 2011). Following, LES results for unpowered and powered Fontan hemodynamics are presented with comparisons to measured data. A summary concludes the paper.
2. Methods
2.1. LES equations
The filtered incompressible Navier-Stokes equations solved in our in-house code (WenoHemo™) are:
| (1) |
| (2) |
where ūi is the ith component of the spatially filtered velocity vector, p̄ is the spatially filtered pressure, xi is the ith component of the spatial domain and τij is the sub-grid stress tensor which arises from the filtering of the equations, and is defined as:
| (3) |
All the parameters (velocities, spatial variables...) are dimensionless. In the case of the TCPC simulations, the velocity is non dimensionalized using the inlet velocity Uinlet and the physical dimensions are non dimensionalized using the inlet diameter D.
The Vreman SGS turbulence model is employed in this study. The SGS stress tensor τij is related to the filtered strain rate tensor Sij using an eddy viscosity ≠T, where:
| (4) |
| (5) |
The model for the kernel M(u⃗), originally proposed by Vreman (Vreman, 2004) and tested in the present code by Shetty et al. (2010), is robust and easy to implement. The kernel is a function of the components of the velocity gradient tensor. The constant C arises from the Vreman model and its value can vary as a function of the case studied. In our case, the value of the constant used is 0.07. More details on the eddy viscosity formula are provided in the two papers cited above (Vreman, 2004; Shetty et al., 2010). Due to the form of the model kernel, the eddy viscosity goes to zero in laminar regions, as well as in near wall regions. These are important features of a SGS model for transitional wall-bounded flows such as those studied herein.
2.2. Numerical methods
In order to solve equations 1 and 2, a predictor/corrector scheme is used. During the first stage, a predicted value of the velocity field u* is obtained by solving equation 1 without the pressure term. The pressure field is then obtained by solving the following Poisson equation:
| (6) |
The velocity field is finally corrected to obtain , which now respects the continuity equation.
| (7) |
The time integration is performed using a third order accurate backward difference scheme (Shetty et al., 2011).
The convective terms in equation 1 are discretized using a fifth-order accurate Weighted Essentially Non-Oscillatory (WENO) scheme. The WENO scheme uses adaptive stencils to balance the desire for high-order accuracy with a non-oscillatory solution near discontinuities. This scheme uses upwinding based on the sign of the velocity multiplying the spatial derivative and chooses the smoothest stencil by avoiding the discontinuities in the interpolation process. The detailed of the scheme can be found in Zhang’s article (Zhang and Jackson, 2009). The computation of the viscous terms and SGS terms involves the use of first-order and second-order derivatives, which are discretized using fourth-order central finite-difference schemes.
2.3. Immersed boundary method
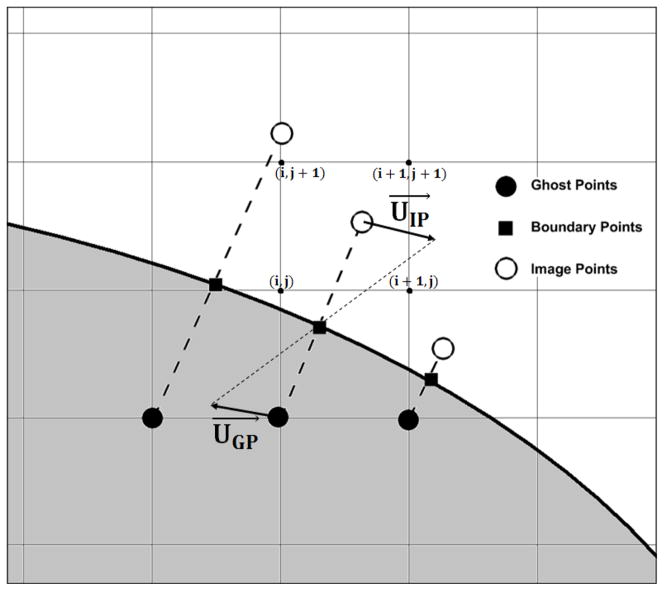
The use of the above high-order numerical method is facilitated by using a fixed structured staggered Cartesian grid (Shetty et al., 2010). In order to account for flow over or through complex shaped rigid or rotating bodies, an Immersed Boundary Method (IBM) is employed. Specifically, a mirroring of the fluid flow inside the solid body is used (Mark and van Wachem, 2008). The IBM requires a triangulated surface mesh for the objects we wish to flow over or through. The procedure begins with a computation of the surface normal for each surface point. Next, the structured Cartesian grid points are separated into two categories: inside or outside of the immersed body (IB) or bodies. For the solid points, ghost points (GP) are defined as those having a neighbor inside the fluid region. The ghost points are projected into the fluid region, normal to the surface of the IB (using the previously computed normals). This results in a boundary point (BP) on the surface and an image point (IP) inside the fluid region (see Fig. 1). The value of the velocity at the boundary point is set to enforce the desired boundary condition at the IB surface. The value of the velocity at the IP is obtained by interpolating the velocity from the neighbor points using the following equations:
| (8) |
| (9) |
Figure 1.
Schematic of the Immersed Boundary Method: the shaded region corresponds to the solid body. The “mirroring” characteristic of the method corresponds here to a zero velocity boundary condition at the surface of the body
In the above equation, x*, y* and z* correspond to the coordinates of the 8 points surrounding the IPs and xIP, yIP and zIP correspond to the IP coordinates. The value of the velocity at the GP location is then obtained using:
| (10) |
This method has been shown to be second order accurate.
2.4. Grid stretching
In order to cluster as many points as possible in the fluid region, we are using an analytical grid clustering formula that allows to stretch the Cartesian mesh at one particular location in each direction. The LES computations are then performed in computational space (ξ, η, ζ) instead of the physical space (x, y, z). The grid stretching expression used here is:
| (11) |
| (12) |
| (13) |
| (14) |
where χ controls the strength of the clustering, ψ controls the location of the stretching, L is the length of the domain in the stretching direction, and xmin, ymin and zmin are the minimum values of the domain along the x, y and z directions. The values of the derivatives in the computational space are then computed using the chain rule (only the conversion from x space to ξ space is presented):
| (15) |
| (16) |
2.5. Experimental method
Experiments to measure the flow field associated with powered Fontan hemodynamics using the VIP are also carried out and serve as further validation of the LES predictions. Stereoscopic Particle Image Velocimetry (SPIV) is employed in an in-vitro mock flow loop using an index-matched blood analog fluid and the same idealized TCPC model as in the LES to measure the three velocity components within two-dimensional planes at different locations. The experimental setup enables the study of the flow characteristics in a horizontal plane near and away from the VIP along the LPA or RPA. Hollow glass beads are uniformly mixed to the blood analog fluid as seeding particles. A dual-head Nd:YAG pulse laser (Quantel Twins BSL140) periodically illuminates the central horizontal plane of the test section (y-z plane). The laser beam is directed toward the area of interest by forming 1 mm-thick laser sheets through a combination of optical lenses. The two CCD cameras required for the SPIV measurements point towards the area of interest at tilt angle of α = 30. The cameras and the laser are synchronized using a multi-channel pulse generator (Quantum Composers). SPIV data are obtained at the central horizontal plane and for two consecutive downstream locations along the x-axis of the RPA. At each location 8, 000 snapshots of particle images are recorded from each camera, which gives once processed 4, 000 instantaneous velocity field enabling statistical analysis.
3. Results
3.1. Simulation details
The hybrid high-order finite-difference LES/IBM solver allows both internal and external flow simulations. For the VIP-powered Fontan hemodynamics studied here, both types of flow simulations are present at the same time with flow through the TCPC and over the rotating VIP. For the idealized TCPC geometry and the VIP pump head, a surface mesh was created using triangular elements in Gambit (ANSYS). These mesh(es) are then read by the solver to save each nodes location and compute the normal vector for each triangular element.
At the inlet(s) a velocity profile is imposed to match the desired flow rate. In the case of Fontan hemodynamics, a parabolic velocity profile is used to match the laminar flow imposed at the entrance of the TCPC in the experiments. The mean velocity is computed using the flow rate and the imposed velocity profile is:
| (17) |
where R is the radius of the Vena Cava (VC). At the outlet, a constant value of 10 is imposed for the pressure and a zero-gradient boundary condition is imposed for the velocity assuming fully developed flow:
| (18) |
At the inlet(s) and at the wall(s), a zero gradient boundary condition is imposed for the pressure. If the wall is an IB, the values of the GPs automatically enforce the zero gradient boundary condition for the pressure at the wall. If the wall boundary condition is imposed at a flow boundary of the domain, the Poisson solver (Adams, 1999) imposes the desired boundary condition automatically. In order to impose the desired boundary condition for the velocity at the edges of the domain, three layers of points are added outside of the domain in every directions. The values of the extra points are set to satisfy the boundary conditions. Let’s consider the upper boundary of the computational domain and N be the number of grid points in a particular direction: in that case the values of the points outside the domain are set as follow:
The code is parallelized using OpenMP (OMP, 2012) and simulations are typically run using 8 processors over a month for the no VIP case and the static VIP case, and two months for the rotating VIP cases. This is the time needed to obtain converged statistics to compare to experimental measurements.
3.2. Validation
In order to validate the IBM, the classical case of flow over a sphere is considered. At low Re number based on the sphere diameter, flow over a sphere results in the formation of a wake with steady vortices. The location of the center of those vortices and the length of the recirculation bubble are directly related to the Re number. Simulations for four different Re number (50, 100, 200 and 200) are considered and compared to the experimental measurements reported by Johnson et al (Johnson and Patel, 1999). The computational domain is 25 sphere diameters in the flow direction and 8 sphere diameters in the other two directions. A Cartesian grid with 384 points in the flow direction and 128 points in the other two directions is used. Results show very good agreement between the simulations and the measurements for the location of the vortices and the length of the recirculation zone.
3.3. LES of Fontan hemodynamics
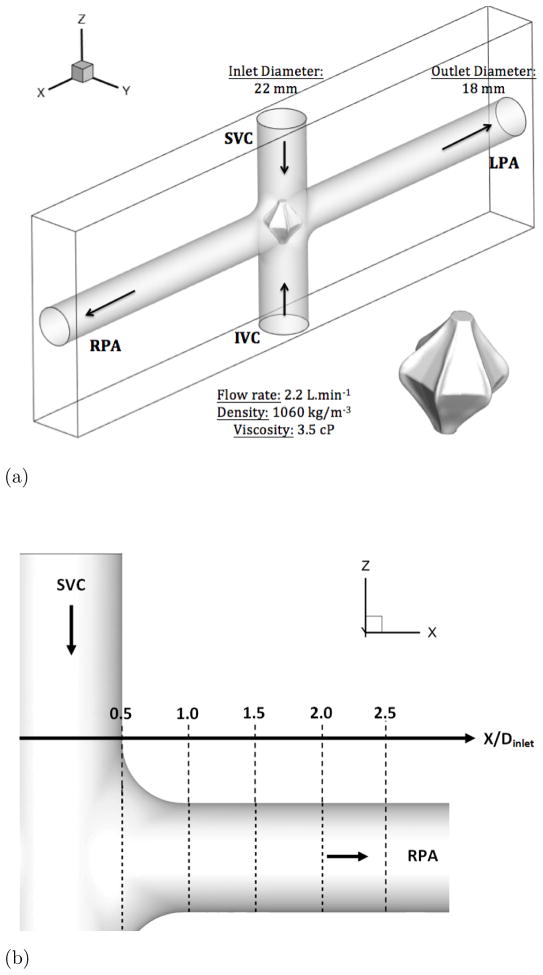
The current state-of-the-art in simulating Fontan hemodynamics involves the use of patient-specific geometries (Zelicourt et al., 2010). In this study, an idealized TCPC geometry, shown in Fig. 2-a, is employed in both the experiments and simulations. The two inlet pipes of inner diameter 22 mm correspond to the SVC and IVC and the two outlet pipes of inner diameter 18 mm correspond to the RPA and LPA. The computational domain is a rectangular box that is 15 inlet diameters along the Pulmonary Arteries (PA) or x–direction and 5 inlet diameters along the VC or z–direction. The Cartesian grid used is a 512 × 64 × 128 with stretching along the x and z directions to cluster the points towards the center of the domain (fluid region). The stretching coefficient χ is chosen as 3, resulting in a clustering of 65 points across the diameter of the VCs and 55 points across the diameter of the PAs. Due to the particular geometry of the TCPC, 45% of the grid points are located outside the fluid region.
Figure 2. Presentation of the idealized TCPC.
Figure 2a: Schematic of the Idealized TCPC with the VIP. SVC: Superior Vena Cava, IVC: Inferior Vena Cava, LA: Left Artery, RA: Right Artery
Figure 2b: Schematic of the location of extracted profiles for comparison with SPIV
At each inlet, a flow rate of 2.2 L.min−1 is imposed, corresponding to a mean velocity of 0.0964 m.s−1. The value of the density and viscosity are chosen to match those used in the experiments and are 1060 kg.m−3 and 3.5 cP, respectively, which are close to physiological values. The Re number based on the inlet diameter and flow rate is about 700. At the outlets an outflow boundary condition for the u-component of the velocity and a free slip boundary condition for the v and w-components of the velocity are imposed (see section 3.1). For the pressure, a constant value of 10 is imposed at the outlets. Along the y–direction, a no-slip boundary condition is used for the velocity and a homogeneous Neumann boundary condition for the pressure is imposed. The time step is Δt* = 10−3. This value is chosen to ensure numerical stability and gives a Courant-Friedrichs-Lewy (CFL) number of 0.15.
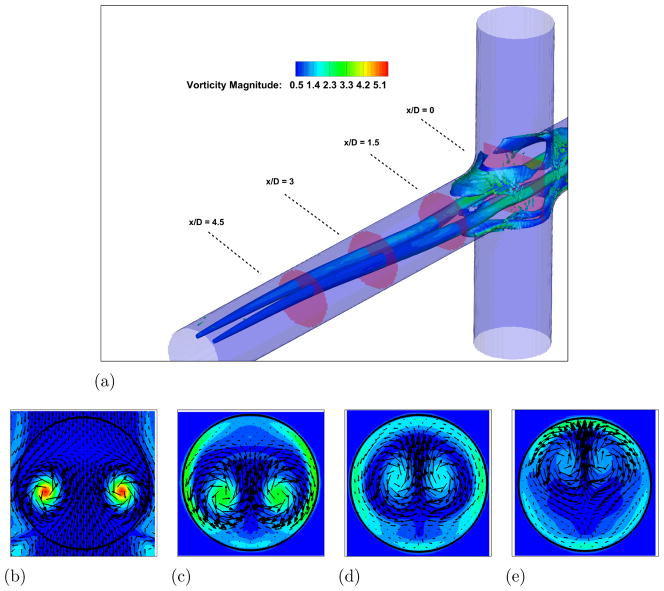
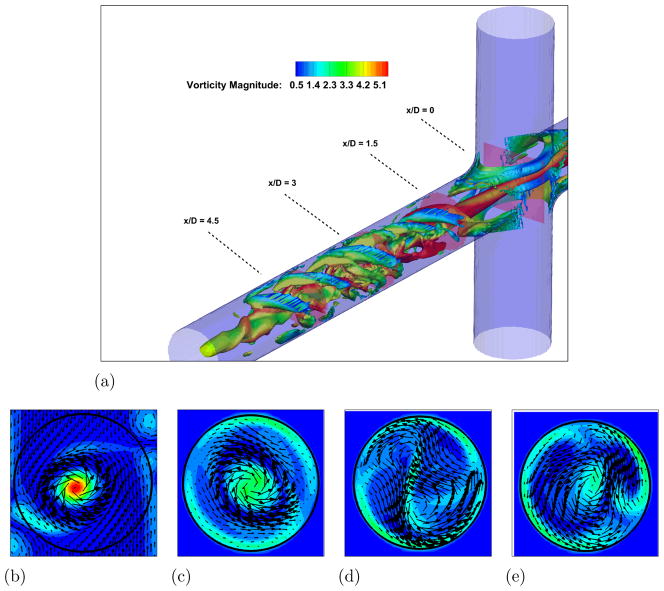
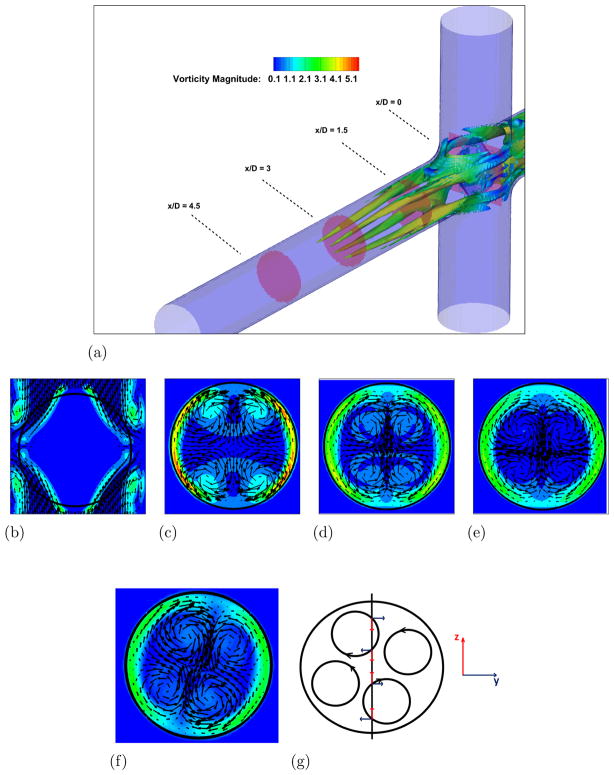
In order to understand the complex flow structures associated with Fontan hemodynamics, a case without the VIP is considered first. A snapshot from the simulation showing vortical structures depicted by the negative second eigenvalue of the velocity gradient tensor (Jeong and Hussain, 1994) and colored by vorticity magnitude, is shown in Fig. 3-a. Two long vortical structures are clearly visible throughout the PA. Four PA axial slices showing vorticy magnitude contours with velocity vectors superimposed are shown in Fig. 3-b to e and clearly confirm this flow feature. Animations from this simulation show that these two vortices are unstable and interact with each other to produce a single vortex with significant increase in vorticity magnitude. Evidence for this can be seen from a similar set of plots shown in Fig. 4 at a later time in the simulation. When the two vortices interact and eventually merge, they produce a single stronger vortex and many additional small scale vortical structures form during the breakup of the single vortex. The presence of the strong vortex enhances the mixing at the connection, which is crucial to ensure a correct hepatic factor distribution between the two lungs. On the other hand, a too powerful vortex might induce high stresses resulting in high blood damage.
Figure 3. Unpowered Fontan hemodynamics: t = 3.5s.
Figure 3a: Iso-surface of λ2 (λ2 = −25) colored by vorticity magnitude
Figure 3b: Velocity vectors and vorticity magnitude, x/D = 0.0
Figure 3c: Velocity vectors and vorticity magnitude, x/D = 1.5
Figure 3d: Velocity vectors and vorticity magnitude, x/D = 3.0
Figure 3e: Velocity vectors and vorticity magnitude, x/D = 4.5
Figure 4. Unpowered Fontan hemodynamics: t = 9.0s.
Figure 4a: Iso-surface of λ2 (λ2 = −25) colored by vorticity magnitude
Figure 4b: Velocity vectors and vorticity magnitude, x/D = 0.0
Figure 4c: Velocity vectors and vorticity magnitude, x/D = 1.5
Figure 4d: Velocity vectors and vorticity magnitude, x/D = 3.0
Figure 4d: Velocity vectors and vorticity magnitude, x/D = 4.5
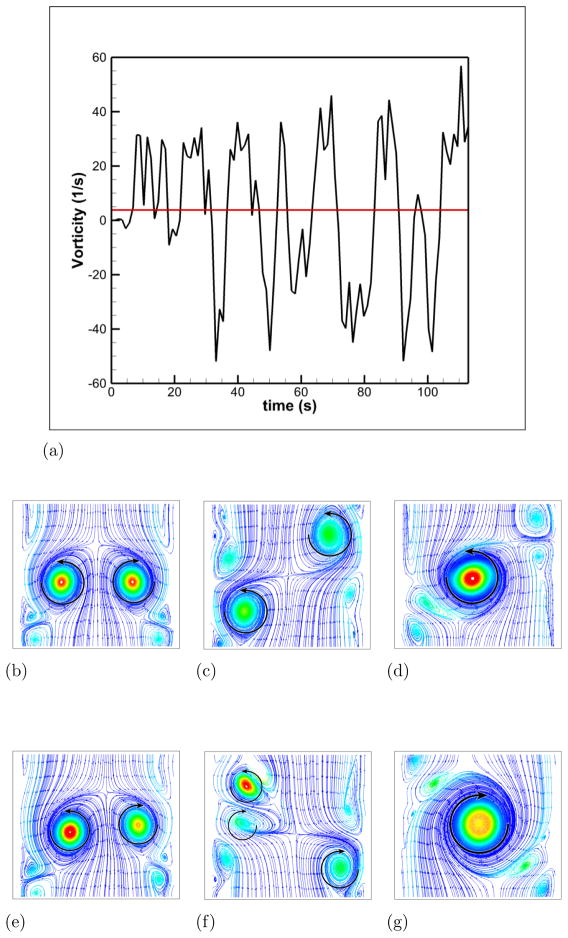
To facilitate comparisons to the SPIV measurements, mean (time-averaged over 30 flow through times) velocity profiles are extracted at five different locations in the RPA (see Fig. 2-b). Those profiles are extracted at the center plane y = 0 and at x = 0.5, 1, 1.5, 2 and 2.5 in the RPA, and comparisons between LES and PIV are sown in Fig. 5. Excellent quantitative agreement is obtained for the x– and z–components of the velocity. The average deviation from the experiments is 0.015 m/s for the x–component (0.056 m/s maximal deviation) and 0.016 m/s for the z–component (0.027 m/s maximal deviation). The y–component of the velocity obtained numerically and which is perpendicular to both the PA’s and the VC’s shows a flat profile with a near zero value. It appears to not be in agreement with the measured profiles. This can be explained as follows: animations from these simulations show that the rotational direction of the vortices in the PA changes sign during the simulation. A series of snapshots clearly depicting this phenomena are shown in Fig. 6-b to g. This is similar to the phenomena of swirl switching as it relates to the low frequency oscillations of Dean vortices in turbulent pipe bend flows (Rutten et al., 2005). This effect can also be seen in Fig. 6-a showing the time evolution of the x–component of the vorticity spatially averaged over a cube of non-dimensional length 0.25 centered at the TCPC junction (x = y = z = 0) together with its time averaged value. The oscillatory sign change of the vorticity is obvious from this plot as well as the near zero average value. The SPIV data that is used to compute the mean velocity profiles is obtained from 2 different SPIV windows in the PA and are extracted over different time periods. Hence, Fig. 5 shows profiles with clockwise as well as counter-clockwise rotation in qualitative agreement with the phenomena observed in the simulations.
Figure 5. Comparison of Unpowered Fontan Hemodynamics results between LES (line) and SPIV (dots).
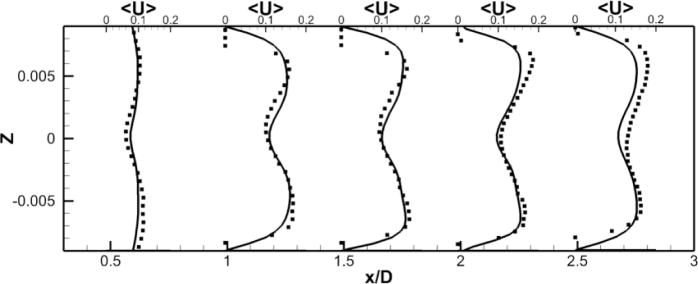
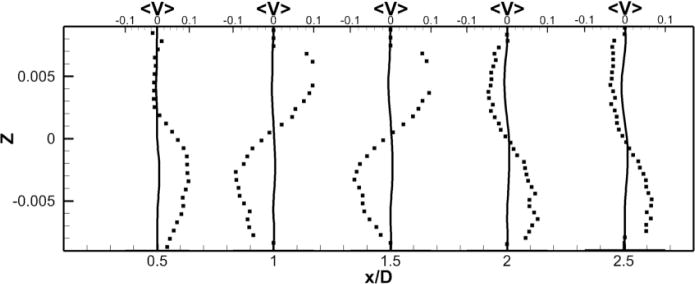
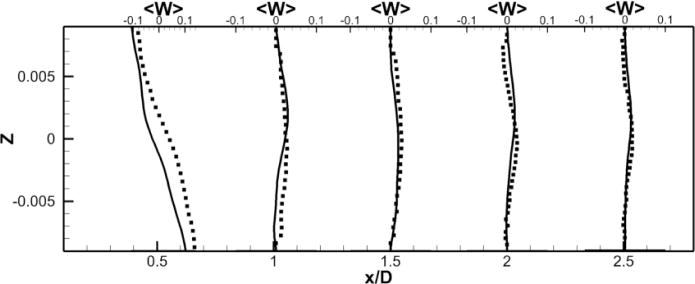
Figure 5a: Mean X component of the velocity
Figure 5b: Mean Y component of the velocity
Figure 5c: Mean Z component of the velocity
Figure 6. Illustration of the swirl switching phenomena.
Figure 6a: Evolution of the vorticity at the junction of the TCPC as a function of time. The red line represents the time averaged value
Figure 6b: Streamlines colored by vorticity magnitude at the plane x = 0, t = 3.5s
Figure 6c: Streamlines colored by vorticity magnitude at the plane x = 0, t = 8.0s
Figure 6d: Streamlines colored by vorticity magnitude at the plane x = 0, t = 9.0s
Figure 6e: Streamlines colored by vorticity magnitude at the plane x = 0, t = 32.0s
Figure 6f: Streamlines colored by vorticity magnitude at the plane x = 0, t = 33.0s
Figure 6g: Streamlines colored by vorticity magnitude at the plane x = 0, t = 34.0s
3.4. LES of powered Fontan hemodynamics
In this section, LES results are presented with the VIP centered at the TCPC junction. The VIP concept is inspired by the Von Karman viscous pump principle (Panton, 2005) and the current design resembles a double-sided cone with six mild vanes (Kennington et al., 2011). The height of the pump is 17.6 mm and its maximum diameter is 20.3 mm. Fig. 2 shows the position of the pump in the TCPC. In practice, the VIP will be inserted via a catheter through a femoral vein or jugular vein, positioned at the TCPC junction and deployed by a novel expandable design currently under development. The VIP will be powered by an external electromagnetic motor. Kerlo et al. (2011) show the hydraulic performances (difference of pressure between the VCs and the PAs) of the VIP over a range of flow rates and rotation rates. The VIP provides the desired pressure rise for the selected rotation rates, with a relatively flat profile over the range of flow rates. This predicts stable performance over a wide range of physiological conditions. The operating conditions for the pump are between 2000 RPM and 5000 RPM (up to 7000 RPM if needed). LES results are first presented for the not rotating VIP case (static) in order to simulate failure mode and then for the rotating VIP cases at 1000 and 2000 RPM. Comparisons to measurements are also presented. The profiles for the following case are extracted at the center plane y = 0 and at x = 0.8, 1.2, 1.6 and 2 to match the locations of extracted data from the experiments.
3.4.1. Static case
Instantaneous flow features, similar to that already shown in Fig. 3, are shown in Fig. 7. Four vortical structures are clearly discerned over about half of the extent of the PA’s. These resemble the Dean’s vortices associated with flow through a pipe bend, as the TCPC and the static VIP form a curved passage from the VC’s to the PA’s. Unlike the no pump case, these vortices are highly stable and animations only show a slight oscillation of the location of the four vortices. The vorticity magnitude is also much lower compared to the no VIP case.
Figure 7. Powered Fontan hemodynamics: static VIP.
Figure 7a: Iso-surface of λ2 (λ2 = −25) colored by vorticity magnitude
Figure 7b: Velocity vectors and vorticity magnitude, x/D = 0.0
Figure 7c: Velocity vectors and vorticity magnitude, x/D = 1.5
Figure 7d: Velocity vectors and vorticity magnitude, x/D = 3.0
Figure 7e: Velocity vectors and vorticity magnitude, x/D = 4.5
Figure 7f: Velocity vectors and vorticity magnitude, x/D = 3.0, t = 74s
Figure 7g: Schematic highlighting v and w patterns for static VIP case
A comparison between the LES predictions and the SPIV measurements for the mean velocity profiles are shown in Fig. 8. Agreement is not as good as for the no pump case but still reasonable both qualitatively and quantitatively. The mean deviation is 0.03 m/s for all components and the averaged maximal deviation is around 0.08 m/s. The pattern of the out of plane velocity component can be explained by the fact that, as we move forward in time, the four vortices in the PA slowly rotates but stay stable (fig. 7-f). Fig. 7-g shows a schematic of the four vortices, with a black line representing the location where the data are extracted. From this schematic, we can visualize the positive/negative/positive/negative pattern of the y–component of the velocity, as well as the negative/positive pattern of the z–component of the velocity. Fig. 8 shows that the LES simulation is able to capture qualitatively the flow physics; only the magnitude of the velocity components at these particular locations are off.
Figure 8. Comparison of powered Fontan hemodynamics results between LES (line) and SPIV (dots) (static VIP).
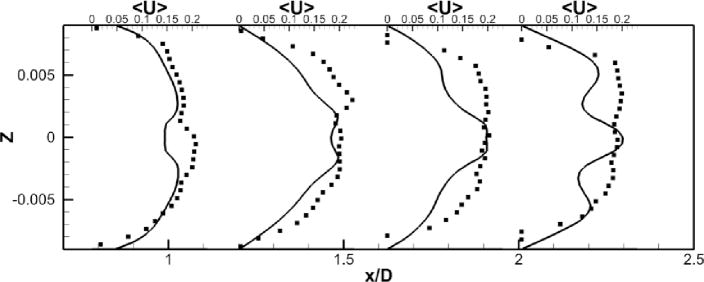
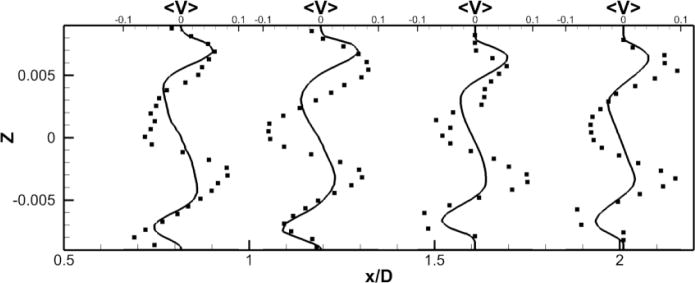
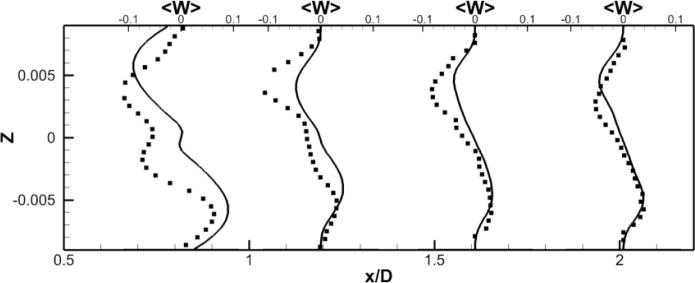
Figure 8a: Mean X component of the velocity
Figure 8b: Mean Y component of the velocity
Figure 8c: Mean Z component of the velocity
3.4.2. Rotating cases
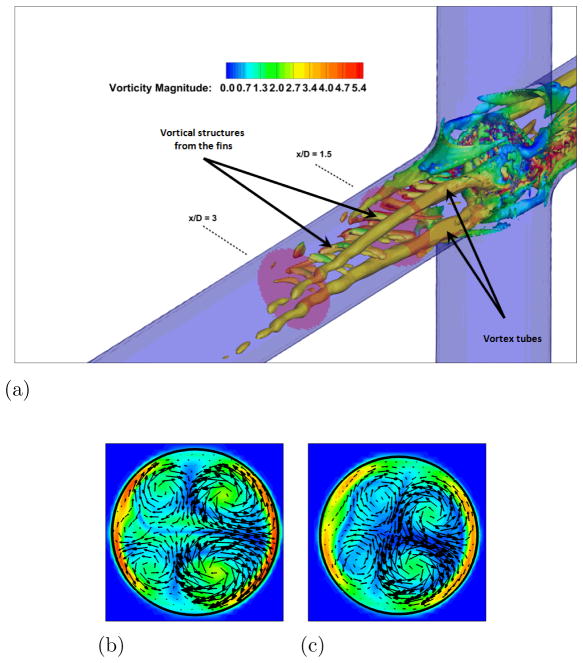
LES results for powered Fontan hemodynamics are shown in Fig. 9. The simulations are run using Δt* = 5×10⁻⁴ for the case at 1000 RPM and Δt* = 2.5×10⁻⁴ for the case at 2000 RPM to capture accurately the motion of the pump and maintain a low CFL number for stability (0.3). Two small vortical structures filling half of the PA on both sides of the TCPC junction are observed. Also, smaller discrete vortical structure emanating from the impeller are observed and are thought to be associated with shedding from the VIP blades. Those small structures are being convected downstream of the pump by the mean flow. The flow near the pump is highly turbulent with a high vorticity magnitude. Further downstream, free flow interactions (vortex shedding) appear. A comparison between the LES predictions and the SPIV measurements for the mean velocity profiles are shown in Figs. 10 and 11. Reasonable qualitative and quantitative agreement is observed. The mean deviation is about 0.045 m/s for both cases, with an averaged maximal deviation of 0.15 m/s. Both LES and experiments show a peak of the axial velocity at the centerline that can be explained by the geometry of the VIP. At 1000 RPM, we observe no recirculating flow near the pump (no negative axial velocity profiles). The effect of the pump on the flow field dissipates quicker for the experiments than for the LES. Indeed, the amplitudes of the oscillations decrease more as we move in the PA for the SPIV measurements than for the LES simulation. On the other hand, at 2000 RPM, LES is not capable of predicting the recirculation close to the pump that is measured by the experiments. Even though LES and experiments show reasonable agreements, we have to move away from the pump to observe a better match between numerical and experimental results. This may be due to the resolution of the grid that seems to be not high enough to fully capture the geometry and the motion of the VIP.
Figure 9. Powered Fontan hemodynamics: VIP at 2000 RPM.
Figure 9a: Iso-surface of λ2 (λ2 = −25) colored by vorticity magnitude, VIP at 2000 RPM
Figure 9b: Velocity vectors and vorticity magnitude, x/D = 1.5
Figure 9c: Velocity vectors and vorticity magnitude, x/D = 3.0
Figure 10. Comparison of Powered Fontan Hemodynamics results between LES (line) and SPIV (dots) (1000RPM).
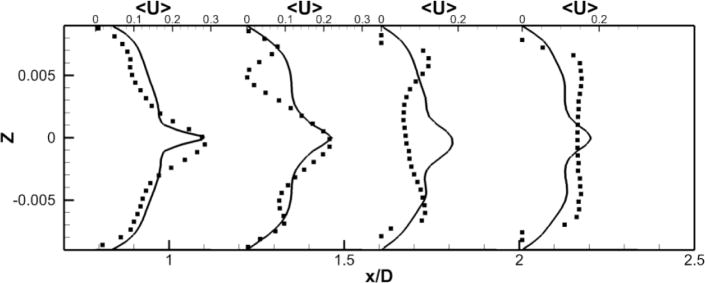
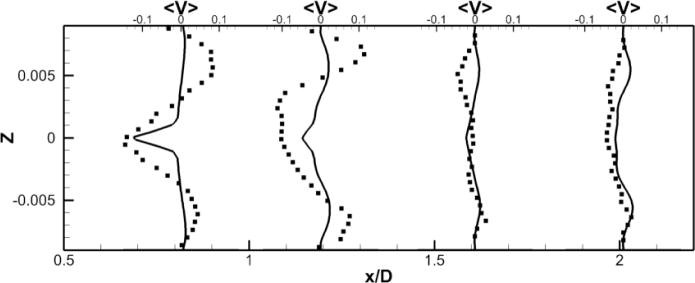
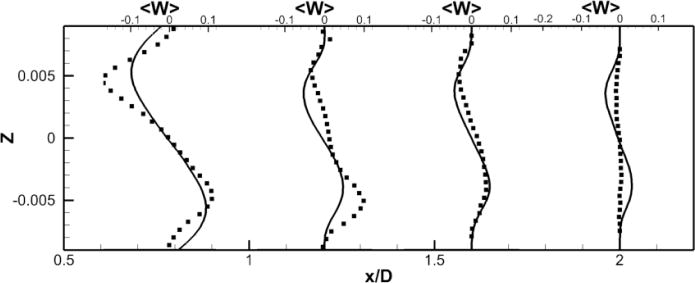
Figure 10a: Mean X component of the velocity
Figure 10b: Mean Y component of the velocity
Figure 10c: Mean Z component of the velocity
Figure 11. Comparison of Powered Fontan Hemodynamics results between LES (line) and SPIV (dots) (2000 RPM).
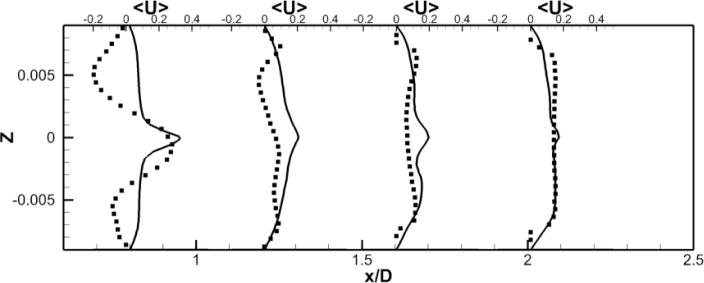
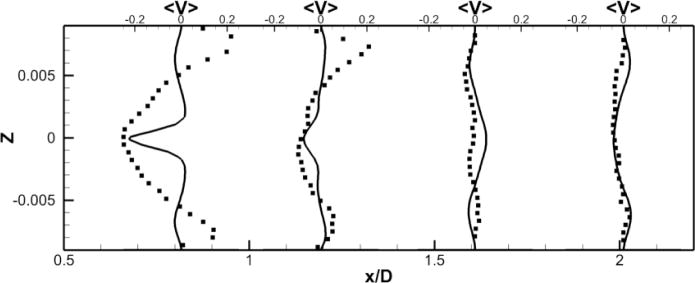
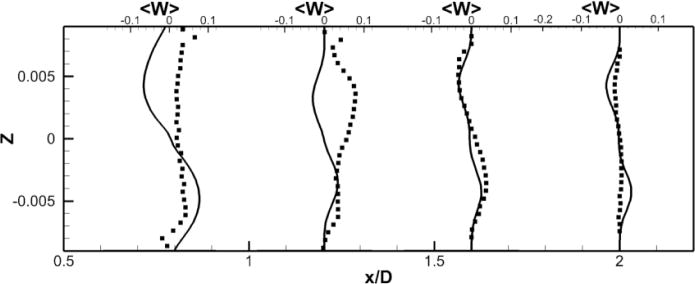
Figure 11a: Mean X component of the velocity
Figure 11b: Mean Y component of the velocity
Figure 11c: Mean Z component of the velocity
3.5. Flow and Wall Shear Stress
Flow and wall shear stresses (WSS) associated with medical device hemodynamics are important as they related to blood damage predictions especially hemolysis and thrombosis. High stress levels can damage red blood cells and result in hemolysis and low stress levels are often associated with flow status and thrombosis. In this section, wall shear stress on the TCPC vessel walls and scalar stress on the VIP surface are presented. The wall shear stresses are computed following the method presented by Mark and van Wachem (2008) and the scalar stress distribution is computed using equations 19 and 20 (Bludszuweit, 1995):
| (19) |
| (20) |
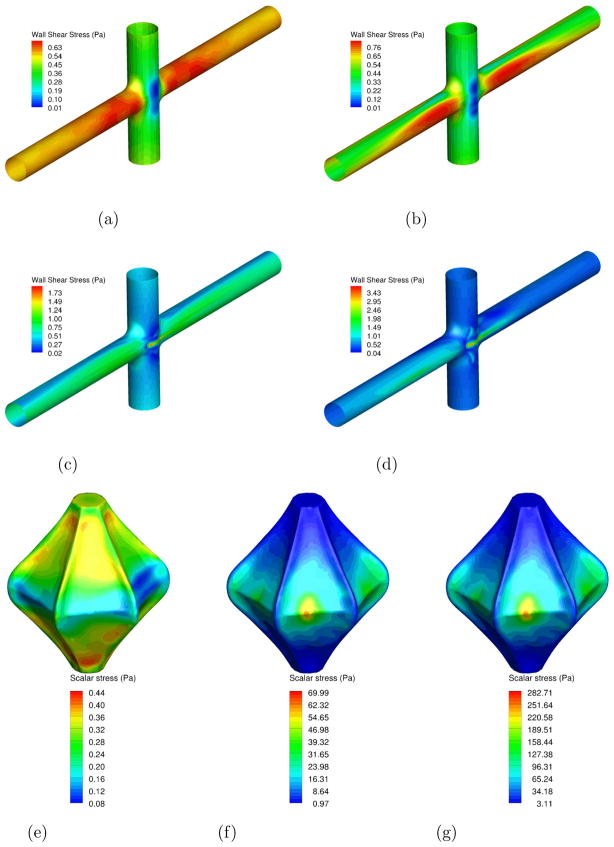
A comparison of WSS for all cases is presented in Fig. 12-a to d. For the no VIP case and the static VIP case, the wall shear stresses are low at the junction and the highest (0.7 Pa) at the entry of the PAs. When the pump is rotating, the maximum value of the wall shear stress (1.8 Pa at 1000 RPM and 3.5 Pa at 2000 RPM) increases and is located close to the pump, where the distance between the fins and the blood vessels is the smallest.
Figure 12. Wall shear stress on the blood vessels (a–d) and scalar stress on the VIP wall (e–g).
Figure 12a: No pump
Figure 12b: Static pump
Figure 12c: Pump at 1000 RPM
Figure 12d: Pump at 2000 RPM
Figure 12e: Static pump
Figure 12f: Pump at 1000 RPM
Figure 12g: Pump at 2000 RPM
Fig. 12-e to g show the scalar stress distribution on the VIP wall. It is generally accepted that a maximum value of 450 Pa is allowed to prevent the damage of blood cells (Paul et al., 2003). The scalar stress on the static pump are very low (less than 0.5 Pa) which is a good indicator that in case of failure of the VIP to rotate, the presence of the VIP will not harm the blood. When the VIP is rotating, the maximum value observed is less than 70 Pa (respectively 300 Pa) at 1000 RPM (respectively 2000 RPM). For both cases, these values are below the maximum allowed scalar stress.
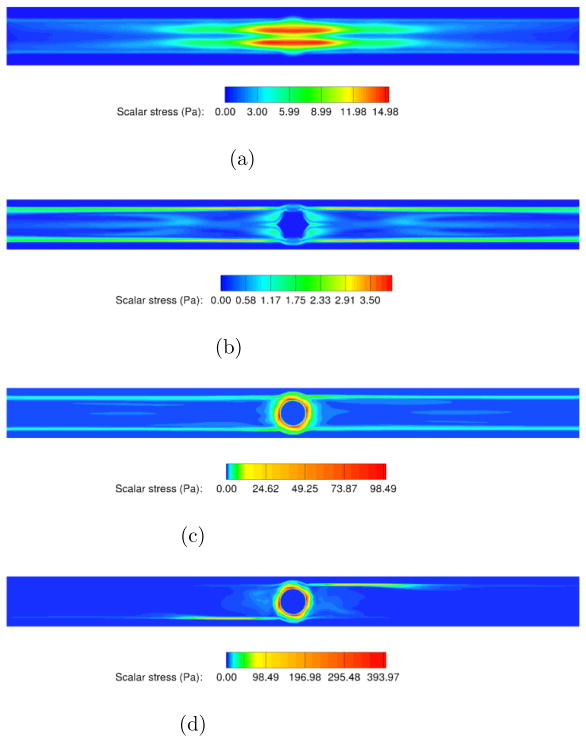
Fig. 13 shows the repartition of the scalar stress in the TCPC at the plane z = 0 for all the studied cases. All four figures present scalar stresses well below the limit allowed (less than 15Pa, 4 Pa, 100 Pa and 400 Pa for the no VIP case, static VIP case, VIP at 1000 RPM and VIP at 2000 RPM respectively). It is observed that the presence of the static VIP decreases the scalar stresses on the blood by 70%. The rotating VIP induces higher scalar stresses localized close the pump walls. For those cases, the stresses drop rapidly downstream of the pump. After 1 diameter away from the VIP, the stresses reach values of the same order of magnitude as the no VIP case.
Figure 13. Fluid Scalar Stresses inside the TCPC.
Figure 13a: No pump
Figure 13b: Static pump
Figure 13c: Pump at 1000 RPM
Figure 13d: Pump at 2000 RPM
3.6. Limitations
In LES, grid independence is related to sufficient resolution of the large-scale (filtered) flow field for a given filter width. While this was demonstrated for the TCPC simulations without the pump, this has not yet been demonstrated for the case with the pump. This could explain the lack of agreement between the LES and the PIV measurements for the case of the rotating VIP. Within the current code framework a significant number of grid points are located outside of the fluid domain in the single block computational domain. Efforts are underway to develop a multi block version of this code to minimize wasted grid and facilitate finer resolution near the pump in future studies.
4. Conclusion
The Fontan circulation is currently the only way to palliate children born with one ventricle. Yet, serious challenges remain. We propose here a novel solution to increase the pressure step-up between the VC and PA to restore biventricular physiology to patients with univentricular anatomy. Understanding the hemodynamics of such a circulation is crucial to optimize the TCPC geometry and reduce the pressure loss. Due to the complex flow features induced by both the TCPC and the VIP, a high order LES code has been developed. Non assisted Fontan simulations show good agreement with experiments and reveal an interesting swirl switching phenomenon due to the instabilities of the two confined impinging jets. The static VIP case shows that the VIP does not obstruct the Fontan flow path and instead acts as a flow diverter decreasing the turbulence and instabilities of the flow in the PAs. The rotating VIP cases show reasonable qualitative agreement between LES and SPIV. The lack of resolution around the VIP is probably responsible for the discrepancies observed. Ongoing efforts focus on studying patient specific geometries for TCPC with more realistic boundary conditions using a lumped parameter model. Other efforts include studying blood damage using particle tracking and hepatic factor distribution in the PAs using scalar mixing.
Acknowledgments
The authors will like to acknowledge financial support for this work by the National Institute of Health (NIH) (grant no HL098353).
Footnotes
6. Conflict of interest statement
This statement is to declare that we, the authors of manuscript “Large Eddy Simulation of Powered Fontan Hemodynamics” do not possess any financial relationships that might bias our work. We hereby declare that no conflict of interest exists in our work.
Publisher's Disclaimer: This is a PDF file of an unedited manuscript that has been accepted for publication. As a service to our customers we are providing this early version of the manuscript. The manuscript will undergo copyediting, typesetting, and review of the resulting proof before it is published in its final citable form. Please note that during the production process errors may be discovered which could affect the content, and all legal disclaimers that apply to the journal pertain.
References
- Adams J. 1999 http://www2.cisl.ucar.edu/resources/legacy/mudpack.
- Bludszuweit C. Three dimensional numerical prediction of stress loading of blood particles in a centrifugal pump. Artificial Organs. 1995;19:590–596. doi: 10.1111/j.1525-1594.1995.tb02386.x. [DOI] [PubMed] [Google Scholar]
- Deleval M. The fontan circulation: What have we learned? what to expect? Pediatric Cardiology. 1998;19:316–320. doi: 10.1007/s002469900315. [DOI] [PubMed] [Google Scholar]
- Gewillig M. The fontan circulation. Congenital Heart Disease. 2005;91:839–846. doi: 10.1136/hrt.2004.051789. [DOI] [PMC free article] [PubMed] [Google Scholar]
- Giridharan G, Koenig S, Kennington J, Sobieski M, Chen J, Frankel S, Rodefeld M. Performance evaluation of a pediatric viscous impeller pump for fontan cavopulmonary assist. The Journal of Thoracic and Cardiovascular Surgery. 2012 doi: 10.1016/j.jtcvs.2012.01.082. [DOI] [PMC free article] [PubMed] [Google Scholar]
- Jeong J, Hussain F. On the identification of a vortex. Journal of Fluid Mechanics. 1994;285:69–94. [Google Scholar]
- Johnson T, Patel V. Flow past a sphere up to a reynolds number of 300. Journal of Fluid Mechanics. 1999;378:19–70. [Google Scholar]
- Kennington J, Frankel S, Chen J, Koenig S, Sobieski M, Giridharan G, Rodefeld M. Design optimization and performance studies of an adult scale viscous impeller pump for powered fontan in an idealized total cavopulmonary connection. Cardiovascular Engineering and Technology. 2011;2:237–343. [Google Scholar]
- Kerlo AE, Kennington J, Xu D, Frankel S, Giridharan G, Rodefeld M, Chen J. Experimental study of powered fontan hemodynamics in idealized total cavopulmonary connection model. 11th International Conference on Fluid Control, Measurements and Visualization..2011. [Google Scholar]
- Mark A, van Wachem B. Derivation and validation of a novel implicit second order accurate immersed boundary method. Journal of Computational Physics. 2008;227:6660–6680. [Google Scholar]
- Marsden A, Bernstein A, Reddy M, Shadden S, Spilker R, Chan F, Taylor C, Feinstein J. Evaluation of a novel y-shaped extracardiac fontan baffle using computational fluid dynamics. The Journal of Thoracic and Cardiovascular Surgery. 2009;137:394–403. doi: 10.1016/j.jtcvs.2008.06.043. [DOI] [PubMed] [Google Scholar]
- Migliavacca F, Dubini G, Bove E, deLeval M. Computational fluid dynamics simulations in realistic 3d geometries of the total cavopulmonary anastomosis: the influence of the inferior caval anastomosis. Journal of Biomechanical Engineering. 2003;805:805–813. doi: 10.1115/1.1632523. [DOI] [PubMed] [Google Scholar]
- OMP. 2012 www.openmp.org/wp.
- Panton R. Incompressible Flow. John Wiley and Sons, Inc; 2005. [Google Scholar]
- Paul R, Apel J, Klaus S, Schugner F, Schwindke P, Reul H. Shear stress related blood damage in laminar couette flow. Artificial Organs. 2003;27:517–529. doi: 10.1046/j.1525-1594.2003.07103.x. [DOI] [PubMed] [Google Scholar]
- Pope S. Turbulent Flows. Cambridge University Press; 2000. [Google Scholar]
- Rodefeld M, Boyd J, Myers C, Lalone B, Bezruczko A, Potter A, Brown J. Cavopulmonary assist: Circulatory support for the univenricular fontan circulation. Annals of Thoracic Surgery. 2003;76:1911–1916. doi: 10.1016/s0003-4975(03)01014-2. [DOI] [PubMed] [Google Scholar]
- Rodefeld M, Coats B, Fisher T, Giridharan G, Chen J, Brown J, Frankel S. Cavopulmonary assist for the univentricular fontan circulation: Von karman viscous impeller pump. The Journal of Thoracic and Cardiovascular Surgery. 2010;140 doi: 10.1016/j.jtcvs.2010.04.037. [DOI] [PMC free article] [PubMed] [Google Scholar]
- Rutten F, Schroder W, Meinke M. Large-eddy simulation of low frequency oscillations of the dean vortices in turbulent pipe bend flows. Physics of Fluids. 2005;17 [Google Scholar]
- Shetty D, Fisher T, Chunekar A, Frankel S. High order incompressible large eddy simulation of fully inhomogeneous turbulent flows. Journal of Computational Physics. 2010;229:8802–8822. [Google Scholar]
- Shetty D, Jie S, Chandy A, Frankel S. A pressure correction scheme for rotational navier stokes equations and its application to rotating turbulnet flows. Communications in Computational Physics. 2011;9:740–755. [Google Scholar]
- Soerensen D, Pekkan K, de Zelicourt D, Sharma S, Kanter K, Fogel M, Yoganathan A. Introduction of a new optimized total cavopulmonary connection. The Annals of Thoracic Surgery. 2007;83:2182–2190. doi: 10.1016/j.athoracsur.2006.12.079. [DOI] [PubMed] [Google Scholar]
- Stewart S, Patterson E, Burgreen G, Hariharan P, Giarra M, Reddy V, Day S, Manning K, Deutsch S, Berman M, Myers M, Malinauskas R. Assessment of cfd performance in simulations of an idealized medical device: Results of fda’s first computational interlaboratory study. Cardiovascular Engineering and Technology 2012 [Google Scholar]
- Throckmorton A, Ballman K, Myers C, Litwak K, Frankel S, Rodefeld M. Mechanical cavopulmonary assist for the univentricular fontan circulation using a novel folding propeller blood pump. American Society of Artificial Internal Organs. 2007;53:734–741. doi: 10.1097/MAT.0b013e318159d14b. [DOI] [PubMed] [Google Scholar]
- Vreman A. An eddy-viscosity subgrid-scale model for turbulent shear flow: algebraic theory and applications. Physics of Fluids. 2004;16:3670–3681. [Google Scholar]
- Zelicourt D, Marsden A, Fogel M, Yogonathan A. Imaging and patient specific simulations for the fontan surgery: Current methodologies and clinical applications. Progress in Pediatric Cardiology. 2010;30:31–44. doi: 10.1016/j.ppedcard.2010.09.005. [DOI] [PMC free article] [PubMed] [Google Scholar]
- Zhang J, Jackson T. A high order incompressible flow solver with weno. Journal of Computational Physics. 2009;228:2426–2442. [Google Scholar]


