Abstract
Bridges implanted into the injured spinal cord function to stabilize the injury, while also supporting and directing axon growth. The architecture of the bridge is critical to its function, with pores to support cell infiltration that integrates the implant with the host and channels to direct axon elongation. Here, we developed a sucrose fiber template to create poly(lactide-co-glycolide) multiple channel bridges for implantation into a lateral hemisection that had a 3-fold increase in channel number relative to previous bridges and an overall porosity ranging from approximately 70% to 90%. Following implantation into rat and mouse models, axons were observed within channels for all conditions. The axon density within the bridge increased nearly 7-fold relative to previous bridges with fewer channels. Furthermore, increasing the bridge porosity substantially increased the number of axons, which correlated with the extent of cell infiltration throughout the bridge. Analysis of these cell types identified an increased presence of mature oligodendrocytes within the bridge at higher porosities. These results demonstrate that channels and bridge porosity influence the re-growth of axons through the injury. These bridges provide a platform technology capable of being combined with the delivery of regenerative factors for the ultimate goal of achieving functional recovery.
Introduction
Spontaneous regeneration of the spinal cord is limited by numerous factors from the injury that are generally described as an insufficient supply of growth promoting stimuli and an abundance of growth inhibitors. Cells at the injury site are induced to secrete cytokines that recruit macrophages and immune cells as well as promote the migration of progenitors and myelinating cells. Macrophages function to clear debris that would otherwise inhibit the extension of regenerating axons; however, they also secrete cytokines that induce gliosis in astrocytes [1,2]. These activated astrocytes then influence the differentiation of recruited progenitor cells towards astrogenesis and gliosis rather than to mature oligodendrocytes that would re-myelinate spared axons to enhance their growth, survival, and conductance [3–6]. The accumulation of glial and fibrous scar tissue inhibits the extension of axons to and beyond the injury, as well as their myelination, which prevents the re-establishment of neural circuitry required for functional recovery [2]. Instead, the lack of functionality in regenerating neurons results in the demyelination and retraction of axons, a phenomenon known as Wallerian degeneration.
Biomaterial scaffolds implanted into the spinal cord are termed bridges, and they provide a central tool for modulating the local environment after spinal cord injury and facilitating nerve regeneration. Bridges with channels that span the length of the implant can provide and maintain a path for axon extension across an injury. In vitro, these aligned channels enhanced neural elongation compared to randomly-oriented interconnected pores [7]. Additionally, implantation of bridges with aligned channels orients cells within the channels that can direct axon extension [8] and enhances functional recovery after injury [9]. Previously, we reported on the development of porous, multiple channel poly(lactide-co-glycolide) (PLG) bridges. The combination of linear channels and interconnected pores in these bridges permitted the rapid ingrowth of cells in vivo to prevent the formation of cavities and stabilize the injury site. These infiltrating cells supported axon growth into and through the bridge, and a reduction in the presence of inflammatory cells was noted [8].
In this report, we investigated the role of bridge architecture, namely channels and porosity, in order to create a more permissive cellular environment for axon extension. Our gas foaming-based fabrication process was modified to include a sucrose fiber template that substantially increased the channel density allowing for the fabrication of bridges for both rat and mouse models and provided greater control over porosity in multiple channel PLG bridges. Using this fabrication method, we deconvoluted the influence of interconnected pores and channels on the cell types that occupy the bridge, as well as their impact on neurite extension into and through the bridge. Neurite density (neurofilaments per mm2) and cellular residency (defined as percent area following staining with a cell-specific antibody) in the bridge were quantified using an image transformation method applied to sections stained with 3,3-diaminobenzedine (DAB) as the chromagen. This method accurately differentiates DABpos from DABneg and hematoxylinpos areas, which has posed a challenge historically [10]. These studies investigated key design features of the bridge, which can be further developed to serve as a platform for promoting regeneration after spinal cord injury.
Materials and Methods
Multiple channel bridges
Bridges were fabricated using a combination of a gas foaming technique that was previous described [8,11] and a recently-developed sacrificial template technique [12]. PLG (75:25 ratio of D,L-lactide to L-glycolide, inherent viscosity: 0.76dL/g; Lakeshore Biomaterials, Birmingham, AL) was dissolved in dichloromethane (6% w/w) and emulsified in 1% poly(vinyl alcohol) using a homogenizer (PolyTron 3100; Kinematica AG, Littau, Switzerland) at 3000 rpm to create PLG microspheres. D-sucrose was caramelized at approximately 220 °C, cooled to appr oximately 103 °C, and drawn from the solution using a Pasteur pipette to create sugar fibers. The fibers were coated with a mixture of PLG microspheres and salt particles (63–106 µm) and placed into an aluminum mold lined with salt to ease removal. The materials were pressed together by hand and placed into a pressure vessel. The constructs were equilibrated at 800 psi CO2 for 12 hrs, with the pressure released at 60 psi/min. Bridges were then sectioned to the desired length, leached in distilled water for 2 hrs to remove the porogens, disinfected in ethanol for 2 min and dried overnight. All materials mentioned were from Fisher Scientific unless otherwise described. The final bridge dimensions were 3.8 mm in length, 2.5 mm in width, and 1.5 mm in height for the rat model, and 2.25 mm in length, 1.25 mm in width, and 0.75 mm in height for the mouse model. The channels were characterized by measuring the diameters of bridges (n = 6) acquired using light microscopy images (Leica Microsystems, Wetzlar, Germany) with ImageJ. The cross sectional area occupied by the channels and the porosities of these bridges were calculated using equations established previously [13,14]. Bridges were imaged using the Leo Gemini 1525 (Zentrum für Werkstoffanalytik Lauf, Pegnitz, Germany) at 10 kV after coating with osmium tetroxide.
Spinal cord injury
Animals were treated according the Animal Care and use Committee guidelines at Northwestern University. Surgery was performed as previously described (n = 4 per scaffold design and time-point for rats, n = 3 each for mice) [8,11]. Female Long-Evans rats (200g, Charles River) and female C57Bl6 mice (20g, Charles River) were anesthetized using isoflurane (2%). A laminectomy was performed at T9–T10 to allow for a 4 mm (rat) or a 2.25 mm (mouse) lateral hemisection for bridge implantation. The injury site was protected using Gelfoam and secured in place after suturing the muscles together and stapling the skin. Postoperative care included administration of Baytril (enrofloxacin 2.5 mg/kg, once a day for 2 weeks), buprenorphine (0.01 mg/kg for rats or 0.1 mg/kg for mice, twice a day for 3 days), and lactate ringer solution (5 mL/100 g, once a day for 5 days). Bladders were expressed twice daily until function recovered.
Immunohistochemstry
Bridges were implanted into the spinal cord for 2 or 8 weeks. Upon retrieval, bridges extracted from rats were frozen and sectioned transversally in 12 µm thick slices, and every third slice was collected serially. Bridges extracted from mice were frozen and sectioned transversally in 18 µm thick slices and collected serially. Sections from the middle of the bridge were fixed using 4% paraformaldehyde. To detect overall cell presence these sections were stained with eosin and counter-stained with Mayer’s hematoxylin (Surgipath Medical Industries). To detect myelin, sections were stained with 0.1% solution of luxol fast blue and counterstained with a 0.1% solution of cresyl violet. To detect type I and III collagen, sections were stained using a Masson’s trichrome kit (Polysciences, Warrington, PA).
Bridge sections from rats were stained using the following primary antibodies to detect neurites (Neurofilament-200/NF200, 1:5000 dilution), macrophages (ED-1/CD68, 1:1000 dilution; Chemicon), astrocytes (Glial fibrillary acidic protein/GFAP, 1:5000 dilution), fibroblasts (anti-rat prolyl 4-hydroxylase/rPH, 1:500; Acros Antibodies), Schwann cells (S-100β, 1:100), endothelial cells (anti-rat endothelial cell antigen-1/RECA-1, 1:150; AbD Serotec), and oligodendrocytes (RIP, 1:2500; Chemicon). To detect these antibodies, the vectastain Elite ABC kit (Vector Laboratories) was used with diaminobenzedine (DAB; Vector Laboratories) and counter-stained with Mayer’s hematoxylin. Bridges retrieved from mice were sectioned and stained using the following antibodies to detect neurites: Neurofilament 150/NF150 as the primary (MAB1621, 1:2000 dilution; Millipore) and anti-mouse IgG AlexaFluor 555 (1:1000, Invitrogen) as the secondary. All materials mentioned were from Sigma-Aldrich unless otherwise described. Images were captured at 40× or 20× for light or fluorescence microscopy (Leica Microsystems, Wetzlar, Germany).
Selection of DABpos areas
DAB-immunostained images (n = 17) were split into their color channels and were transformed into Normalized Red images using the equation Normalized Red = (R+G)/R, where R and G represent red and green channels respectively, and into Normalized Blue, Green/Blue, and Brown images using previously established equations [10]. DABpos areas of the transformed images were selected and compared to manual tracings. Three random fields of view from each image were traced by hand to quantify the misclassified pixels and area selections of transformed images, and their correlation to manual area analysis.
Cellular response
Immunostained samples at the middle of the implant site were imaged in 4 random fields of view. To quantify the neurite density in the bridges for a rat spinal cord injury model, a linear regression of DABpos area and neurofilament number from a training set (n = 17) correlated the selected area to the neurite density of regenerating neurons. For mouse, the neurite densities were assessed manually given their relatively small cross-sectional areas. The residency (percentage area that is positively stained) of S100β+, GFAP+, ED1+, and GFAP+ cells was quantified by selecting DABpos areas (black) thresholded manually. To quantify myelin content in the bridge, LFB-positive areas (blue) were selected, which become white in the transformed images.
Statistics
Multiple comparisons pairs were analyzed using a one-way ANOVA with a Bonferonni post-hoc test. Significance was defined at a level of p <0.05 unless otherwise noted.
Results
Bridge structure
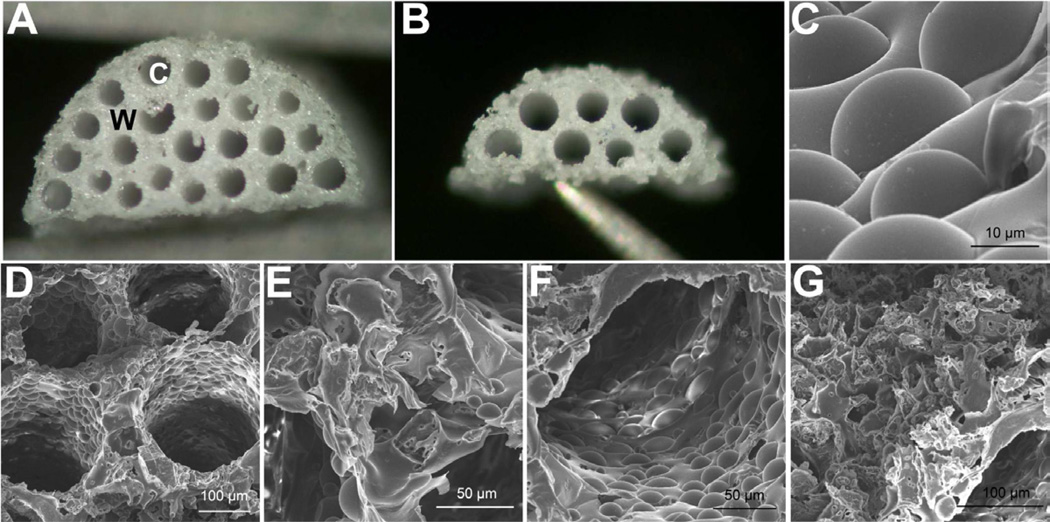
Bridges with a high density of channels were fabricated by adapting a previously established gas foaming/particulate leaching procedure to include caramelized sucrose fibers as a template for the channels [8,11–12]. Sucrose fibers were rolled in a mixture of PLG microspheres and salt crystals, and subsequently packed into a mold that is matched to the dimensions of a rat lateral hemisection. A total of 22 fibers could be packed within the mold, and the construct was subsequently foamed and immersed in water to remove the salt and sugar, and thereby, create a porous, multiple channel bridge (Fig. 1a). A similar procedure was employed to create bridges for a mouse lateral hemisection, which had 7 channels (Fig. 1b).
Fig. 1.
Multiple channel bridges with high density of channels and tunable porosity. Light microscopy image of bridge for (a) rat and (b) mouse spinal cord model, W = wall and C = channel. (c) Scanning electron microscopy (SEM) image revealing the micro-textured wall of the channel. (d) SEM image of multiple channels of the bridge. (e) SEM image indicating occasional voids between channels, and (f) occasional voids along the channel wall. (g) SEM image of porous bridge surface that will face the injured mid-line of the spinal cord.
The gas foaming, sugar template-based fabrication process at this channel size and density yields bridges with a minimum porosity of approximately 70%. The incorporation of salt with the PLG microspheres as an additional porogen increased the porosity to exceed 90% (Table 1). The average channel diameter was 234 ± 18 µm, consistent with the diameter of the sucrose fibers, which yielded a channel cross-sectional area exceeding 30% and 40% for bridges designed for the rat and mouse model respectively. Scanning electron microscopy revealed the microstructure resulting from the incorporation of both salt and sugar as porogens (Fig. 1c). The bridges have an interconnected pore network, as the polymer surrounding the channels has porosity resulting from the porogen and gas foaming processes (Figs. 1d–f).
Table 1.
Channel number and porosity for bridges.
| Channel (um) | Porosity | ||||||||
|---|---|---|---|---|---|---|---|---|---|
| No. | Diam. | SD | CSA*‡ | P: S‡ Ratio | Overall | SD | Wall * | ||
| 22 | 237.23 | 20.4 | 33.0% | 1:0 | 73.1% | 1.6% | 59.8% | ||
| Rat | 22 | 229.48 | 29.21 | 30.9% | 1:1 | 83.2% | 0.7% | 75.6% | Rat |
| 22 | 228.80 | 19.16 | 30.7% | 1:2 | 92.1% | 0.7% | 88.6% | ||
| Mouse | 7 | 231.57 | 5.21 | 40.0% | 5:2 | 82.3% | 2.1% | 70.4% | Mouse |
CSA = channel cross-sectional area, P:S = polymer-to-salt ratio.
CSA and wall porosity were calculated using overall porosity and channel diameter. Channel diameter was consistent in all bridges.
Axon elongation
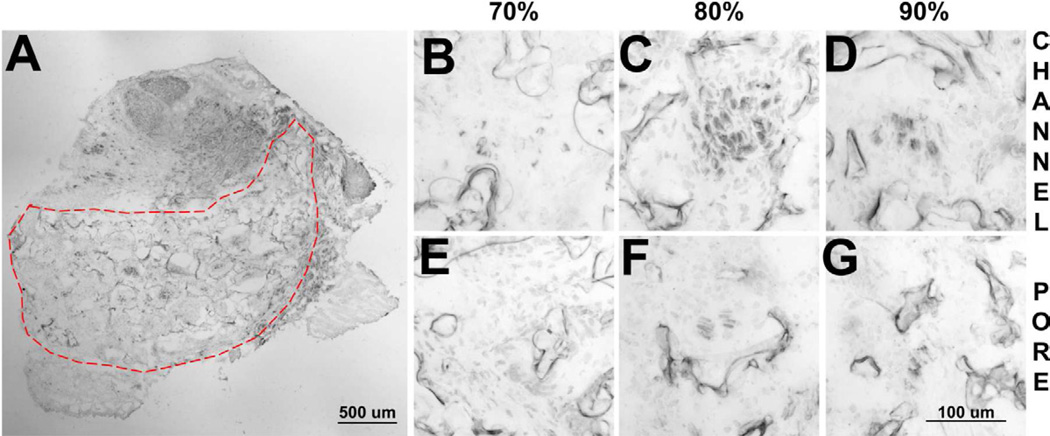
These bridges achieved robust neurite extension following implantation into the rat lateral hemisection at T10 (Fig. 2a). Neurites were present in the channels of the bridge at all porosities. Overall, the neurites in the channels were present near the polymer surface, and were not centralized in contrast to previous reports [12,15]. For the 70% porous bridges, the neurites were predominantly found as individual fibers (Fig. 2b). In contrast, neurites appeared to be organized into bundles in the bridges of higher porosities (Figs. 2c,d). Additionally, neurites were occasionally found in the pores of bridges with 80% and 90% porosities (Fig 2e–g). Neurites in the pores were typically centralized in distribution.
Fig. 2.
Neurite infiltration into bridges. (a) Transverse section of the bridge stained with antibodies to neurofilament-200 after 8 weeks implantation in a rat. Neurites present within the channels for (b) 70%, (c) 80%, and (d) 90% porous bridges. Images of the porous regions of bridges for (e) 70%, (f) 80%, and (g) 90% porous bridges.
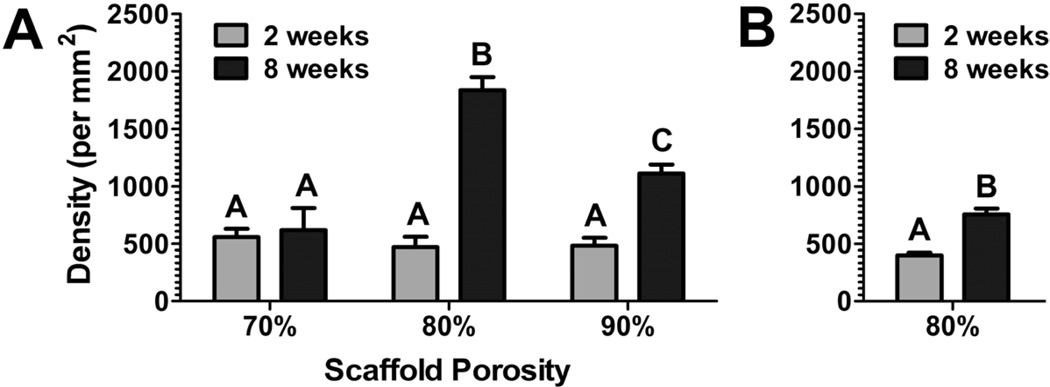
A semi-automated analysis technique for DAB-stained images was developed to characterize neurite density in the bridges. Normalized Red utilized red and green, the primary colors of DAB, to distinguish DABpos areas (black) from DABneg areas (white). DABpos areas in the Normalized Red image, which were selected with a color threshold, were demonstrated to be similar to areas traced manually (Fig. 3). Additionally, Normalized Red images superiorly distinguished these areas compared to other transformation methods (Supp. 1 and 2). The high correlation of DABpos stained area to the neurite density in these bridges (Pearson coefficient = 0.961) permitted semi-automated quantification of neurite density. Manual quantification (n = 4) validated neurite densities determined using the semi-automated method (Supp. 3). These bridges had similar densities in the middle of the bridge 2 weeks post implantation. At 8 weeks, the neurite density in 70% porous bridges did not change compared to its density at 2 weeks. In contrast, the neurite densities at 8 weeks in the more porous bridges were significantly greater, with the 90% and 80% porous bridges doubling and tripling their 2-week densities, respectively (Fig. 4a). Neurite densities in 80% porous mouse bridges at 2 weeks after implantation were similar to bridges implanted into a rat hemisection lesion. After 8 weeks the neurite density increased, doubling its 2-week density (Fig. 4b).
Fig. 3.
DAB selection in hematoxylin-counterstained images using the Normalized Red transformation method that converts the brown (DAB) in the original image to black, blue (hematoxylin) to white-grey, and background to grey. (a) Original DAB-hematoxylin image. (b) Transformed image reveals its ability to reproduce features in the original image. (c) DABpos areas were manually traced to compare the accuracy of automated selection. (d) Color-threshold of the transformed image selects DABpos areas similarly to manual trace. (e) Selections correlate to manual tracings at a range of DABpos areas. (f) These selections do not deviate from manual tracings in this range.
Fig. 4.
(a) Neurite density for porous bridges (70, 80, and 90% porosity) implanted into a rat hemisection lesion for retrieval at 2 and 8 weeks. (b) Neurite density for porous bridges (80% porosity) implanted into a mouse hemisection lesion, with retrieval at 2 and 8 weeks.
Cellular residency
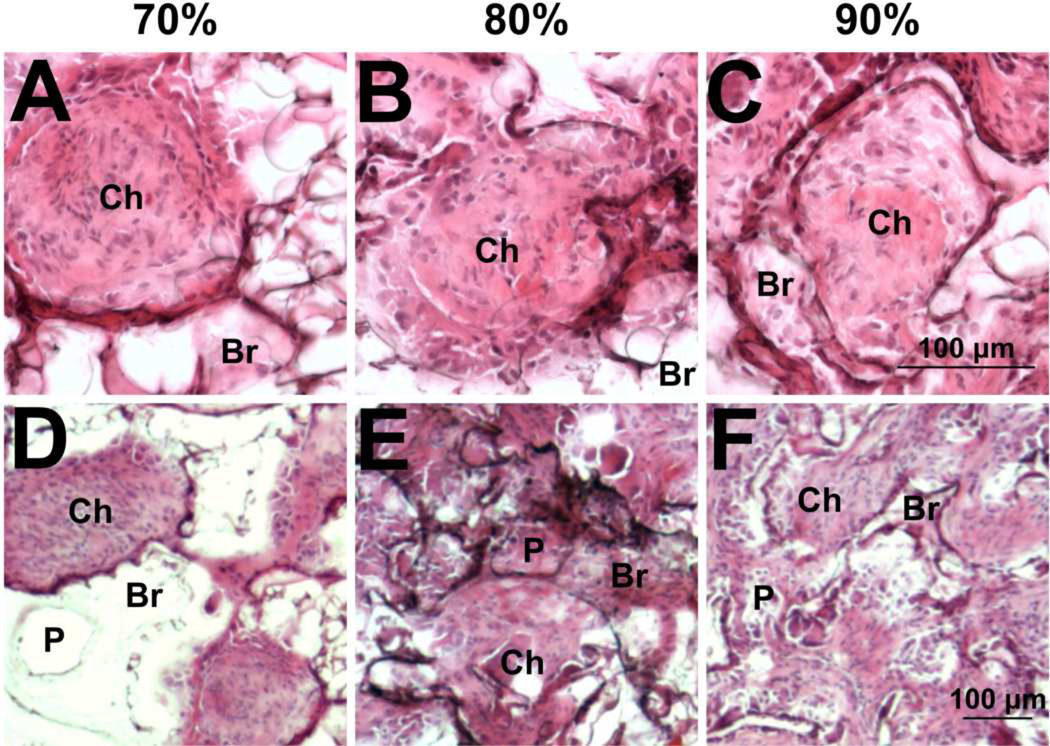
We subsequently investigated the distribution and identity of infiltrating cells as a mechanism contributing to the increased density of neurites in the channels at greater porosities. Analysis of tissue sections from bridges implanted into injured rat spinal cords revealed robust cell infiltration through the channels (Ch) of all bridges after 2 weeks implantation (Fig. 5a–c). The bridges were intact, apposed well to the adjacent tissue, and maintained their structure without signs of collapse. However, in the least porous bridges, few cells were observed within the porous polymer region between the channels (bridge walls, Br), likely due to the lack of interconnected pores (P) (Fig. 5d). In contrast, cells were observed within the walls between the channels in both the 80% and 90% porous bridges (Figs. 5e,f). Additionally, the most porous bridge had thinner channel walls, which may have enhanced cell infiltration.
Fig. 5.
Cell infiltration analyzed by hematoxylin and eosin staining. Infiltrating cells completely fill the channels (denoted by Ch) at (a, d) 70%, (b,e) 80%, and (c,f) 90% porosity at 2 weeks. Representative images that focus on channels (a–c) and the pores of the bridge (d–f). Bridge walls are denoted by Br. Pores are denoted by P.
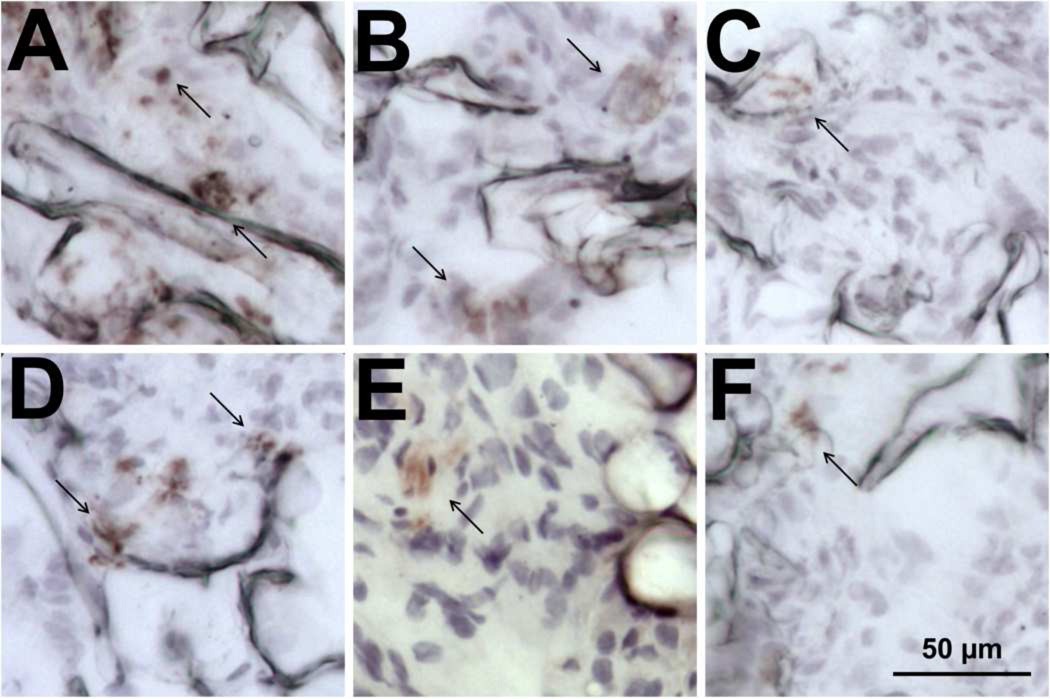
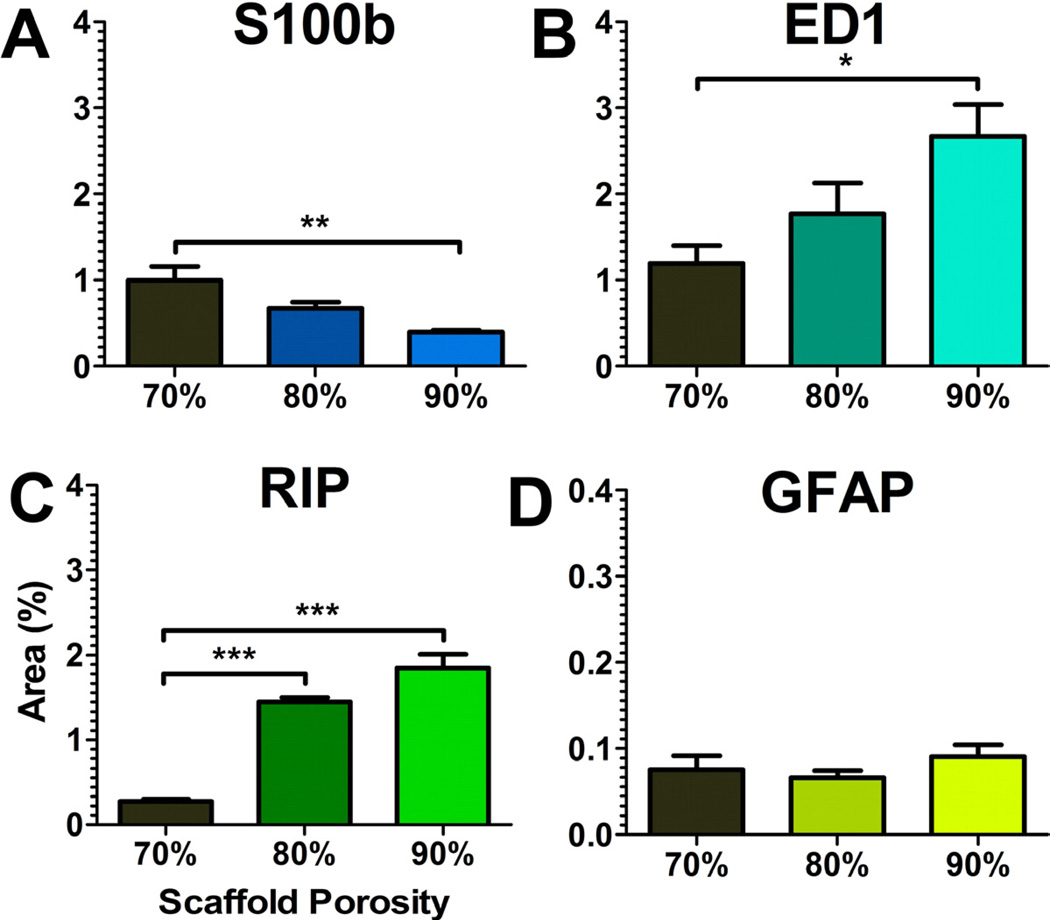
The cell types present within the bridges were then characterized, as these cells create an environment through which axons must extend. Bridges implanted for 8 weeks contained multiple cell types (Figs. 6 and 7). The relative distribution of these cells in the channels and pores were equal for all types. Cell types associated with the injured spinal cord were initially characterized, including macrophages (ED-1+), fibroblasts (rPH+), and reactive astrocytes (GFAP+). ED-1+ and rPH+ cells were the most abundant in the bridge. ED-1+ cells increased at greater porosities relative to the 70% porous bridge, whereas the presence of rPH+ cells did not vary with porosity. In contrast, few GFAP+ cells were observed and their presence did not vary as a function of the bridge porosity. These cells were bipolar, similar to previous findings in our bridges [8].
Fig. 6.
Cell types occupying the bridges. Bridges with 90% porosity were retrieved at 8 weeks and stained with antibodies to (a) ED-1, (b) rPH, (c) GFAP, (d) RIP, (e) S-100β, and (f) RECA whose positively stained areas are indicated with arrows.
Fig. 7.
Quantification of cell residency within 70%, 80%, and 90% porous bridges. DAB-area selection using the Normalized Red transformation was applied to (a) S-100β, (b) ED-1, (c) RIP, and (d) GFAP stained tissues. Asterisks indicated a significance of p < 0.05. Doubling or tripling of asterisks indicated greater significance at p < 0.01 and p < 0.001 respectively.
Cell types associated with a regenerating spinal cord were then characterized, including oligodendrocytes (RIP+), Schwann cells (S100β+) and endothelial cells (RECA-1+). RIP+ and S100β+ cells were abundant in the bridge, with a low relative abundance in 70% porous bridges and markedly increased levels in bridges of greater porosities. Several RIP+ cells displayed multiple processes, consistent with the morphology needed to myelinate regenerating axons; however, the majority of RIP+ cells had a bipolar morphology, suggesting axial alignment to the bridge. In contrast, S100β+ cells decreased compared to the 70% porous bridge. S-100β staining in the bridge did not appear to co-localize or correlate with GFAP+ or RIP+ cells, which are also reported to contain this antigen. Additionally, RECA-1 staining was relatively low and did not change with porosity.
Extracellular matrix
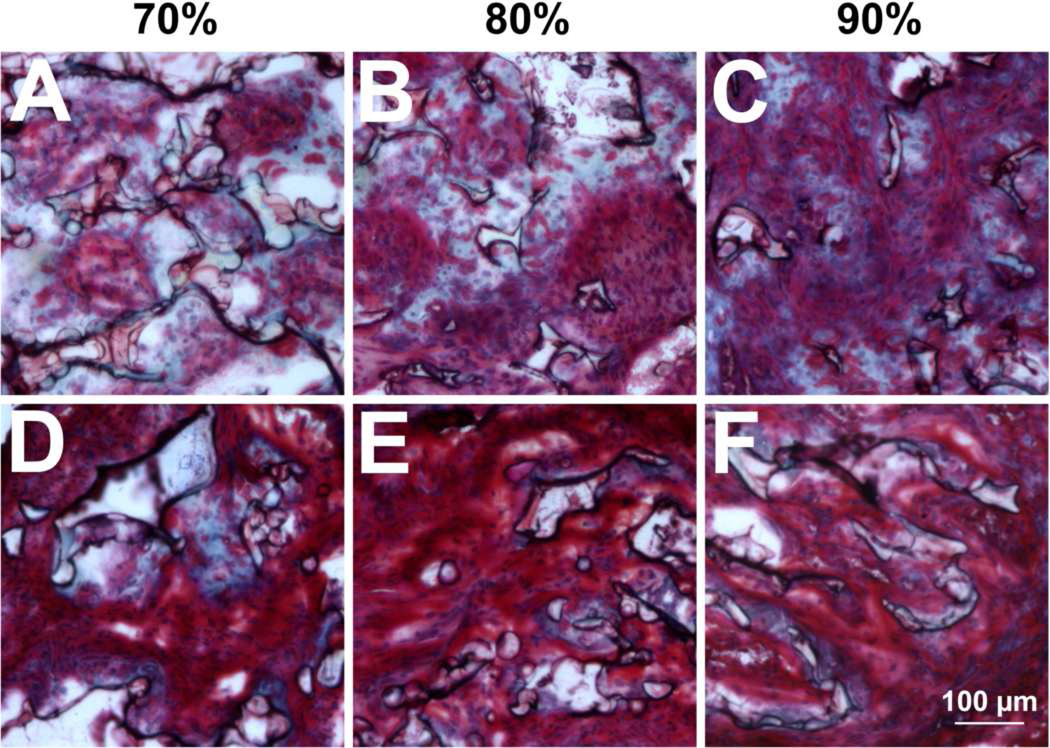
We next investigated the deposition of extracellular matrix proteins as a potential mechanism for the altered residency of cells and growth of neurites in bridges of varying porosity. Masson’s trichrome staining, which labels collagen types I and III blue, revealed fibrillar collagen in all bridges after 2 weeks implantation (Fig. 8a–c). Collagen deposition was restricted to areas adjacent to the polymer or areas where polymer was resorbed, consistent with the fibrous rim reported in previous studies [15]. Collagen area in the bridge decreased as a function of porosity, correlating with the decreased polymer presence in the bridge. At 8 weeks, the intensity of red and blue staining had increased, suggesting more matrix was deposited in the extracellular space. Additionally, collagen area in the bridge was reduced at all porosities compared to their content at 2 weeks. This decrease was more pronounced in bridges of higher porosities (Fig. 8d–f).
Fig. 8.
Collagen deposition identified by Masson’s trichrome stain. Images represent samples with (a, d) 70%, (b, e) 80%, and (c, f) 90% porosity captured at (a–c) 2 weeks and (d–g) 8 weeks.
Myelination
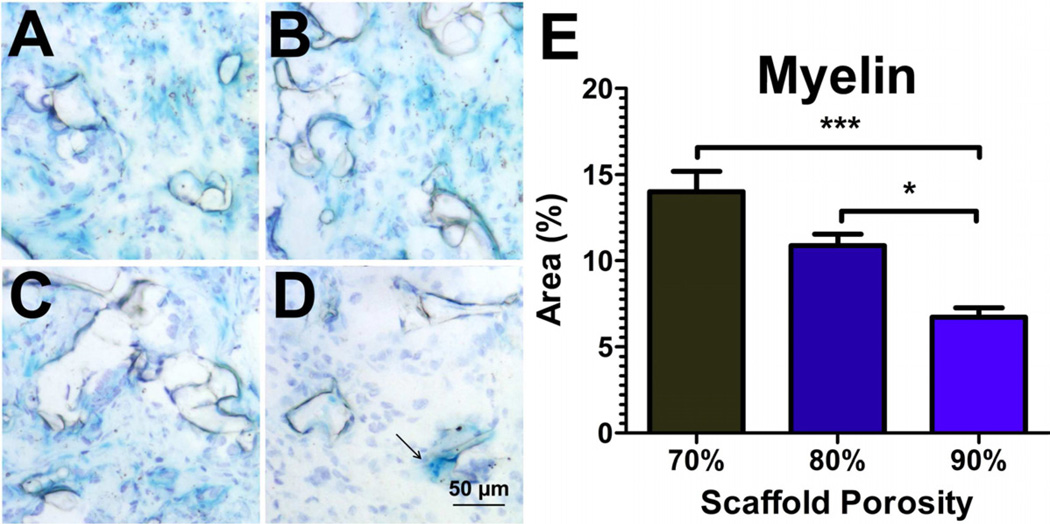
The abundance of myelinating cells (RIP+, S-100β+) in these bridges prompted the characterization of myelin deposition in our bridges. Luxol fast blue (LFB) staining of bridges retrieved at 2 weeks identified round LFB-positive areas at the periphery of the bridge. These areas were approximately the size of a cell, and may be myelin-laden macrophages (Fig. 9). At 8 weeks, LFB staining was observed in the middle of the bridge, suggesting myelin content was not residual debris resulting from the injury. LFB+ areas were quantified using the Normalized Red transformation method, which transforms blue, the primary color of LFB, to white. The area of LFB staining decreased as a function of bridge porosity, which contrasts with the increased number of regenerating neurites and the increased presence of RIP positive cells. The decreased LFB staining was similar to the decline in staining for S-100β+ cells, which are a significant source of myelination after spinal cord injury [3].
Fig. 9.
Myelin deposition identified by Luxol fast blue stain. Images for (a) 70%, (b) 80%, and (c) 90% porous bridges after 8 weeks implantation. (d) After 2 weeks implantation, blue staining was restricted to debris-laden macrophages at the bridge periphery. (e) Quantification of LFB area at 8 weeks using the Normalized Red-aided selection method (white = blue content in the transformed image).
Discussion
PLG bridges have been demonstrated as a versatile platform for promoting nerve regeneration. Herein, we investigated the physical properties of bridges for their impact in creating a permissive environment following spinal cord injury. Bridge fabrication by solvent casting has previously been employed to create aligned, multiple channel structures with a high cross-sectional area to enhance neurite guidance through the injury [15–18]. In contrast, the gas foaming / particulate leach approach created a multiple channel architecture, in which the polymer surrounding the channels has a highly interconnected pore structure [8,11,13]. In this report, we incorporated sacrificial templating in our gas foaming fabrication process to maximize the number of channels in the PLG bridges, while also creating a range of porosities achieved by varying the amount of porogen. Using our technique, we fabricated bridges exceeding 30% channel cross-sectional area and over 90% porosity that maintained their architecture following implantation in vivo. The templating process enabled easy fabrication of high channel density structures, leading to the development of bridges for both rat and mouse spinal cord injury models, which has yet to be reported in the literature. In addition to the structural properties, bridges can serve as vehicles for the delivery of factors to support regeneration, which has promoted robust, aligned extension of axons down the channels and across the injury [11,16,17]. Additionally, cell transplantation using PLG bridges has demonstrated enhanced functional regeneration after spinal cord injury [9]. The PLG bridge platform provides multiple opportunities to enhance nerve regeneration, and the physical properties of the bridge are critical to maximizing regeneration.
The high density of channels in combination with the bridge porosity supported robust extension of neurites into the bridge in both animal models. Axons enter and extend through bridges via the aligned channels, consistent with previous reports [7], and occasionally through the interconnected pores, which was not previously observed. At 8 weeks, neurite density was maximal in the 80% porous bridge for the rat injury model. The results are consistent with a previous report investigating multiple bridge geometries, which concluded that a bridge design with an “open path” geometry enhanced neural extension after injury [19]. The number of neurites present in our bridges approaches 10% of uninjured densities [20], and was increased approximately 7-fold relative to our previous results with 7-channel bridges implanted into the injured rat spinal cord [11]. Implantation of channel-rich bridges (15–30% channel cross-sectional area) [14,15] did not achieve the levels of neural extension found in this study. Im portantly, the bridge porosity contributes significantly to the impact of the channel density on neurite extension. Pore-rich bridges previously reported by us (<15% channel cross-sectional area), consisted of an interconnected pore structure between the channels that resulted in robust cellular ingrowth into both the walls and channels, yet neurite density was low [11]. In the study herein, the fabrication process produced bridges that surpassed the porosities and the channel cross-sectional areas of our previous bridge designs. The high density of interconnected pores and linear channels in these bridges created a permissive environment for axons to extend into the bridge at 2 weeks and 8 weeks that exceeded densities previously reported for other PLG bridge designs.
The increased neurite extension as a function of bridge porosity coincided with an increased cell infiltration throughout the pores of the bridge, and an altered deposition of collagen. Additionally, the distribution of other cells was governed by bridge architecture. At 2 weeks, the pores of the bridge served as additional entry points for these cell types as overall cell infiltration increased as a function of porosity, yet neurites did not extend through them. At 8 weeks, the types of cells present in our bridges varied based on the overall porosity. Macrophages, which secrete cytokines and neurotrophic factors that influence neural regeneration [21,22], had an increased presence at the greater porosities. In contrast, astrocytes remained primarily exterior to the bridge, consistent with the role in forming a glial scar at the host tissue interface. Taken together, the high porosity and high channel density of our bridges resulted in an open, interconnected architecture, which governed the entry of multiple cell types, permitted the residency of cells in both the pores and channels, and guided the extension of axons.
In this study, myelin deposition as measured by LFB staining varied inversely to the porosity of the bridge. Schwann cells and oligodendrocytes are known to deposit myelin after spinal cord injury. S-100β+ cells decreased with increasing porosity, similar to LFB staining in our bridges, which contrasts with the observed increase in RIP+ cells with increasing porosity. The delivery of factors to recruit oligodendrocytes and promote myelination represents an opportunity for enhancing the growth, survival and conductance of neurons [3–5].
Finally, we described an image transformation technique that permitted the rapid characterization of cell residency, defined as the percentage area occupied by the cell, and neurite density for sections stained using DAB-based immunohistochemistry. Markers chosen to characterize the residency of myelinating and inflammatory cell types were well-established cytoplasmic antigens that enabled the quantification of cell area. Quantifying regenerating neurites required translating the neurofilament area obtained by this analysis method using a training set of images employed to correlate their area with neurite number. This semi-automated, accurate detection of DABpos areas using this transformation method permitted rapid and quantitative characterization of the host response of 5 cell types following spinal cord injury.
Conclusion
We investigated the relative contribution of channels and interconnected pores in bridge architecture to promote neurite extension in both rat and mouse spinal cord injury models. Bridges at all porosities supported infiltration of sprouting neurites at a two week time point. The 70% porous did not support further axon elongation. In contrast, bridges with an interconnected pore network demonstrated robust neurite extension, which likely results from an enhanced infiltration by other cells including macrophages and oligodendrocytes. Although both neurite extension and oligodendrocyte presence increased at higher porosities, myelination did not. This study reveals the role of bridge architecture in modulating the cellular environment after spinal cord injury as a tool for promoting neural regeneration.
Supplementary Material
Supp. 2. Selection of DABpos areas. Color-thresholds to select DABpos areas yielded similar false positive rates amongst the transformation methods. However, the Normalized Red transformation method produced the minimal area difference, resulting in the greatest Pearson correlation. Area Diff. = Area (transform selection) – Area (manual trace).
Supp. 1. Comparison of DAB selection in hematoxylin-counterstained images. The columns are for the (a,f) non-transformed, (b,gk,o) Normalized Red, (c,h,l,p) Normalized Blue, (d,I,m,q) Green-Blue, and (e,j,n,r) Brown transformed images. (a–e) Representative images for the multiple transformation. (f–j) Representative images indicating selection of DABpos areas using a color threshold. (k–n) Correlation of manual tracings to automated tracings. (o–r) Deviations in area as a function of the manual tracing area, demonstrating the lack of bias across the range of areas observed.
Supp. 3. Neurofilament area to neurite density correlation. (a) The neurite density was obtained from the following equation: 947.3 * Neurofilament Area (%) + 347.3. This equation permitted rapid technique for determine the neurite density within sections of the bridge. (b) Densities measured using the semi-automated neurofilament analysis were similar to those obtained by manual counting (n = 4).
Acknowledgments
This work was supported by the NIH (RO1 EB005678, R21 EB006520, RO1 EB003806, R25 GM079300). The authors are grateful to Mark McClendon for providing assistance in scanning electron microscopy, to Ho Jin Sun for assistance in image compilation, and to Dr. Romie Gibly for guiding this work.
Footnotes
Publisher's Disclaimer: This is a PDF file of an unedited manuscript that has been accepted for publication. As a service to our customers we are providing this early version of the manuscript. The manuscript will undergo copyediting, typesetting, and review of the resulting proof before it is published in its final citable form. Please note that during the production process errors may be discovered which could affect the content, and all legal disclaimers that apply to the journal pertain.
References
- 1.Amankulor NM, Hambardzumyan D, Pyonteck SM, Becher OJ, Joyce JA, Holland EC. Sonic hedgehog pathway activation is induced by acute brain injury and regulated by injury-related inflammation. J Neurosci. 2009;29:10299–10308. doi: 10.1523/JNEUROSCI.2500-09.2009. [DOI] [PMC free article] [PubMed] [Google Scholar]
- 2.Kakulas BA. Neuropathology: the foundation for new treatments in spinal cord injury. Spinal Cord. 2004;42:549–563. doi: 10.1038/sj.sc.3101670. [DOI] [PubMed] [Google Scholar]
- 3.Smith KJ, Blakemore WF, McDonald WI. Central remyelination restores secure conduction. Nature. 1979;280:395–396. doi: 10.1038/280395a0. [DOI] [PubMed] [Google Scholar]
- 4.Bunge RP. Expanding roles for the schwann cell: ensheathment, myelination, trophism and regeneration. Curr Opin Neurobiol. 1993;3:805–809. doi: 10.1016/0959-4388(93)90157-t. [DOI] [PubMed] [Google Scholar]
- 5.Du Y, Dreyfus CF. Oligodendrocytes as providers of growth factors. J Neurosci Res. 2002;68(6):647–654. doi: 10.1002/jnr.10245. [DOI] [PubMed] [Google Scholar]
- 6.Wang Y, Cheng X, He Q, Zheng Y, Kim DH, Whittemore SR, et al. Astrocytes from the contused spinal cord inhibit oligodendrocyte differentiation of adult oligodendrocyte precursor cells by increasing the expression of bone morphogenetic proteins. J Neurosci. 2011;31:6053–6058. doi: 10.1523/JNEUROSCI.5524-09.2011. [DOI] [PMC free article] [PubMed] [Google Scholar]
- 7.Scott JB, Afshari M, Kotek R, Saul JM. The promotion of axon extension in vitro using polymer-templated fibrin scaffolds. Biomaterials. 2011;32:4830–4839. doi: 10.1016/j.biomaterials.2011.03.037. [DOI] [PubMed] [Google Scholar]
- 8.Yang Y, De Laporte L, Zelivyanskaya ML, Whittlesey KJ, Anderson AJ, Cummings BJ, et al. Multiple channel bridges for spinal cord injury: cellular characterization of host response. Tissue Eng Part A. 2009;15:3283–3295. doi: 10.1089/ten.tea.2009.0081. [DOI] [PMC free article] [PubMed] [Google Scholar]
- 9.Teng YD, Lavik DB, Qu X, Park KI, Ourednik J, Zurakowski D, et al. Functional recovery following traumatic spinal cord injury mediated by a unique polymer scaffold seeded with neural stem cells. Proc Natl Acad Sci. 2002;99:3024–3029. doi: 10.1073/pnas.052678899. [DOI] [PMC free article] [PubMed] [Google Scholar]
- 10.Brey EM, Lalani Z, Johnston C, Wong M, McIntire LV, Duke PJ, et al. Automated selection of DAB-labeled tissue for immunohistochemical quantification. J Histochem Cytochem. 2003;51:575–584. doi: 10.1177/002215540305100503. [DOI] [PubMed] [Google Scholar]
- 11.Tuinstra HM, Aviles MO, Shin S, Holland SJ, Zelivyanskaya ML, Fast AG, et al. Multifunctional, multichannel bridges that deliver neurotrophin encoding lentivirus for regeneration following spinal cord injury. Biomaterials. 2012;33:1618–1626. doi: 10.1016/j.biomaterials.2011.11.002. [DOI] [PMC free article] [PubMed] [Google Scholar]
- 12.Li J, Rickett T, Shi R. Biomimetic nerve scaffolds with aligned intraluminal microchannels: a ‘sweet’ approach to tissue engineering. Langmuir. 2009;25:1813–1817. doi: 10.1021/la803522f. [DOI] [PubMed] [Google Scholar]
- 13.Yang Y, De Laporte L, Rives CB, Jang J-H, Lin W-C, Shull KR, et al. Neurotrophin releasing single and multiple lumen conduits. J Control Release. 2005;104:433–446. doi: 10.1016/j.jconrel.2005.02.022. [DOI] [PMC free article] [PubMed] [Google Scholar]
- 14.Moore MJ, Friedman JA, Lewellyn EB, Mantila SM, Krych AJ, Ameenuddin S, et al. Multiple-channel scaffolds to promote spinal cord axon regeneration. Biomaterials. 2006;27:419–429. doi: 10.1016/j.biomaterials.2005.07.045. [DOI] [PubMed] [Google Scholar]
- 15.Krych AJ, Rooney GE, Chen B, Schermerhorn TC, Ameenuddin S, Gross L, et al. Relationship between scaffold channel diameter and number of regenerating axons in the transected rat spinal cord. Acta Biomater. 2009;5:2551–2559. doi: 10.1016/j.actbio.2009.03.021. [DOI] [PMC free article] [PubMed] [Google Scholar]
- 16.Tuszynski MH, Stokols S. Freeze-dried agarose scaffolds with uniaxial channels stimulate and guide linear axonal growth following spinal cord injury. Biomaterials. 2006;27:443–451. doi: 10.1016/j.biomaterials.2005.06.039. [DOI] [PubMed] [Google Scholar]
- 17.Gros T, Sakamoto JS, Blesch A, Havton LA, Tuszynski MH. Regeneration of long-tract axons through sites of spinal cord injury using template agarose scaffolds. Biomaterials. 2010;31:6719–6729. doi: 10.1016/j.biomaterials.2010.04.035. [DOI] [PubMed] [Google Scholar]
- 18.Yu TT, Shoichet MS. Guided cell adhesion and outgrowth in peptide-modified channels for neural tissue engineering. Biomaterials. 2005;26:1507–1514. doi: 10.1016/j.biomaterials.2004.05.012. [DOI] [PubMed] [Google Scholar]
- 19.Wong DY, Leveque J-C, Brumblay H, Krebsbach PH, Hollister SJ, LaMarca F. Macro-architectures in spinal cord scaffold implants influence regeneration. J Neurotrauma. 2008;25:1027–1037. doi: 10.1089/neu.2007.0473. [DOI] [PMC free article] [PubMed] [Google Scholar]
- 20.Rosenberg LJ, Wrathall JR. Quantitative analysis of acute axonal pathology in experimental spinal cord contusion. J Neurotrauma. 1997;14:823–838. doi: 10.1089/neu.1997.14.823. [DOI] [PubMed] [Google Scholar]
- 21.Dougherty KD, Dreyfus CF, Black IB. Brain-derived neurotrophic factor in astrocytes, oligodendrocytes, and microglia/macrophages after spinal cord injury. Neurobiol Dis. 2000;7:574–585. doi: 10.1006/nbdi.2000.0318. [DOI] [PubMed] [Google Scholar]
- 22.Kigerl KA, Gensel JC, Ankeny DP, Alexander JK, Donnelly DJ, Popovich PG. Identification of two distinct macrophage subsets with divergent effects causing either neurotoxicity or regeneration in the injured mouse spinal cord. J Neurosci. 2009;29:13435–13444. doi: 10.1523/JNEUROSCI.3257-09.2009. [DOI] [PMC free article] [PubMed] [Google Scholar]
Associated Data
This section collects any data citations, data availability statements, or supplementary materials included in this article.
Supplementary Materials
Supp. 2. Selection of DABpos areas. Color-thresholds to select DABpos areas yielded similar false positive rates amongst the transformation methods. However, the Normalized Red transformation method produced the minimal area difference, resulting in the greatest Pearson correlation. Area Diff. = Area (transform selection) – Area (manual trace).
Supp. 1. Comparison of DAB selection in hematoxylin-counterstained images. The columns are for the (a,f) non-transformed, (b,gk,o) Normalized Red, (c,h,l,p) Normalized Blue, (d,I,m,q) Green-Blue, and (e,j,n,r) Brown transformed images. (a–e) Representative images for the multiple transformation. (f–j) Representative images indicating selection of DABpos areas using a color threshold. (k–n) Correlation of manual tracings to automated tracings. (o–r) Deviations in area as a function of the manual tracing area, demonstrating the lack of bias across the range of areas observed.
Supp. 3. Neurofilament area to neurite density correlation. (a) The neurite density was obtained from the following equation: 947.3 * Neurofilament Area (%) + 347.3. This equation permitted rapid technique for determine the neurite density within sections of the bridge. (b) Densities measured using the semi-automated neurofilament analysis were similar to those obtained by manual counting (n = 4).


