Abstract
We report a photoactivable nanoprobe for cell labeling and tracking. The nanoprobe enables all targeted cells to be imaged (at 680 nm) as well as specific cells to be photoactivated using 405 nm light. Photoactivated cells can then be tracked (at 525 nm) spatiotemporally in a separate channel over prolonged periods.
Keywords: Photoactivation, nanoprobe, cell labeling, targeting, biomarkers
Labeling single cells or selected subpopulations of cells in a spatiotemporally controlled manner is important for studying cellular migration,[1] immune cell behavior[2] as well as tumor growth or metastasis formation.[3] To date, a variety of labeling approaches have been developed such as engrafting genetically distinct cells,[4] microinjecting dyes,[5] or electroporating single cells with DNA.[6] Among the various labeling approaches, light-regulated methods have received particular attention on account of their capability for fine spatial and temporal control of labeling.[7]
Photolabeling requires specific fluorescent probes, which are either genetically encoded proteins[8,9] or exogenously applied dyes.[10] The advantages of the former probes are the ease with which they can be generated as well as the specificity of their expression.[11] The disadvantage of these probes, however, is that their fluorescence diminishes with protein turnover, i.e. photolabeled cells usually restore their native protein (and thus lose color) within a couple of days. In contrast, while the latter probe types are temporally stable, currently available “caged” small molecule fluorochromes have several drawbacks. Their most significant drawback is perhaps their inability to visualize fluorochromes prior to photoconversion; in rare instances this is possible but only with large amounts of light.[12]
In this study, we hypothesized that specifically designed, biocompatible nanomaterials could be used as synthetic scaffolds for creating multichannel cellular labeling agents. Using these scaffolds, not only would it be possible to target nanomaterials to a particular cell type but more importantly, multiple functionalities could be grafted onto a single nanoparticle surface to adapt it to a diversity of applications.[13] Herein, we describe the synthesis of an imageable and photoactivable nanoprobe (PANP) that allows dual-color optical labeling of cells in a spatiotemporally controlled fashion (Scheme 1). PANP can be visualized at 680 nm, photoconverted at 405 nm, and labeled cells can be imaged at 525 nm. To demonstrate the use of this technique for labeling in a cellular setting, macrophage cells with an affinity for dextran coated particles were used.[14] The versatility of the method was then demonstrated by adapting it to dual-color optical labeling of over-expressed epidermal growth factor receptor (EGFR) biomarkers on the surface of human epithelial carcinoma A431 cells.
Scheme 1.
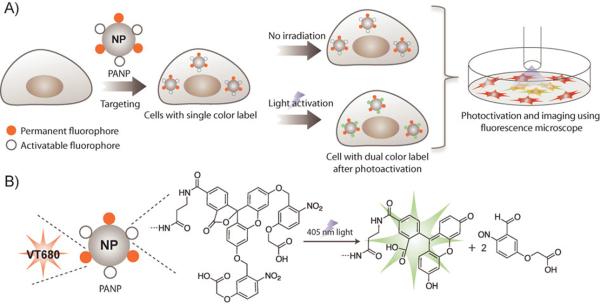
Schematic showing the spatiotemporally-controlled dual-color optical labeling strategy using photoactivable nanoprobe (PANP) targeted to a specific cell type. A) VT680 and `caged' fluorescein-conjugated PANP was used to label cells of interest (e.g. phagocytic macrophages or human epithelial carcinoma A431 cells). All labeled cells were visible at 680 nm. Dual-color labeling of cells was achieved with high spatial and temporal resolution following their activation with 405 nm laser light. Light exposure to a selected population of cells lead to activation of fluorescein fluorescence, and thus dual-color (VT680 and fluorescein) labeling of cells. Activation of cells and corresponding real-time imaging was achieved using confocal laser scanning microscopy (CLSM). B) The chemical structure of PANP and its photocleavage reaction under 405 nm light. The photolytic reaction removes the two o-nitrobenzyl caging groups, which leads to activation of fluorescein fluorescence.
In designing PANP, we initially used amine functionalized cross-linked dextran stabilized nanoparticles.[15] This particular type of nanoparticle was chosen for its stability, biocompatibility, non-toxicity and in vivo macrophage targeting ability.[14] PANP was created by first conjugating succinimidyl esters of VT680 (VivoTag 680) and then adding `caged' fluorescein to the remaining amine functionalities on the nanoparticle. In this construct, VT680 provides single-color imaging in the far red region for probe identification, while cell-selective photoactivation of `caged' fluorescein generates an additional color for dual-color imaging. Conjugation of VT680 and `caged' fluorescein was evident from the absorption spectra of the PANP (Supporting Information, Figure S1). The number of VT680 and `caged' fluorescein molecule attached to a single nanoparticle was estimated ~8 and 30, respectively. [15b,c] Measurement of the hydrodynamic diameter by dynamic light scattering (DLS) showed PANP to have a diameter of ~32 nm, indicating that aggregation of nanoparticles did not occur after conjugation (Supporting Information, Figure S2). The fluorescence properties of PANP, both before and after light activation, were characterized using a Tecan fluorescence microplate reader. Figure S3 (Supporting Information) shows the absorption and the fluorescence spectra of the free dyes. Prior to light activation, PANP showed high fluorescence emission from the VT680 fluorophore (inset Figure 1), but no detectable fluorescence from the caged fluorescein moieties. There was likewise no measurable change in the fluorescence spectral feature of PANP following its incubation in phosphate buffer or cell culture media for >24 hours at 37. Subsequent illumination with long wavelength ultraviolet light (>365 nm), however, resulted in photolytic cleavage of the o-nitrobenzyl caging groups on PANP, which thus lead to an increased in fluorescein fluorescence. Figure 1 shows the increase in fluorescein fluorescence after different durations of light illumination. These results demonstrate that PANP behaves as a dual-color probe with `continuously on' VT680 fluorescence as well as photoactivable fluorescein fluorescence.
Figure 1.
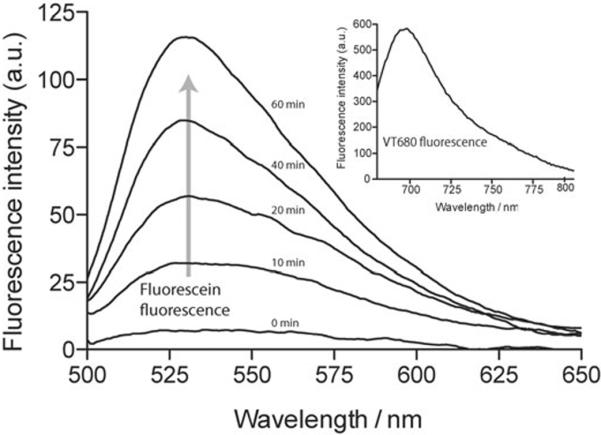
Fluorescence characterization of PANP. Before irradiation, PANP only showed detectable fluorescence in the VT680 channel (inset, excitation wavelength = 670 nm). Irradiation with long wavelength ultraviolet light lead to an increase in fluorescein fluorescence. A time course of the photo-uncaging process was monitored by fluorescence spectroscopy. As the photochemical reaction continued, an increase in fluorescence (excitation wavelength = 470 nm) was observed over time.
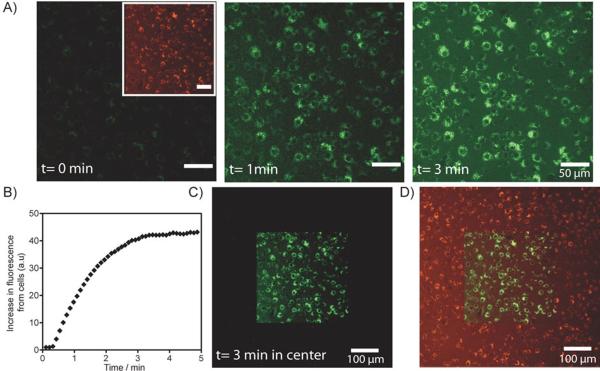
To test the biocompatibility, photoactivation and feasibility of the tagging approach, we initially used the macrophage RAW cell line. Having the ability to color code macrophages with spatiotemporal resolution would represent an important research tool for tracking the migration of such cells to disease sites under various conditions.[16–18] In this experiment, RAW cells were first incubated with PANP for 3 hours. The cells were then washed to remove excess nanoparticle and fixed for subsequent imaging with confocal laser scanning microscopy (CLSM; Olympus FV1000). As shown in the inset of Figure 2A (left), the labeling of RAW cells was verified by the presence of a strong fluorescence signal in the VT680 channel emanating from the cells. To activate the second color for dual-color labeling, cells within a small square area of the visual window were then exposed to a 405 nm light. Microscopic photoactivation was performed by sequential line scanning with the 405 nm diode laser. At the same time, fluorescence images (in the fluorescein channel) were acquired by exciting with a 473 nm diode laser and then collecting the emitted light using BA490–590 band-pass filter. As shown in Figure 2A (center and right), fluorescein fluorescence was activated in these cells following a brief period of light illumination. Indeed, fluorescence was seen to increase over time, reaching saturation within 3 minutes of image acquisition time (Figure 2B); the increase in fluorescein fluorescence was ~40 fold. Importantly, when the photoactivated region (square area) was imaged under lower magnification, only cells with fluorescein fluorescence appeared in the photoactivated region; this demonstrated that labeling of RAW cells could be restricted to a spatially defined region (Figure 2C). Finally, to distinguish dual-labelled cells from other RAW cells, CLSM images were acquired in both the fluorescein and VT680 channels. As presented in Figure 2D, merged images revealed co-localized fluorescein and VT680 fluorescence in photoactivated cells. Having the ability to differentiate photoconverted cells from native cells could have important applications for macrophage biology. In particular, the technology could be used to monitor the long distance migration of cells between organs, using fluorescence-activated cell sorting (FACS) of harvested tissues.
Figure 2.
Spatiotemporally controlled dual-color labeling of macrophage RAW cells. A) RAW cells were incubated with PANP and washed before imaging. Left inset, a CLSM image of RAW cells before photoactivation, where the entire population of PANP-labeled RAW cells are visible in the VT680 channel (pseudo-colored red). Left, prior to photoactivation (t=0 min), no fluorescence signal was detectable in the fluorescein channel. Center and right, fluorescein fluorescence of PANP was activated by a 405 nm laser light on the confocal microscope. Increasing light exposure lead to an increase in the fluorescein signal from cells (pseudo-colored green), detectable from the CLSM images acquired after 1 min and 3 min. Microscopic photoactivation was performed by sequential line scanning with the 405 nm diode laser, where exposure time per voxel (~1 μm3) was set at 10 μs per image. The total exposure time to 405 nm light of ~1 μm3 is ~100 μs (for image acquired at 1 min) and ~300 μs (for image acquired at 3 min). B) Increase in fluorescence in the fluorescein channel is plotted against image acquisition time. Continuous scanning of the cells with 405 nm light leads to an increase in fluorescein signal of the RAW cells over time till saturation is reached after about 3 min of image acquisition. C) Spatially restricted activation of PANP. Here, the activated region was imaged under lower magnification. The CLSM image shows cells with fluorescein fluorescence restricted to the photoactivated region of the imaging slide (central square). D) A merged CLSM image showing fluorescent signals from both the fluorescein and VT680 channels. The light exposed area (central square) contains dual-color labelled RAW cells.
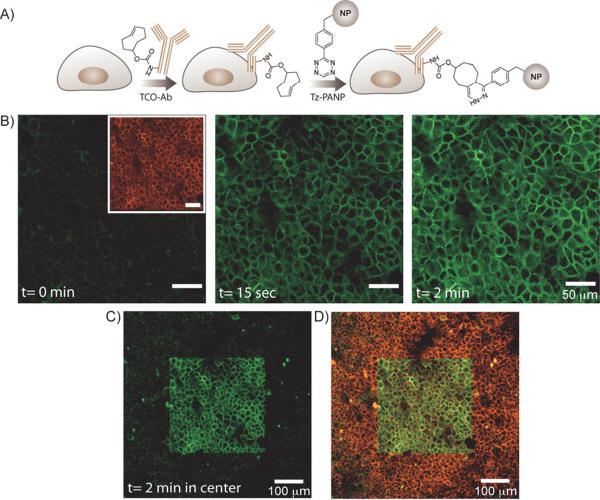
While the above studies exploited the phagocytic ability of macrophages to photoconvert cells, we were also interested in photoconverting non-phagocytic cells such as primary cancer cells. For this experiment, we selected human epithelial carcinoma A431 cells, in which the overexpression of epithelial growth factor receptors (EGFR) were used to target nanoparticles to the cell surface using bioorthogonal chemistry.[19,20] Specifically, the approach involved using trans-cyclooctene (TCO) and tetrazine (Tz) to target PANP to EGFR.[20] As shown in Figure 3A, A431 cells were initially incubated with TCO-modified primary antibodies (TCO-Ab). Tz-modified PANP (Tz-PANP) were then coupled to the antibodies via a highly specific bioorthogonal cycloaddition between the TCO and Tz moieties. Subsequent imaging with CLSM revealed a strong fluorescence signal in the VT680 channel emanating from the A431 cell surface (inset of Figure 3B, left), which indicated that Tz-PANP had successfully localized to membrane-associated EGFR. Exposure of the cells to 405 nm laser light then activated fluorescein fluorescence, which could also be readily detected by CLSM (Figure 3B, center and right). Imaging at lower magnification later demonstrated spatially restricted activation of these cells (Figure 3C). By merging the images (from both the fluorescein and VT680 channels), dual-labelled cells could be easily differentiated from other targeted cells (Figure 3D). Similar results were also obtained with SK-BR-3 cancer cells, after targeting the overexpression of HER2/neu, and photoactivating the cells for dual-color labeling (Supporting Information, Figure S4). This demonstrates that this labeling method could be applied to a diverse range of biomarkers.
Figure 3.
Spatiotemporally controlled dual-color labeling of the A431 cells. A) Antibody mediated two-step labeling approach. TCO-Ab against the biomarker of interest (EGFR) were targeted to A431 cells and then used as scaffolds for bioorthogonal coupling of Tz-PANP in live cells. B) Left inset, a CLSM image of the A431 cells showing VT680 fluorescence (pseudo-colored red) from the cell surface. Left, unlike the VT680 channel, no fluorescence signal was detectable in the fluorescein channel. Center and right, subsequent exposure of the cells to 405 nm laser light resulted in fluorescein fluorescence (pseudo-colored green) from the cell surface. Fluorescence intensity increased with increasing light exposure time. C) A CLSM image showing the presence of fluorescein fluorescence from the cell surface, restricted to the photoactivated region of the imaging slide (central square). D) A merged CLSM image showing fluorescent signals from both the fluorescein and VT680 channels. The light exposed area (central square) contains dual-color labelled A431 cells.
Next, we determined the feasibility of the photoactivation in live cells. A431 cells grown on a 6 well culture plate were tagged with Tz-PANP using bioorthogonal chemistry. Live cells were photoactivated and imaged through the medium using a 20x water immersion objective. As shown in Figure 4A, spatially restricted activation of fluorescein fluorescence was observed only in cells exposed to 405 nm light. Figure 4B shows the merged fluorescence image, where dual-labelled cells (or even part of a cell) could be easily distinguished from the single label cells. Fluorescein activation and the appearance of dual-labelled cells was also evident from flow cytometry analysis (Supporting Information, Figure S5). Photoactivated dual-labelled cells imaged over time showed the internalization of the PANP into the endosomes and the movement of the endosomes inside the cells (Supporting Information, Movie1). No change in cellular morphology was observed during the activation process or even during the imaging period, indicating minimal phototoxicity from the light irradiation process.[10c,d,f,g]
Figure 4.
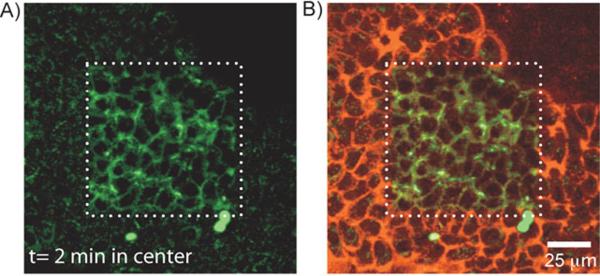
Live cell photoactivation experiment showing spatiotemporally controlled dual-color labeling of live A431 cells. A) The CLSM image showing A431 cells with fluorescein fluorescence restricted to the photoactivated region (central square). B) A merged CLSM image showing fluorescent signals from both the fluorescein and VT680 channels. The light exposed area (central square) contains dual-color labelled A431 cells.
In summary, we describe the development of a nanomaterial-based imaging agent platform that allows (a) single-color photolabeling of specific cells in one channel (e.g. 680 nm), and (b) light-regulated spatiotemporally controlled photoswitching (405 nm), which causes cells to fluoresce in a separate channel (525 nm) without overlap. The benefit of this approach is that it enables labeled cells (dual-color labeled) to be easily identified from new cells infiltrating the area (initially single-color labeled) at a given site of interest. We demonstrate this selective targeting and dual-color labeling technique in two important cell culture models, namely macrophage immune cells and cancer cells. In addition to in vitro models, we expect that this method will also be applicable to in vivo settings, where the trafficking of these cell types could be monitored over prolonged periods. For example, the infiltration of macrophages to solid tumors could be assessed in relation to both tumor growth as well as to therapeutic outcome.[16,17] We believe that this labeling technique would likewise be useful for studying the dynamics of other immune cells in vivo; in particular, the migration of various immune cells and their continual redistribution throughout the body, both of which are critical for regulating immune responses and for generating effective host responses to tissue insults.[21] We expect that this method will also be useful to label intracellular organelles or for studying dynamic events inside cells by functionalizing the PANP with intracellular targeting motifs.[22] This labeling technique could further be improved by utilizing faster photocleavable group or two-photon cleavable group.[10c,d] We envision that use two-photon for activation will enhance tissue penetration and reduce phototoxicity for in vivo applications. Some of these areas are under investigation in our lab.
Experimental Section
Preparation of PANP
To prepare PANP, we used cross-linked dextran-coated iron oxide nanoparticles with an iron oxide core of ~3 nm and overall hydrodynamic diameter of ~30 nm. The synthesis of amine-terminated nanoparticles and their conjugation with VT680 fluorophores were both done using a previously reported protocol.[15b] To attach caged fluorescein moieties to the nanoparticles, VT680 conjugated nanoparticles (1 mg Fe) were mixed with succinimidyl-ester of caged fluorescein (0.216 mg, Invitrogen) in PBS solution (2.5 mL, pH 8) containing 10% sodium bicarbonate (0.1 M) for 4 hours. VT680 and caged fluorescein conjugated nanoparticles were subsequently concentrated using membrane filtration (Millipore Amicon, MWCO 30,000). The PANP was then purified using Sephadex G-100 (GE Healthcare) column, with PBS as the eluent buffer. PANP was again concentrated using membrane filtration (Millipore Amicon, MWCO 30,000) and stored at 4.
Preparation of Tz-PANP
PANPs (0.75 mg Fe) were mixed with succinimidyl-ester of tetrazine (0.200 mg) in PBS solution (2.5 mL, pH 8) containing 10% sodium bicarbonate (0.1 M) for 4 hours. The Tz-PANP was subsequently concentrated using membrane filtration (Millipore Amicon, MWCO 30,000) and then purified using Sephadex G-50 (GE Healthcare) column, with PBS as the eluent buffer. The Tz-PANP was again concentrated using membrane filtration (Millipore Amicon, MWCO 30,000) and stored at 4°C.
Fluorescence characterization of PANP
Fluorescence characterization of PANP was performed using a 0.25 mg of Fe/ml solution of PANP in PBS solution (pH 7.4). 200 μl solution of PANP was placed on a 96 well microplate. The solution of PANP under investigation was irradiated using a long wavelength handheld UV lamp (6W, UVP, LLC). Fluorescence spectra at various time intervals were recorded using a Tecan fluorescence microplate reader.
Labeling of RAW cells
RAW cells were cultured in Dulbecco's Modified Eagle Medium (DMEM), supplemented with fetal bovine serum (FBS; 10%), penicillin and streptomycin (1%), and L-glutamine (1%). RAW cells were maintained at 37°C in a humidified atmosphere containing 5% CO2. For labeling, RAW cells were grown to confluency in an 8-well chamber slide before experiment. After washing with PBS, cells were incubated with 400 μl of PANP solution (0.15 mg of Fe/ml) in cell culture media at 37°C. After 3 h, PANP solution was removed and the cells were washed 3 times with PBS. Cells were fixed afterwards using 100 μl of 4% PFA solution. Following careful washing with PBS for 3 times, Vectashield mounting medium was added to the samples prior to imaging with confocal microscopy.
Labeling of A431 cells
Human A431 cancer cells were cultured as described for RAW cells. For experiment cells were grown on 8 well chamber slides. A431 cells were washed 3 times with PBS before incubation with antibody. In a typical two step bioorthogonal targeting, A431 cells were first incubated with 100 μl of TCO-Ab (10 μg/mL) in cell culture media for 15 minutes at room temperature. Following aspiration and washing with PBS (3 times), the cells were mixed with 250 μl of Tz-PANP (25 μg of Fe/mL) in PBS (containing 1%BSA and 2% FBS) at room temperature. After 15 min, Tz-PANP solution was removed and the cells were washed 3 times with PBS. Cells were fixed afterwards using 100 μl of 4% PFA solution. Following careful washing with PBS for 3 times, Vectashield mounting medium was added to the samples prior imaging with confocal microscopy.
For live cell experiment, A431 cells were grown on a 6 well plate. Live cells were tagged with PANP using bioorthogonal approach. Cells were then covered with culture medium containing 15 mM HEPES buffer. Cells were placed on a warm plate and imaged through the medium using a 20× water immersion objective.
Imaging and photoactivation of cells
Cells were imaged with a customized Olympus FV1000 based on a BX61-WI confocal microscope (Olympus America). Images were collected with a XLUMPLFLN 20× water immersion objective (NA 1.0, Olympus America). Photoactivation, fluorescein imaging, and VT680 imaging were performed by sequential line scanning using a 405 nm, a 473 nm and a 635 nm diode laser, respectively, in combination with a DM405/488/559/635 nm dichroic beam splitter. Emitted light was then separated and collected using SDM473 and SDM560 beam splitters and BA490-590 and BA655-755 band-pass filters (all Olympus America). Output power of the 405 nm laser was 0.905 mW. Pre and post photoactivation images were collected with the 405 nm laser off. Photoactivation occurred only with the 405 nm laser light. There was no photoactivation observable by 473 nm or 635 nm laser light even after long time exposure at high power.
Supplementary Material
Footnotes
We thank T. Reiner and G. Budin for helpful discussions with the chemical synthesis; E. Tiglao for assistance with cell culture; A. Zaltsman for assistance with microscopy; N. Sergeyev for synthesis of cross-linked dextran stabilized nanoparticles and Y. Fisher-Jeffes for reviewing the manuscript. This work was supported in part by National Institute of Health Grants R01-EB0044626, R01-EB010011, T32 grant T32CA79443, P50 grant P50CA86355, CCNE contract U54CA151884, and TPEN contract HHSN268201000044C.
Supporting Information is available on the WWW under http://www.small-journal.com or from the author.
References
- [1].a) Goguen BN, Imperiali B. ACS Chem. Biol. 2011;6:1164. doi: 10.1021/cb200299k. [DOI] [PMC free article] [PubMed] [Google Scholar]; b) Taylor A, Wilson KM, Murray P, Fernig DG, Levy R. Chem. Soc. Rev. 2012;41:2707. doi: 10.1039/c2cs35031a. [DOI] [PubMed] [Google Scholar]; c) Sidani M, Wyckoff J, Xue C, Segall JE, Condeelis J. J. Mammary Gland Biol. Neoplasia. 2006;11:151. doi: 10.1007/s10911-006-9021-5. [DOI] [PubMed] [Google Scholar]; d) Welman A, Serrels A, Brunton VG, Ditzel M, Frame MC. J. Biol. Chem. 2010;285:11607. doi: 10.1074/jbc.M110.102392. [DOI] [PMC free article] [PubMed] [Google Scholar]
- [2].a) Mandl S, Schimmelpfennig C, Edinger M, Negrin RS, Contag CH. J. Cell. Biochem. Suppl. 2002;39:239. doi: 10.1002/jcb.10454. [DOI] [PubMed] [Google Scholar]; b) Hong H, Yang Y, Zhang Y, Cai W. Curr. Top. Med. Chem. 2010;10:1237. doi: 10.2174/156802610791384234. [DOI] [PMC free article] [PubMed] [Google Scholar]; c) Swirski FK, Berger CR, Figueiredo JL, Mempel TR, von Andrian UH, Pittet MJ, Weissleder R. PLoS One. 2007;2:e1075. doi: 10.1371/journal.pone.0001075. [DOI] [PMC free article] [PubMed] [Google Scholar]
- [3].a) Condeelis J, Segall JE. Nat. Rev. Cancer. 2003;3:921. doi: 10.1038/nrc1231. [DOI] [PubMed] [Google Scholar]; b) Gupta GP, Massague J. Cell. 2006;127:679. doi: 10.1016/j.cell.2006.11.001. [DOI] [PubMed] [Google Scholar]
- [4].Kinder SJ, Tsang TE, Quinlan GA, Hadjantonakis AK, Nagy A, Tam PP. Development. 1999;126:4691. doi: 10.1242/dev.126.21.4691. [DOI] [PubMed] [Google Scholar]
- [5].a) Bronner-Fraser M, Fraser SE. Nature. 1988;335:161. doi: 10.1038/335161a0. [DOI] [PubMed] [Google Scholar]; b) Russek-Blum N, Nabel-Rosen H, Levkowitz G. Dev. Dyn. 2009;238:1827. doi: 10.1002/dvdy.21987. [DOI] [PubMed] [Google Scholar]
- [6].Marshel JH, Mori T, Nielsen KJ, Callaway EM. Neuron. 2010;67:562. doi: 10.1016/j.neuron.2010.08.001. [DOI] [PMC free article] [PubMed] [Google Scholar]
- [7].a) Hatta K, Tsujii H, Omura T. Nat. Protoc. 2006;1:960. doi: 10.1038/nprot.2006.96. [DOI] [PubMed] [Google Scholar]; b) Kedrin D, Gligorijevic B, Wyckoff J, Verkhusha VV, Condeelis J, Segall JE, van Rheenen J. Nat. Methods. 2008;5:1019. doi: 10.1038/nmeth.1269. [DOI] [PMC free article] [PubMed] [Google Scholar]; c) Silver J, Ou W. Nano Lett. 2005;5:1445. doi: 10.1021/nl050808n. [DOI] [PubMed] [Google Scholar]; d) Nowotschin S, Hadjantonakis AK. Organogenesis. 2009;5:135. doi: 10.4161/org.5.4.10939. [DOI] [PMC free article] [PubMed] [Google Scholar]
- [8].a) Patterson GH, Lippincott-Schwartz J. Science. 2002;297:1873. doi: 10.1126/science.1074952. [DOI] [PubMed] [Google Scholar]; b) Chudakov DM, Belousov VV, Zaraisky AG, Novoselov VV, Staroverov DB, Zorov DB, Lukyanov S, Lukyanov KA. Nat. Biotechnol. 2003;21:191. doi: 10.1038/nbt778. [DOI] [PubMed] [Google Scholar]
- [9].a) Gurskaya NG, Verkhusha VV, Shcheglov AS, Staroverov DB, Chepurnykh TV, Fradkov AF, Lukyanov S, Lukyanov KA. Nat. Biotechnol. 2006;24:461. doi: 10.1038/nbt1191. [DOI] [PubMed] [Google Scholar]; b) Ando R, Hama H, Yamamoto-Hino M, Mizuno H, Miyawaki A. Proc. Natl. Acad. Sci. U. S. A. 2002;99:12651. doi: 10.1073/pnas.202320599. [DOI] [PMC free article] [PubMed] [Google Scholar]; c) Subach OM, Patterson GH, Ting LM, Wang Y, Condeelis JS, Verkhusha VV. Nat. Methods. 2011;8:771. doi: 10.1038/nmeth.1664. [DOI] [PMC free article] [PubMed] [Google Scholar]
- [10].a) Li WH, Zheng G. Photochem. Photobiol. Sci. 2012;11:460. doi: 10.1039/c2pp05342j. [DOI] [PMC free article] [PubMed] [Google Scholar]; b) Zhao Y, Zheng Q, Dakin K, Xu K, Martinez ML, Li WH. J. Am. Chem. Soc. 2004;126:4653. doi: 10.1021/ja036958m. [DOI] [PubMed] [Google Scholar]; c) Kobayashi T, Urano Y, Kamiya M, Ueno T, Kojima H, Nagano T. J. Am. Chem. Soc. 2007;129:6696. doi: 10.1021/ja070376d. [DOI] [PubMed] [Google Scholar]; d) Warther D, et al. J. Am. Chem. Soc. 2010;132:2585. doi: 10.1021/ja9074562. [DOI] [PubMed] [Google Scholar]; e) Belov VN, Wurm CA, Boyarskiy VP, Jakobs S, Hell SW. Angew. Chem., Int. Ed. 2010;49:3520. doi: 10.1002/anie.201000150. [DOI] [PubMed] [Google Scholar]; f) Link KH, Shi Y, Koh JT. J. Am. Chem. Soc. 2005;127:13088. doi: 10.1021/ja0531226. [DOI] [PMC free article] [PubMed] [Google Scholar]; g) Mayer G, Heckel A. Angew. Chem. Int. Ed. 2006;45:4900. doi: 10.1002/anie.200600387. [DOI] [PubMed] [Google Scholar]
- [11].Lukyanov KA, Chudakov DM, Lukyanov S, Verkhusha VV. Nat. Rev. Mol. Cell Biol. 2005;6:885. doi: 10.1038/nrm1741. [DOI] [PubMed] [Google Scholar]
- [12].Lo Celso C, Fleming HE, Wu JW, Zhao CX, Miake-Lye S, Fujisaki J, Cote D, Rowe DW, Lin CP, Scadden DT. Nature. 2009;457:92. doi: 10.1038/nature07434. [DOI] [PMC free article] [PubMed] [Google Scholar]
- [13].a) Weissleder R, Kelly K, Sun EY, Shtatland T, Josephson L. Nat. Biotechnol. 2005;23:1418. doi: 10.1038/nbt1159. [DOI] [PubMed] [Google Scholar]; b) Lewin M, Carlesso N, Tung CH, Tang XW, Cory D, Scadden DT, Weissleder R. Nat. Biotechnol. 2000;18:410. doi: 10.1038/74464. [DOI] [PubMed] [Google Scholar]; c) Kobayashi H, Ogawa M, Kosaka N, Choyke PL, Urano Y. Nanomedicine (Lond) 2009;4:411. doi: 10.2217/nnm.09.15. [DOI] [PMC free article] [PubMed] [Google Scholar]; d) Saha K, Agasti SS, Kim C, Li X, Rotello VM. Chem. Rev. 2012;10 doi: 10.1021/cr2001178. 1021/cr2001178. [DOI] [PMC free article] [PubMed] [Google Scholar]; e) Bhirde A, Xie J, Swierczewska M, Chen X. Nanoscale. 2011;3:142. doi: 10.1039/c0nr00493f. [DOI] [PMC free article] [PubMed] [Google Scholar]; f) Agasti SS, Chompoosor A, You CC, Ghosh P, Kim CK, Rotello VM. J. Am. Chem. Soc. 2009;131:5728. doi: 10.1021/ja900591t. [DOI] [PMC free article] [PubMed] [Google Scholar]
- [14].a) Keliher EJ, Yoo J, Nahrendorf M, Lewis JS, Marinelli B, Newton A, Pittet MJ, Weissleder R. Bioconjugate Chem. 2011;22:2383. doi: 10.1021/bc200405d. [DOI] [PMC free article] [PubMed] [Google Scholar]; b) Nahrendorf M, Keliher E, Marinelli B, Leuschner F, Robbins CS, Gerszten RE, Pittet MJ, Swirski FK, Weissleder R. Arterioscler., Thromb., Vasc. Biol. 2011;31:750. doi: 10.1161/ATVBAHA.110.221499. [DOI] [PMC free article] [PubMed] [Google Scholar]; c) Nahrendorf M, et al. Proc. Natl. Acad. Sci. U. S. A. 2010;107:7910. doi: 10.1073/pnas.0915163107. [DOI] [PMC free article] [PubMed] [Google Scholar]; d) Daldrup-Link HE, et al. Clin. Cancer Res. 2011;17:5695. doi: 10.1158/1078-0432.CCR-10-3420. [DOI] [PMC free article] [PubMed] [Google Scholar]
- [15].a) Tassa C, Shaw SY, Weissleder R. Acc. Chem. Res. 2011;44:842. doi: 10.1021/ar200084x. [DOI] [PMC free article] [PubMed] [Google Scholar]; b) Pittet MJ, Swirski FK, Reynolds F, Josephson L, Weissleder R. Nat. Protoc. 2006;1:73. doi: 10.1038/nprot.2006.11. [DOI] [PubMed] [Google Scholar]; c) Zhao M, Kircher MF, Josephson L, Weissleder R. Bioconjugate Chem. 2002;13:840. doi: 10.1021/bc0255236. [DOI] [PubMed] [Google Scholar]
- [16].Pollard JW. Nat. Rev. Cancer. 2004;4:71. doi: 10.1038/nrc1256. [DOI] [PubMed] [Google Scholar]
- [17].Beckmann N, Cannet C, Babin AL, Ble FX, Zurbruegg S, Kneuer R, Dousset V. Wiley Interdiscip. Rev. Nanomed. Nanobiotechnol. 2009;1:272. doi: 10.1002/wnan.16. [DOI] [PubMed] [Google Scholar]
- [18].Cortez-Retamozo V, et al. Proc. Natl. Acad. Sci. U. S. A. 2012;109:2491. doi: 10.1073/pnas.1113744109. [DOI] [PMC free article] [PubMed] [Google Scholar]
- [19].Agasti SS, Liong M, Tassa C, Chung HJ, Shaw SY, Lee H, Weissleder R. Angew. Chem., Int. Ed. 2012;51:450. doi: 10.1002/anie.201105670. [DOI] [PMC free article] [PubMed] [Google Scholar]
- [20].a) Devaraj NK, Weissleder R. Acc. Chem. Res. 2011;44:816. doi: 10.1021/ar200037t. [DOI] [PMC free article] [PubMed] [Google Scholar]; b) Devaraj NK, Hilderbrand S, Upadhyay R, Mazitschek R, Weissleder R. Angew. Chem., Int. Ed. 2010;49:2869. doi: 10.1002/anie.200906120. [DOI] [PMC free article] [PubMed] [Google Scholar]
- [21].Pittet MJ. Curr. Opin. Oncol. 2009;21:53. doi: 10.1097/CCO.0b013e32831bc38a. [DOI] [PMC free article] [PubMed] [Google Scholar]
- [22].a) Kang B, Mackey MA, El-Sayed MA. J. Am. Chem. Soc. 2010;132:1517–1519. doi: 10.1021/ja9102698. [DOI] [PubMed] [Google Scholar]; b) Wang L, Liu Y, Li W, Jiang X, Ji Y, Wu X, Xu L, Qiu Y, Zhao K, Wei T, Li Y, Zhao Y, Chen C. Nano Lett. 2011;11:772. doi: 10.1021/nl103992v. [DOI] [PubMed] [Google Scholar]
Associated Data
This section collects any data citations, data availability statements, or supplementary materials included in this article.


