

Abstract
In vertebrate eyes, the rod photoreceptor has a modified cilium with an extended cylindrical structure specialized for phototransduction called the outer segment (OS). The OS has numerous stacked membrane disks and can bend or break when subjected to mechanical forces. The OS exhibits axial structural variation, with extended bands composed of a few hundred membrane disks whose thickness is diurnally modulated. Using high-resolution confocal microscopy, we have observed OS flexing and disruption in live transgenic Xenopus rods. Based on the experimental observations, we introduce a coarse-grained model of OS mechanical rigidity using elasticity theory, representing the axial OS banding explicitly via a spring-bead model. We calculate a bending stiffness of ∼105 nN⋅μm2, which is seven orders-of-magnitude larger than that of typical cilia and flagella. This bending stiffness has a quadratic relation to OS radius, so that thinner OS have lower fragility. Furthermore, we find that increasing the spatial frequency of axial OS banding decreases OS rigidity, reducing its fragility. Moreover, the model predicts a tendency for OS to break in bands with higher spring number density, analogous to the experimental observation that transgenic rods tended to break preferentially in bands of high fluorescence. We discuss how pathological alterations of disk membrane properties by mutant proteins may lead to increased OS rigidity and thus increased breakage, ultimately contributing to retinal degeneration.
Introduction
Rod photoreceptors are abundant light-sensitive cells in the retina responsible for dim light vision (1). These cells are composed of an inner segment (IS) with intracellular organelles, and a cylindrical outer segment (OS). The OS, elaborated at one end of the rod photoreceptor, is a cylindrically shaped organelle composed of thousands of membrane disks highly specialized for phototransduction. The unique structure of the OS and high metabolic demands for maintaining it, as well as cost of phototransduction, make it highly susceptible to disruption (see Discussion and Conclusions). In fact, mutations in many rod-specific genes destabilize the OS or trigger stress responses that eventually lead to cell death, retinal degeneration, and blindness in humans (2). The basic structural unit of the OS is a disk, which is composed of two closely apposed lipid bilayer membranes that together are 6–8 nm thick, with enormous quantities of the integral membrane protein rhodopsin (∼106 proteins per membrane disk) (3–8). The OS is composed of a regular stack of these disks (Fig. 1 A) with an inter-disk spacing of 5–12 nm (9), aligned along many deep incisures (10). Within each disk, rhodopsin is homogeneously distributed except in the terminal loop regions (10–12). In many species such as frog, rabbit, cow, rat, and human, the OS disks are linked via flexible spacers mostly along their incisures and on the rim (10–17). However, in mouse, where a single incisure exists, the spacers linking the membrane disks are spaced regularly throughout the disks with a distance of ∼14 nm from each other (9,11). Thus, a common feature of all rods is the connection between the OS membrane disks by flexible linkers, regardless of their organization (11).
Figure 1.
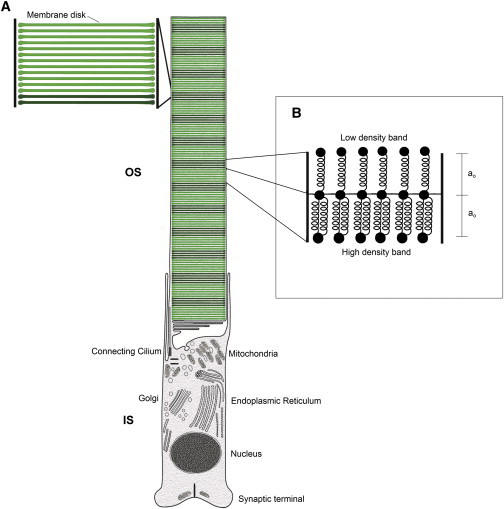
(A) Illustration of the rod photoreceptor internal structure. The inner segment (IS) is the lower part with intracellular organelles. The outer segment (OS) is the top cylindrical part shown with the multilayered structure. Each horizontal line shows a lipid bilayer disk 6–8-nm thick (closeup shown on the left). The axial inhomogeneity observed under polarized light is shown as alternating dark and bright groups of membrane disks; each dark or bright group represents a density band, which contains between 100 and 300 lipid bilayer disks in an actual OS. (B) The spring-bead model for the OS density bands. The springs represent the density bands. Springs of equal length a0 and spring constant k connect the beads in neighboring bands. High-density bands have larger number of springs compared to low-density bands. Thicker density bands have j layers of springs, as discussed in the main text.
There appears to be a structural feature that extends across many OS disks. This was originally observed in frogs as an axial inhomogeneity of the OS under polarized light, as alternating dark and bright birefringence bands in isolated and fixed amphibian rod OS (18–23), and was first reported by Kaplan (20). This feature has been subsequently found in many species including rat, guinea pig, rabbit, dog, and monkey (19,20,24). These bands are ∼1.0–1.6 μm in height, each containing between 100 and 300 membrane disks, and are perpendicular to the OS axis. The banding pattern (thickness and spatial frequency) are influenced by the diurnal cycle. In constant light or dark, no birefringence banding is observed (23). While this banding pattern arises from an inhomogeneity in the OS structure involving many disks, its origin has not yet been established.
Recently, we characterized a related axial OS inhomogeneity in Xenopus using a fluorescently tagged rhodopsin transgene (rhodopsin-eGFP) (22,25–27) under control of the rhodopsin promoter (28) (see Materials and Methods). Transgenic Xenopus expressing rhodopsin-eGFP have a fluorescent banding similar to the banding pattern previously explained in wild-type rod OS (23). Regardless of the origin of the banding inhomogeneities demonstrated by Kaplan and those shown in transgenic species expressing rhodopsin-eGFP, we observed similar axial variations in both Kaplan and fluorescent banding:
-
1.
Constant dark-rearing of tadpoles resulted in simultaneous loss of both types of banding.
-
2.
Variations in the inhomogeneity along the OS axis in both types of banding were in-phase, suggesting the common origin of Kaplan and fluorescent banding (25,26).
These similarities allow an investigation of the effects of banding density variation along the OS using high-resolution live imaging techniques. The density of the tagged protein along the OS axis fluctuated ∼30% when animals were kept in 12 h/12 h light/dark cycle, and were larger when the light cycle was extended (Fig. 2). The higher fluorescence intensity regions thus contain a higher density of tagged rhodopsin, which are made during the dark cycle, while the lower density bands are made during the light cycle. Quantitative analysis of transgene concentration showed that the tagged rhodopsin was expressed at 0.1–1% of the endogenous gene (26). Thus, the tagged transgene offers a tracer to study how axial variation influences OS mechanical properties using high-resolution imaging techniques. We assume both birefringence and fluorescent transgene axial variation reflect similar underlying axial variation in OS properties, which hereafter will be termed density banding.
Figure 2.
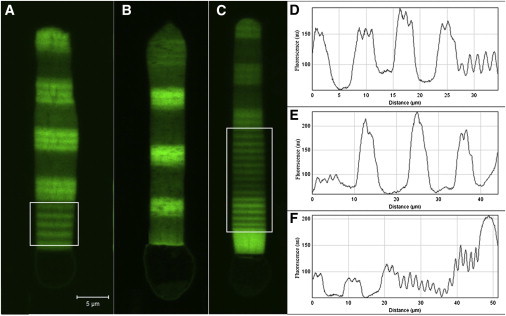
Banded structure of the OS. The thicknesses and densities of the bands depend on the amount of light received by the animal. (A–C) Show the OS with different periods of light/dark adaptation; (A) the upper part of the OS has bands of equal thickness which are formed in equal light/dark periods of three days each. These bands are thicker than the bands formed in the lower part of this OS (inside the white box); those are thin bands formed in 12 h/12 h light/dark cycle. The thin and dim bands that are within the upper thick bands in this OS are formed because the animal was not kept in absolute darkness. (B) Thick bands are formed in a period of three days dark and four days light. This picture shows thicker low-density bands which form in light-receiving periods. (C) The lower part of the OS (inside the white box) has bands which are formed in equal 12 h/12 h light/dark periods, where the bands are very thin and equal in thickness. The upper part of this OS has bands which have formed in seven-days dark-adapted animals. (D–F) Fluorescent intensity plots of the bands along the OS length; plot D corresponds to the rod shown in panel A, E corresponds to B, and F corresponds to C. These plots show the periodicity in the intensity of bands (depending on the light/dark cycle), and the increase of ∼1.3 in the fluorescent intensities of high-density bands compared to low-density bands. Scale bar is 5 μm.
In this work, we used confocal imaging to characterize OS expressing rhodopsin-eGFP protein during bending and breaking, and we used the elasticity theory to study and model the flexibility of the OS, which have alternating high- and low-density banding. From the imaging results, we developed a coarse-grained model including the effect of density banding on OS mechanical stability and flexibility. In our model, each density band (observed as banding of the fluorescently tagged proteins) contains between 100 and 300 lipid bilayer membrane disks, with their associated spacer linkers, which are in a series configuration with each other. Using our theoretical model, we calculated the flexural rigidity of the OS, which is a measure of its structural stability and its response to mechanical forces. The flexural rigidity represents the rod’s resistance to bending, and is the proportionality constant which relates the torque exerted on a flexible thin rod to its curvature for slight bending (29,30). This is similar to Hooke’s law for a spring. The bending stiffness of the OS in our model is completely defined by the structure, density, and bond strength among its density bands. The OS flexural rigidity can be measured experimentally by measurements of the OS deflection in response to a calibrated external transverse force. Such an experiment has not been conducted before to our knowledge, and therefore the results of this article provide the first theoretical estimate for this parameter.
In the Experimental Observations section, we describe our observations of the bending and breakage of the OS. In the Model and Theory section, we introduce a theoretical model of the OS as a beam with periodic high and low density bands (representing the banding of the fluorescently tagged proteins), and derive an analytical relation for the Young's modulus and the bending stiffness with explicit dependence on the banded structure and on the geometry of the beam. In the subsequent section, we use our experimental data to calculate the OS bending stiffness, and we discuss the validity of our results. We then investigate OS breakage and its coincidence with high density bands. We find that the breakage is triggered at a critical force, and we apply our model to experimental observations of the OS breakage. In the Discussion and Conclusion section, we examine our theoretical results, compare them to experimental observations, and finally discuss the limitations of our model.
Materials and Methods
Transgenic animals
Transgenic tadpoles were produced, according to the standard procedure, to incorporate the desired gene into the genome of Xenopus sperm, using restriction enzyme-mediated integration (REMI) (22) with some modifications (26,31,32). All steps were performed in a similar way for all animals. All animal handling and experiments were in agreement with the animal care and use guidelines at the Association for Research in Vision and Ophthalmology (Rockville, MD), approved by the Institutional Animal Care and Use Committee (IACUC), and by the Committee on the Humane Use of Animals (CHUA).
Imaging chamber and live cell imaging protocol
The recording chamber was made in the center of a 5-cm plastic Petri dish as described in Peet et al. (33); a No. 1 coverslip covered the bottom of the chamber for the access of the microscope lenses. Retinal chips were minced into small pieces and placed into the chamber with Ringer’s solution (111 mM NaCl, 2 mM KCl, 1 mM CaCl2, 1 mM MgCl2, 0.5 mM MgSO4, 0.5 mM NaH2PO4, 3 mM HEPES, 10 mM glucose, and 0.01 mM EDTA). The chamber was covered by a No. 1 coverslip and placed onto the microscope stage for imaging. All imaging was performed at 20°C. The basal ends of most of the rods were attached to the substrate, and a directional flow present in the chamber exerted a force to the free end of rods, which lead to rotation, movement, and occasional bending and breakage of rods. Images for quantification of transgenic proteins expressed in rod photoreceptors were acquired using the LSM-510 software driving a confocal LSM-510 imaging system (Carl Zeiss, Peabody, MA). Retinal chips placed in frog Ringers solution were scanned by a laser line of 488 nm. The scanning objective was a Plan-Neouar 63×/1.4 oil lens (Zeiss). The emitted light from 488-nm excitation was put through a 500–535 nm band-pass filter. The resolution of all scanned images was set to 0.04 × 0.04 μm in xy plane for images used for quantifications. At least five z scans from the central area of rod photoreceptor with a 0.5-μm interval were obtained.
Experimental Observations
We characterized a quantity of >265 rod photoreceptors by live confocal imaging, and we selected 43 to study further. These rods were selected for a clear order in their banded structure, and were used to build the model discussed in the Model and Theory section. They all have OS lengths ∼60 μm, and diameters between 4.5 and 6.5 μm. These rods are placed in a solvent with viscosity η ∼1.02 mPa⋅s. The thickness of high- and low-density bands vary between 0.5 and 1.6 μm. Most of the OS were intact and had a minimal deflection of ±0.2 μm due to random movements of the OS tips; they showed slight curvatures, but no distortions or breakages were observed. Upon exertion of a unidirectional force, the OS curvature increases and can lead to breakage (see Materials and Methods). We observed eight distorted and broken OS, with five broken OS occurring before dissociation—each of which showed a totally altered internal structure, and three OS at the onset of breakage (shown in Figs. 3 and 4).
Figure 3.
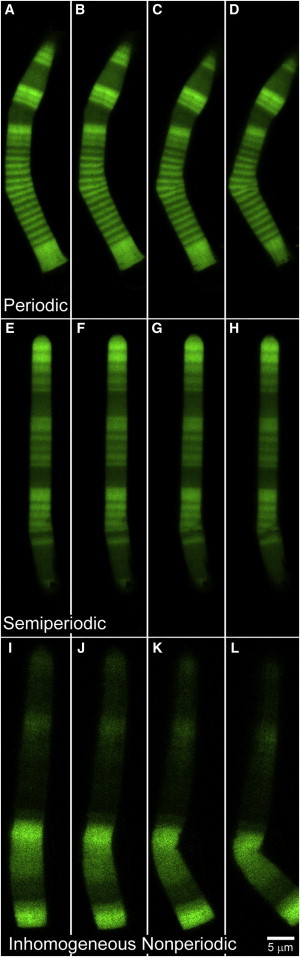
Bending sequence of the OS. (A–D) A periodic OS formed in 12 h/12 h light/dark cycle. The bending in the OS increases from left to right until it breaks within a high-density band (closeup is shown in Fig. 4). Time between consecutive images is 2.6 s. (E–H) A semiperiodic OS formed in five days dark and two days light cycle. The bending and breakage of the OS is seen in consecutive images with time interval of 1.6 s. (I–L) An inhomogeneous nonperiodic OS bends and breaks from left to right. The breakage occurs within a high-density band. The time interval between consecutive images is 6.7 s. Scale bar is 5 μm.
Figure 4.
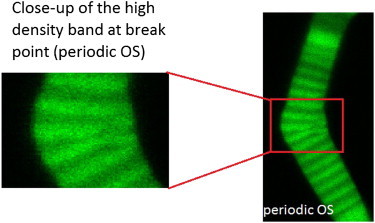
Alteration of density bands are shown in a closeup picture of the broken band in the periodic OS of Fig. 3 (A–D). The internal structure of the high-density band is altered in the orthogonal direction to bend.
The onset of breakage was identified by the time-lapse images having a slight bending at the beginning followed by a sudden increase in the deflection and an alteration of the internal structure, which we define as breakage. Fig. 3, A–D, shows an example of the breakage phenomenon in a periodic OS (we study the lower part of this OS). The periodic OS is defined as having equal thicknesses of low- and high-density bands, similar to the lower part of the OS shown in Fig. 2 C. These bands were formed in a 12 h/12 h light/dark cycle. In the set of images in Fig. 3, A–D, the bending increases from left to right until the OS breaks within a high density band. The breaking point corresponds to the critical force, which is discussed in Theoretical Model Applied to Experimental Observations. A closeup of the breakage in the periodic OS of Fig. 3, A–D, is shown in Fig. 4, where the internal structure is altered within the high-density band, orthogonal to the OS axis. Fig. 3, E–H, shows a breaking semiperiodic OS, which we define as an OS with unequal thicknesses of low- and high-density bands due to unequal light/dark cycles. Here, we see an increase of bending in a high-density band which leads to breakage. Fig. 3, I–L, shows an inhomogeneous nonperiodic OS, defined as having a very thick high-density band compared to its low-density bands, and lacking a repeating banded structure. This OS also bent within a high-density band and broke.
We analyzed the deflections and the bending sequences for each of the above OS using confocal images. The OS is in the xy plane with its long axis in the y direction; the z axis is out of the page. The external force acts on the OS free-end in the x direction, as shown in the schematic of Fig. 5. The OS deflection, ξ, is defined as the displacement of the OS tip, in the x direction, with respect to a reference line passing through the center of the unaltered part of its body. The deflection can be measured from confocal images of the OS. For consistency, we measure ξ at 6 μm above the bend. We then plot and compare the deflection-versus-time curves of the three OS of Fig. 3. This is shown in Fig. 6. Fig. 6 A shows the deflection of the periodic OS (shown in Fig. 3, A–D), with equal high- and low-density bands. This OS has two bends—one in a high-density band (dots in Fig. 6 A) and the other in a low-density band (circles in Fig. 6 A). The OS bends from both regions until it breaks in a high-density band (shown by the dotted vertical line in Fig. 6 A).
Figure 5.
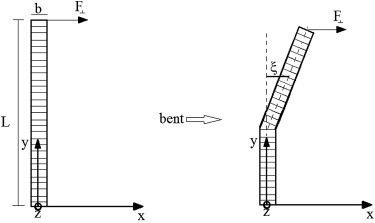
Schematic of an OS and its banded structure. The OS is fixed at its lower end. Upon exertion of a transverse force F to its free-end, it bends and the deflection ξ is measured in the direction of bend with respect to the reference line (dotted line in y direction).
Figure 6.
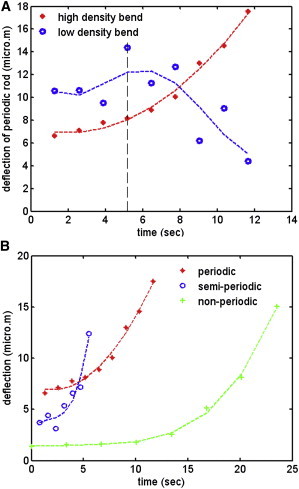
Deflection curves for OS with different types of internal structure. (A) A periodic OS with L = 59.3 μm, b = 4.15 μm. This OS has two bends—one in the high-density band (dots) and one in the low-density band (circles). (Vertical dashed line) Point of break, after which the low-density bend recovers while the high-density bend leads to a breakage. (B) The high-density bend of the periodic OS (dots), a semiperiodic OS bending in a high-density band (circles) with L = 60.9 μm, b = 5.58 μm, and an inhomogeneous nonperiodic OS bending in a high-density band (stars) with L = 58.2 μm, b = 6.17 μm.
After the high-density band breaks, the low-density band starts to recover its original shape, observed as the decrease in its deflection while the bend in the high-density band continues (images of both bends, with angles, are shown in Fig. 7 with time intervals of 2.6 s (see Movie S1 in the Supporting Material)). Fig. 6 B compares the deflections of all three types of OS, which bend in a high-density band (periodic, dots; semiperiodic, circles; and inhomogeneous nonperiodic, stars). The semiperiodic rod has high-density bands that are thicker than its low-density bands. In this case, the deflection increases slowly until the OS breaks, after which it bends faster and more significantly, as also shown in Fig. 3, E–H.
Figure 7.
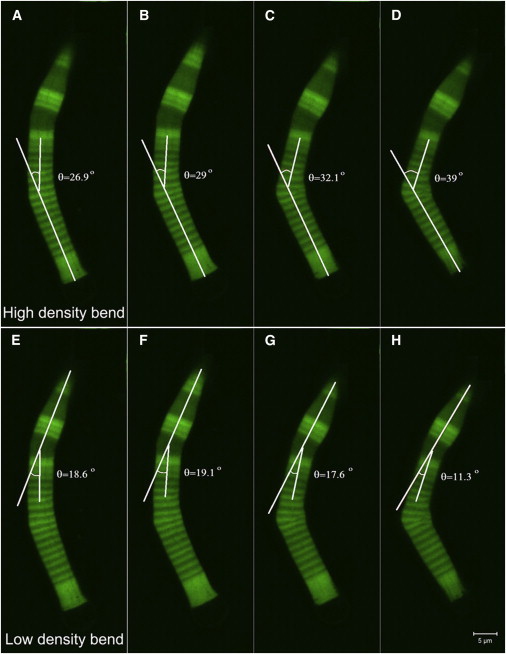
Bending angles in a bent OS. The time interval between consecutive images is 2.6 s. (A–D) Bend in a high density region with a periodic structure. (E–H) Bend in a low-density region with a semiperiodic structure. The angles are measured with respect to the stationary lower and upper ends of the OS in each case. In each set of images, the bending increases from left to right, with the high-density region showing a larger bend under stress. Finally the internal structure of the OS gets distorted within a high-density band, and the OS breaks at that point. The bending in the low-density band recovers and no breaking is observed in that band. Scale bar is 5 μm (see Movie S1 in the Supporting Material).
The inhomogeneous nonperiodic OS, which has the thickest high-density band compared to the other two OS, breaks at the smallest deflection, showing that it has the least flexibility. After breaking, it continues to bend by a large amount, as also shown in Fig. 3, I–L. All three OS shown in Fig. 6 B show a sharp increase in deflection after breakage. This implies the alteration of their internal structure after breakage, which leads to a decrease in their resistance to bending. To analyze the bending and breakage pattern observed experimentally in the OS, we present a theoretical model of the system in the next section.
Model and Theory
Lipid bilayer membranes have been previously modeled as layers containing beads and springs (34). In our system, the OS contains lipid bilayer membranes that are connected to each other via flexible spacer linkers (11); therefore, we introduce a modified coarse-grained model that represents each density band (of 100–300 lipid bilayer membranes and their associated spacer linkers) with one set of beads and springs. This model takes into account the banding structure of the OS by using different number of springs as an identifier for different densities in each band, so larger number of springs represents higher density bands, as observed in the confocal images, and vice versa. Each density band has a set of parallel springs characterizing the elastic structures of the 100–300 bilayer membranes and their associated spacer linkers in that band. Our model can make numerical predictions for the OS bending stiffness, as well as for the critical force required to break the OS.
We model the rod photoreceptor OS as a cylindrical beam of total length L and cross-section area A = πr2, where r is the radius. We assume the beam is composed of bands which have two sets of beads axially connected via n parallel springs of equal equilibrium length a0 and equal spring constant k. Therefore, a0 is also the equilibrium length of each band (a0 is set equal to the thickness of each density band measured from confocal images of the OS). A schematic of the inhomogeneous beam is shown in Fig. 1 B, where high and low density bands have different number of springs, as it will be discussed in the Inhomogeneous Beam subsection, below. The dimensionless Reynolds number, which represents the ratio of inertial to viscous forces on the rods, is defined as Re = ρLv/η (35). Here ρ and η are the density and viscosity of the solvent, respectively, and v ∼ 10−6 μm/ms is the speed of motion of the rods in the solvent. For rod photoreceptors, Re ≪ 1, so inertial forces can be neglected. External forces can deform the beam by bending it when the forces are orthogonal to its axis, and/or by stretching it when the forces are parallel to its axis. In either case, the total deformation of the beam can be written as the sum of the deformations of individual bands containing beads and springs. We first study the simplest case of an homogeneous beam. We then build complexities into our model to enable a discussion of the inhomogeneous case relating to rod photoreceptors OS.
Homogeneous beam
We modeled an homogeneous beam containing beads and springs. In this case, all bands have the same number of springs, n, and the same thickness, a0. We started by calculating the spring constant of each band, which is equal to the sum of individual springs in that band with a parallel configuration as kband = Σ n i=1 ki = nk, where ki = k everywhere in each band and along the beam. We assumed there are N = L/a0 bands along the beam with an equal number of springs in each band. Therefore, the effective spring constant of the beam is keff = nk/N. For a small force exerted on the beam that can result in both bending and stretching at the microscopic level, the springs in each band obey Hooke’s law, F = −kband Δa, where Δa is the length change of each spring, which can be positive or negative depending on the direction of bend and/or stretch. Therefore, the total stress applied to the beam is written as
| (1) |
where ε = ΔL/L = Δa/a0 is the strain in the beam, and the coefficient
| (2) |
is the Young’s modulus (30). The significance of Eq. 2 is in the explicit dependence of Y on the spring constant and the equilibrium length of the springs, which are the parameters of our model system. Eq. 1 is the stress-strain relation for an homogeneous beam written as a function of the Young’s modulus of the system. It applies only when the bands have the same properties along the length of the beam, and shows the linear response of an homogeneous beam to small deformations along its length. However, as discussed earlier, OS are inhomogeneous along their lengths (23,25,26). This inhomogeneity is observed in the form of bandings, which are primarily identified by different densities of fluorescently labeled proteins in the OS, as shown in Fig. 2. Therefore, in the next subsection we will study the mechanical response of an inhomogeneous beam.
Inhomogeneous beam
The banded structure of the inhomogeneous beam, representing an OS, is shown in the schematic of Fig. 1 B. These bands, which have different number of springs, represent the light and dark bands observed experimentally with different fluorescent intensities (compare to Fig. 2). We define the density variations along the length of the inhomogeneous beam as different number of springs in the low and high density bands, nL/H, where nL < nH. These are related to n of the homogeneous beam via n = (nL + nH)/2. By doing a similar analysis to the homogeneous case, we obtain the spring constant for each band of low/high density to be kL/Hband = nL/H k. A direct result of larger number of parallel springs in higher density bands is higher resistance to bending or stretching, therefore kHband > kLband. Therefore we can then set the parameter representing the inhomogeneity in our model system as the number of springs in the density bands nL/H.
The relation for the effective spring constant of the inhomogeneous beam is obtained by setting high- and low-density bands in a series configuration along the length of the beam. To write the effective spring constant, we also have to take into account different thicknesses of high- and low-density bands by making the following assumptions:
Assumption 1. High- and low-density bands alternate so the total number of bands is always N = NH + NL, where NH/L represents the number of high/low-density bands along the beam, respectively.
Assumption 2. For thicker bands, we assume more than one layer of springs exist in a single density band, so we have NH = jNL, with j > 0.
Assumption 3. High-density bands contain nH springs, where nH = pnL and p ≥ 1. We can therefore use the addition rule for springs in a series configuration to obtain the effective spring constant of the inhomogeneous beam as
| (3) |
We substitute NH = jNL, kL/Hband = nL/H k, and nH = pnL in Eq. 3, and obtain the following relation for the effective spring constant of the inhomogeneous beam (see Section S1 in the Supporting Material):
| (4) |
The case of p = 1 means same densities of high and low within the bands (nH = nL), where we have NH = NL = N/2 and therefore keff = nk/N, which is the effective spring constant of an homogeneous beam, also obtained in the previous subsection. For a periodic beam, in which high- and low-density bands have equal thicknesses with j = 1, we get keff = (nLk/NL) p/(p+1), where the inhomogeneity enters keff through the density ratio of bands p. We can write the general form of the Young’s modulus, which is related to the effective spring constant of the inhomogeneous beam via the relation Y = (L/A) keff, as (see Section S2 in the Supporting Material),
| (5) |
where we use L = Na0, A = πr2, and keff from Eq. 4. Therefore, Y depends on the thickness and density of bands via the parameters j and p, respectively. Eq. 5 is an important outcome of our theoretical model, showing the explicit dependence of the Young’s modulus on the parameters of the beam, which are the densities of the bands, the bands’ thicknesses, and the radius of the beam. For the homogeneous beam where p = 1, Eq. 5 reduces to Eq. 2. For a periodic beam with j = 1, we obtain Y = (2nLa0k/(πr2)) p/(p+1), where the inhomogeneity of the beam enters the Young’s modulus through the density ratio p, as expected. Therefore, Eq. 5 demonstrates how the inhomogeneity of the material affects the Young’s modulus and the response of the beam to external forces.
Once we have the Young’s modulus, we can obtain the bending stiffness from the beam equation M = (YI) κ. Here M is the torque and κ = 1/R(s) is the curvature of the rod, where R(s) is the radius of curvature at point s along the rod (29,30). The bending stiffness of the rod is the proportionality constant in the beam equation, which is kb = YI (30,35). Because OS are anisotropic, we can only approximate their bending stiffness in this model as we separate the Young’s modulus and the bending moment, which is a good approximation used for other systems such as microtubules and actin filaments (36). We use Eq. 5 for Y and the relation for the geometric moment I for a beam with circular cross-section of radius r as
| (6) |
and obtain the following relation for the bending stiffness (see Section S3 in the Supporting Material):
| (7) |
In the case of an homogeneous beam with p = 1, Eq. 7 becomes kb = na0r2k/4, and for a periodic beam with j = 1, it depends on the variable p via the relation kb = (nLa0r2k/2) p/(p+1). The outcome of our theoretical analysis is summarized in Eq. 7, which gives kb in terms of the structural properties of the inhomogeneous beam. Eq. 7 implies that thinner beams (smaller r) have smaller resistance to bending and therefore are more flexible; it also shows that the flexural rigidity varies linearly with the spring number density (representing the fluorescent intensity of the bands) and with the thickness of the bands. For a given OS, the parameters a0 (equilibrium thickness of each band), nL (average number of springs in a low density band, estimated from the intensity plot of each OS), r (OS radius), and k (the spring constant; see Theoretical Model Applied to Experimental Observations, below), are constants which can be obtained from confocal images of the OS, and the variable parameters are j and p, which define the OS inhomogeneity. Fig. 8 shows the dependence of kb on each of the variable parameters j and p. It shows that:
-
1.
For an homogeneous OS with constant density along its length (p = 1), bending stiffness is independent of the banding thickness ratio j (dashed line);
-
2.
By increasing the high- to low-density ratio of the bands (p > 1), the value of kb increases with a rate which depends on the banding thickness ratio j; and
-
3.
The value of kb increases for small values of j, and becomes almost steady for larger j.
The plateau shows that the bending stiffness becomes constant for j > 5, where the inhomogeneous OS responds to external forces similar to an homogeneous high density OS. In this case, the flexibility introduced by low-density bands becomes negligible and the OS becomes very rigid. These results are in agreement with our experimental observations where OS with thicker high-density bands are less flexible, and show more breakage; this will be further discussed in Theoretical Model Applied to Experimental Observations section, below.
Figure 8.
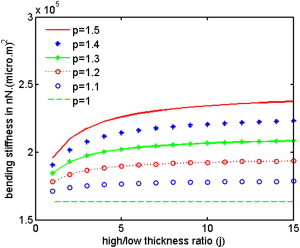
Bending stiffness, kb, as a function of the parameter j representing the ratio of high/low-density band thicknesses, for different density ratios p. An increase in j means thicker high-density bands compared to low-density bands. The bending stiffness increases with the density ratio p.
To place our results in context of other studies on the structural rigidity of biological substructures (37–41), we rewrite Eq. 7 in the general form of kb = (π/4) Yr4, where the structural details of the beam are absorbed in the Young’s modulus. This general bending rigidity has the same form as that used for other systems such as bundles of actin filaments (42). However, the importance of Eq. 7, as written in this work, lies in its explicit dependence on the internal structure of the beam that is on the properties of each band and the springs within it, as well as the beam’s geometry. Therefore, Eq. 7 can make predictions of the flexural rigidity of rod photoreceptor OS when their structural properties are known. In the following section, we will use confocal images of several OS to obtain the values of a0, nL, r, k, j, and p, and we calculate the bending stiffness using Eq. 7.
Theoretical Model Applied to Experimental Observations
Flexural rigidity
In this section, we obtain the flexural rigidity of rod photoreceptors OS using our theoretical model developed in the Model and Theory section, and by analyzing the bending sequence observed experimentally (25,26). To find the bending stiffness from Eq. 7, we need to extract different values of parameters from the confocal images, as described in the previous section. The spring constant, k, is the same for all OS because it is an intrinsic property of the OS bands and does not depend on the thickness or density of the bands. It is estimated using the elastic energy of the lipid bilayer membrane, which is 10–20 kBT, where kB is the Boltzmann constant and T is the experimental temperature. We calculated this spring constant as k = 2.49 × 10⁻³ N/m. We made the required measurements from a total of 43 OS, where 15 have a periodic structure, 15 have a semiperiodic structure, and 13 are inhomogeneous nonperiodic. To study the effect of the banding structure of the OS on its flexural rigidity, we have chosen rods with comparable radii of r ∼2.2–3.2 μm, but different a0 depending on their structural order. The periodic OS have the thinnest density bands with a0 ∼0.5–0.7 μm, the density bands in the semiperiodic OS have an intermediate thickness of a0 ∼0.7–1.0 μm, and the inhomogeneous nonperiodic OS have the thickest density bands with a0 ∼1.2–1.5 μm. For the periodic OS, with structures similar to Fig. 2, A–D, we use Eq. 7 to calculate an average bending stiffness of kb = 1.65 × 10⁵ nN⋅μm2 (15 rods, SD = 0.7 × 10⁵). For the semiperiodic OS, with structures similar to Fig. 2, E–H, the average bending stiffness is calculated as kb = 2.20 × 10⁵ nN⋅μm2 (15 rods, SD = 0.8 × 10⁵). For the inhomogeneous nonperiodic OS, similar to the rod shown in Fig. 2, I–L, we find an average bending stiffness of kb = 2.77 × 10⁵ nN⋅μm2 (13 rods, SD = 1.1 × 10⁵). This analysis shows the consistency of the values obtained for the OS bending rigidity from our theoretical model. It also suggests that flexibility comes with periodicity, and that the most flexible OS are those made in 12 h/12 h light/dark cycle, which are the periodic OS with the thinnest density bands.
Critical force
To calculate the breaking forces in each case of periodic, semiperiodic, and inhomogeneous nonperiodic OS, we first measured the magnitude of the random force present in the fluid—this force has magnitude of order pN, and is derived from the measurements of minimal deflections of unaltered OS. It can cause small movements of the OS as a whole but no bending or alterations of the internal structure. Next, we analyzed the OS which show deflections, by plotting and fitting third-order polynomials to their deflection-versus-length data. The third-order polynomial equation was then compared to the deflection equation of a beam (43), with one end fixed at the origin and a circular cross-section of radius r, given as
| (8) |
where F is the force, σ is the Poisson’s ratio, which depends on the moduli of compression and rigidity of rod OS, which are not known, and y is the position along the OS length. We use kb values obtained from our model in the Flexural Rigidity subsection, above. From this comparison we obtained an estimate of the magnitude of the forces needed to bend and break the OS. The transverse forces are then plotted in Fig. 9 as functions of the deflection ξ. These curves have different scales and are shown to study the response of different types of OS to external forces. The curves of Fig. 9 give insight into the process of breakage of the OS. Our first observation is that all three OS, regardless of their internal structure, show a similar and linear response to small forces; the deflection increases linearly and reversibly by increasing the transverse force until the break point is reached. This point is analogous to the elastic limit of a material under tension, after which the curve becomes nonlinear. The slopes of the linear parts of the curves are directly related to the OS bending stiffness. Beyond the break point, the deflection increases while the force remains constant (nonlinear regime), shown by the force plateau in these curves, indicating the alteration of the OS internal structures. The critical breaking force for each OS is the force corresponding to the force plateau. Beyond the nonlinear regime, the OS resistance to bending decreases, and by increasing the force the OS bends easier. Moreover, we find that the critical forces which break the OS in each case are different and depend on the OS bending stiffness. Those with larger kb values, which show a higher resistance to bending, will break at a larger force. The curves of Fig. 9 show the typical behavior seen in force-deflection/extension curves of microtubules, cilia, and flagella (44–46)—i.e., linear and reversible response for small forces followed by a nonreversible regime for F > Fbreak.
Figure 9.
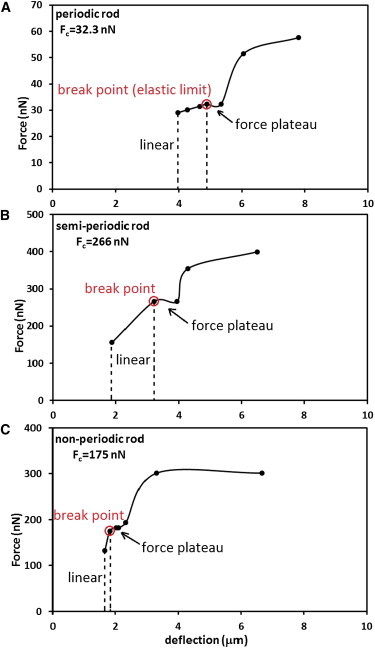
Force-versus-deflection curves for OS with different internal structures. The scales are different on the vertical axes. (A) A periodic OS with L = 59.3 μm, b = 4.15 μm, and calculated kb = 1.03 × 10⁵ nN⋅μm2. (B) A semiperiodic OS bending in a high-density band with L = 60.9 μm, b = 5.58 μm, and calculated kb = 2.13 × 10⁵ nN.μm2. (C) An inhomogeneous nonperiodic OS bending in a high-density region with L = 58.2 μm, b = 6.17 μm, and calculated kb = 3.33 × 10⁵ nN⋅μm2. The values of the critical forces in each case are shown in the plots.
Discussion and Conclusions
The highly specialized rod photoreceptors are located in the outermost layer of the vertebrate retina and mediate vision in dim light. While there is a diversity in the size and shape between different species (47), all rods are highly polarized with distinct compartments: an OS containing light-sensitive visual pigment, a narrow connecting cilium connecting the OS to the IS (35,44,48–58), and an IS containing the nucleus and synaptic terminus (Fig. 1 A). The cylindrical OS has an exceptional structure which contains hundreds of lipid bilayer membrane disks in a stack surrounded by, but not contiguous with, a plasma membrane (59). The disks are continuously generated at the base of the OS and phagocytized by the pigmented epithelium covering the apical segment of the OS. The OS disks are elaborated by invaginations of the membrane known as incisures which create lobulated perimeters. The number and depth of incisures per disk varies widely in different species, from a single one in mice and several shallow ones in primates to 8–12 deep incisures in lower vertebrates (60–62), but they all tend to align axially in terminal loop structures (10). The unique structure of rod cells may render them susceptible to mechanical injury (26).
It has long been known that the OS is a mechanically fragile structure in vitro, breaking under tension and fragmenting into smaller segments with vigorous shearing (5,63). In the experiments reported here, freshly isolated rod photoreceptors OS subjected to mild mechanical stress exhibited occasional tears in the OS bands progressing to a complete fracture of the OS in some instances (25,26). The confocal images of the OS at the breakage point show a distorted banding structure (Fig. 4). In this article, we proposed a theoretical model to describe these experimental findings, upon comparison of the theoretical model and the experimental observations:
-
1.
We noted a large number of bent but nonbroken OS with radii ∼2.2 μm, these being the thinnest rods observed experimentally. This observation suggests that the OS radius has a direct relation to its bending stiffness and that a smaller radius leads to lower fragility, as also obtained theoretically in Eq. 7.
-
2.
We also observed experimentally that periodic OS with the thinnest density bands show the smallest resistance to bending compared to the inhomogeneous nonperiodic OS with a thick high-density band. This observation suggests that thicker high-density bands will contribute to higher overall OS bending stiffness, also in agreement with our theoretical result in Eq. 7.
-
3.
Finally, we find that OS fractures occur in high-density bands which have ∼1.3 fold more fluorescent intensity compared to low-density bands. This suggests that weak points occur along the OS within the high-density bands, which are more rigid and do not bend as easily as low-density bands will (Fig. 7). This is also in agreement with our theoretical result in Eq. 7, which shows that bending stiffness increases with the number density of springs in the density bands.
Although our theoretical predictions and experimental observations agree, we cannot describe the breaking mechanism. To better understand this process, it is crucial to capture an OS within the process of breaking. However, obtaining such data is extremely challenging given the timeframe for a breakage and the limitations of the image acquisition system recording one rod at a time. In the eight broken OS, we observed deformation of the internal structure, loss in the banding ordering, and fragmentation in the high-density band orthogonal to the OS long axis, resulting in the complete severance of the OS. We predict a bending stiffness kb ∼1.65–2.77 × 10⁵ nN.μm2 for OS of ∼60 μm length and diameters between 4.5 and 6.5 μm. Although, inhomogeneous nonperiodic OS have, on average, a bending stiffness ∼1.6 times larger than the periodic OS, this variation in the bending stiffness is based on different OS radii, banding densities, and band thicknesses. A comparison between the values obtained from our model for rod photoreceptors OS and the value of the bending stiffness of cilia (∼10−2 nN⋅μm2 (44–46)) shows that OS are at least seven orders-of-magnitude stiffer than cilia. We suggest that this large difference is due to the banded structure of the OS, which is not present in typical cilia, and which makes the OS a more rigid structure compared to typical cilia. Experimental setups which can apply forces in the range of 50–200 nN perpendicular to the rod photoreceptor’s long axis can validate our theoretical results.
Shortening of the OS is often observed in retinal degeneration, including humans (2) and transgenic mice expressing mutant proteins such as peripherin, Rom-1, and rhodopsin (26,64–75). This may be a result of disturbances in biosynthesis of the OS disk membranes. Recently, we proposed that the OS may be destabilized by mutations in rhodopsin causing photoreceptor loss in vivo (26). Haeri and Knox (26) proposed that the mutant rhodopsin aggregation led to the disruption of the OS disk membrane and eventual rod photoreceptor death. To explore the observed OS disruption, a quantitative description of the mechanical properties of the OS is required. However, the biophysical natures of the forces that destabilize the OS have not been clearly established. At present, it is not well understood how mechanical pressure is transmitted within the outer retina and how it affects OS integrity. In this study, we proposed a mechanical model for the OS that permits an analysis of the OS response to external or internal mechanical forces on the structural stability of rod photoreceptors OS. The proposed model sets the stage for further evaluation of forces leading to destruction of such banding structures in the OS, and can be used to measure the fragility of rod photoreceptors expressing mutant proteins which demonstrated collapsed OS in animal models of retinal degeneration.
Acknowledgments
The authors thank Ms. Cherry M. Ignacio for providing one microscope image of a breaking inhomogeneous nonperiodic rod.
This work was supported by the Faculty Research Program grant from the State University of New York (SUNY) Cortland and The Research Foundation for SUNY on behalf of and in conjunction with SUNY-Cortland (to A.A.), the National Institutes of Health grants No. EY-11256 and No. EY-12975 (to B.E.K.), Research to Prevent Blindness (Unrestricted Grant to SUNY, Upstate Medical University, Department of Ophthalmology), Fight For Sight, and Lions of Central New York.
The funders had no role in study design, data collection and analysis, decision to publish, or preparation of the manuscript.
Supporting Material
References
- 1.Dowling J.E. Belknap Press/Harvard University Press; Cambridge, MA: 1987. The Retina: An Approachable Part of the Brain. 12–42. [Google Scholar]
- 2.Hood D.C., Lin C.E., Birch D.G. Thickness of receptor and post-receptor retinal layers in patients with retinitis pigmentosa measured with frequency-domain optical coherence tomography. Invest. Ophthalmol. Vis. Sci. 2009;50:2328–2336. doi: 10.1167/iovs.08-2936. [DOI] [PMC free article] [PubMed] [Google Scholar]
- 3.Pugh E.N., Jr., Lamb T.D. Phototransduction in vertebrate rods and cones: molecular mechanisms of amplification, recovery and light adaptation. In: Stavenga D.G., de Grip W.J., Pugh E.N. Jr., editors. Handbook of Biological Physics. Elsevier; Amsterdam: 2000. pp. 183–254. [Google Scholar]
- 4.Basinger S., Bok D., Hall M. Rhodopsin in the rod outer segment plasma membrane. J. Cell Biol. 1976;69:29–42. doi: 10.1083/jcb.69.1.29. [DOI] [PMC free article] [PubMed] [Google Scholar]
- 5.Papermaster D.S., Dreyer W.J. Rhodopsin content in the outer segment membranes of bovine and frog retinal rods. Biochemistry. 1974;13:2438–2444. doi: 10.1021/bi00708a031. [DOI] [PubMed] [Google Scholar]
- 6.Besharse J.C. Light and membrane biogenesis in rod photoreceptors of vertebrates: the effects of constant light on visual processes. In: Williams T., editor. Light and Membrane Biogenesis. Plenum; New York: 1979. pp. 409–431. [Google Scholar]
- 7.Papermaster D.S., Schneider B.G., Kraehenbuhl J.P. Immunocytochemical localization of a large intrinsic membrane protein to the incisures and margins of frog rod outer segment disks. J. Cell Biol. 1978;78:415–425. doi: 10.1083/jcb.78.2.415. [DOI] [PMC free article] [PubMed] [Google Scholar]
- 8.Papermaster D.S., Schneider B.G., Kraehenbuhl J.P. Immunocytochemical localization of opsin in outer segments and Golgi zones of frog photoreceptor cells. An electron microscope analysis of cross-linked albumin-embedded retinas. J. Cell Biol. 1978;77:196–210. doi: 10.1083/jcb.77.1.196. [DOI] [PMC free article] [PubMed] [Google Scholar]
- 9.Nickell S., Park P.S., Palczewski K. Three-dimensional architecture of murine rod outer segments determined by cryoelectron tomography. J. Cell Biol. 2007;177:917–925. doi: 10.1083/jcb.200612010. [DOI] [PMC free article] [PubMed] [Google Scholar]
- 10.Corless J.M., Fetter R.D., Wall-Buford D.L. Structural features of the terminal loop region of frog retinal rod outer segment disk membranes: II. Organization of the terminal loop complex. J. Comp. Neurol. 1987;257:9–23. doi: 10.1002/cne.902570103. [DOI] [PubMed] [Google Scholar]
- 11.Roof D.J., Heuser J.E. Surfaces of rod photoreceptor disk membranes: integral membrane components. J. Cell Biol. 1982;95:487–500. doi: 10.1083/jcb.95.2.487. [DOI] [PMC free article] [PubMed] [Google Scholar]
- 12.Usukura J., Yamada E. Molecular organization of the rod outer segment. A deep-etching study with rapid freezing using unfixed frog retina. Biomed. Res. 1981;2:177–193. [Google Scholar]
- 13.Corless J.M., Schneider T.G. Patterns of interdisk connections within the lamellar domains of retinal rod outer segment disks: observations relevant to the axial propagation of incisures. Exp. Eye Res. 1987;45:883–905. doi: 10.1016/s0014-4835(87)80104-5. [DOI] [PubMed] [Google Scholar]
- 14.Townes-Anderson E., Dacheux R.F., Raviola E. Rod photoreceptors dissociated from the adult rabbit retina. J. Neurosci. 1988;8:320–331. doi: 10.1523/JNEUROSCI.08-01-00320.1988. [DOI] [PMC free article] [PubMed] [Google Scholar]
- 15.Miyaguchi K., Kuo C.H., Hashimoto P.H. Topography of opsin within disk and plasma membranes revealed by a rapid-freeze deep-etch technique. J. Neurocytol. 1992;21:807–819. doi: 10.1007/BF01237906. [DOI] [PubMed] [Google Scholar]
- 16.Kajimura N., Harada Y., Usukura J. High-resolution freeze-etching replica images of the disk and the plasma membrane surfaces in purified bovine rod outer segments. J. Electron Microsc. (Tokyo) 2000;49:691–697. doi: 10.1093/oxfordjournals.jmicro.a023860. [DOI] [PubMed] [Google Scholar]
- 17.Missotten L., Dehauwere E., Guzik A. Ultrastructure of the human retina. Apropos of bipolar cells and their synapses [L’ultrastructure de la r’etine humaine. A propos des cellules bipolaires et de leurs synapses] Bull. Soc. Belge Ophtalmol. 1964;137:277–293. [PubMed] [Google Scholar]
- 18.Corless J.M., Kaplan M.W. Structural interpretation of the birefringence gradient in retinal rod outer segments. Biophys. J. 1979;26:543–556. doi: 10.1016/S0006-3495(79)85270-4. [DOI] [PMC free article] [PubMed] [Google Scholar]
- 19.Andrews L.D. Structural periodicities observed in mammalian rod outer segments with Nomarski optics. Invest. Ophthalmol. Vis. Sci. 1985;26:778–782. [PubMed] [Google Scholar]
- 20.Kaplan M.W. Birefringence and birefringence inhomogeneities in monkey rod outer segments. Invest. Ophthalmol. Vis. Sci. 1983;24(Suppl):A288. [Google Scholar]
- 21.Kaplan M.W. Shedding is correlated with disk membrane axial position rather than disk age in Xenopus laevis rod outer segments. Vision Res. 1984;24:1163–1168. doi: 10.1016/0042-6989(84)90171-8. [DOI] [PubMed] [Google Scholar]
- 22.Knox B.E., Schlueter C., Besharse J.C. Transgene expression in Xenopus rods. FEBS Lett. 1998;423:117–121. doi: 10.1016/s0014-5793(98)00018-0. [DOI] [PubMed] [Google Scholar]
- 23.Kaplan M.W. Light cycle—dependent axial variations in frog rod outer segment structure. Invest. Ophthalmol. Vis. Sci. 1981;21:395–402. [PubMed] [Google Scholar]
- 24.Rana M.W., Taraszka S.R. Monkey photoreceptor calycal processes and interphotoreceptor matrix as observed by scanning electron microscopy. Am. J. Anat. 1991;192:472–477. doi: 10.1002/aja.1001920412. [DOI] [PubMed] [Google Scholar]
- 25.Haeri M. Biochemistry and Molecular Biology. State University of New York Upstate Medical University; Syracuse, NY: 2010. Molecular basis of inherited retinal diseases: characterization of rhodopsin mutants in living rods. [Google Scholar]
- 26.Haeri M., Knox B.E. Rhodopsin mutant P23H destabilizes rod photoreceptor disk membranes. PLoS ONE. 2012;7:e30101. doi: 10.1371/journal.pone.0030101. [DOI] [PMC free article] [PubMed] [Google Scholar]
- 27.Moritz O.L., Tam B.M., Nakayama T. A functional rhodopsin-green fluorescent protein fusion protein localizes correctly in transgenic Xenopus laevis retinal rods and is expressed in a time-dependent pattern. J. Biol. Chem. 2001;276:28242–28251. doi: 10.1074/jbc.M101476200. [DOI] [PubMed] [Google Scholar]
- 28.Moritz O.L., Molday R.S. Molecular cloning, membrane topology, and localization of bovine rom-1 in rod and cone photoreceptor cells. Invest. Ophthalmol. Vis. Sci. 1996;37:352–362. [PubMed] [Google Scholar]
- 29.Feynman R.P., Leighton R.B., Sands M.L. The Feynman Lectures on Physics. Pearson/Addison-Wesley; New York: 1963. Elasticity; pp. 1–12. [Google Scholar]
- 30.Landau L.D., Lifshitz E.M. Course of Theoretical Physics. Elsevier; Oxford: 1986. Theory of elasticity; pp. 64–84. [Google Scholar]
- 31.Batni S., Mani S.S., Knox B.E. Xenopus rod photoreceptor: model for expression of retinal genes. Methods Enzymol. 2000;316:50–64. doi: 10.1016/s0076-6879(00)16716-3. [DOI] [PubMed] [Google Scholar]
- 32.Whitaker S.L., Knox B.E. Conserved transcriptional activators of the Xenopus rhodopsin gene. J. Biol. Chem. 2004;279:49010–49018. doi: 10.1074/jbc.M406080200. [DOI] [PubMed] [Google Scholar]
- 33.Peet J.A., Bragin A., Pugh E.N., Jr. Quantification of the cytoplasmic spaces of living cells with EGFP reveals arrestin-EGFP to be in disequilibrium in dark adapted rod photoreceptors. J. Cell Sci. 2004;117:3049–3059. doi: 10.1242/jcs.01167. [DOI] [PubMed] [Google Scholar]
- 34.Phillips R., Kondev J., Theriot J. Taylor & Francis; New York: 2008. Physical Biology of the Cell. 407–450. [Google Scholar]
- 35.Howard J. Sinauer; New York: 2000. Mechanics of Motor Proteins and the Cytoskeleton. 29–39, 99–116. [Google Scholar]
- 36.Gittes F., Mickey B., Howard J. Flexural rigidity of microtubules and actin filaments measured from thermal fluctuations in shape. J. Cell Biol. 1993;120:923–934. doi: 10.1083/jcb.120.4.923. [DOI] [PMC free article] [PubMed] [Google Scholar]
- 37.Howard J., Ashmore J.F. Stiffness of sensory hair bundles in the sacculus of the frog. Hear. Res. 1986;23:93–104. doi: 10.1016/0378-5955(86)90178-4. [DOI] [PubMed] [Google Scholar]
- 38.Shin J.H., Mahadevan L., Matsudaira P. Bending stiffness of a crystalline actin bundle. J. Mol. Biol. 2004;337:255–261. doi: 10.1016/j.jmb.2004.01.028. [DOI] [PubMed] [Google Scholar]
- 39.Gardel M.L., Shin J.H., Weitz D.A. Elastic behavior of cross-linked and bundled actin networks. Science. 2004;304:1301–1305. doi: 10.1126/science.1095087. [DOI] [PubMed] [Google Scholar]
- 40.Teff Z., Priel Z., Gheber L.A. Forces applied by cilia measured on explants from mucociliary tissue. Biophys. J. 2007;92:1813–1823. doi: 10.1529/biophysj.106.094698. [DOI] [PMC free article] [PubMed] [Google Scholar]
- 41.Teff Z., Priel Z., Gheber L.A. The forces applied by cilia depend linearly on their frequency due to constant geometry of the effective stroke. Biophys. J. 2008;94:298–305. doi: 10.1529/biophysj.107.111724. [DOI] [PMC free article] [PubMed] [Google Scholar]
- 42.Heussinger C., Bathe M., Frey E. Statistical mechanics of semiflexible bundles of wormlike polymer chains. Phys. Rev. Lett. 2007;99:048101. doi: 10.1103/PhysRevLett.99.048101. [DOI] [PubMed] [Google Scholar]
- 43.Love A.E.H. A Treatise on the Mathematical Theory of Elasticity. University Press; Cambridge, MA: 1906. The bending of a beam by terminal transverse load; pp. 314–333. [Google Scholar]
- 44.Baba S.A. Flexural rigidity and elastic constant of cilia. J. Exp. Biol. 1972;56:459–467. doi: 10.1242/jeb.56.2.459. [DOI] [PubMed] [Google Scholar]
- 45.Darnton N.C., Berg H.C. Force-extension measurements on bacterial flagella: triggering polymorphic transformations. Biophys. J. 2007;92:2230–2236. doi: 10.1529/biophysj.106.094037. [DOI] [PMC free article] [PubMed] [Google Scholar]
- 46.Schaap I.A., Carrasco C., Schmidt C.F. Elastic response, buckling, and instability of microtubules under radial indentation. Biophys. J. 2006;91:1521–1531. doi: 10.1529/biophysj.105.077826. [DOI] [PMC free article] [PubMed] [Google Scholar]
- 47.Crescitteli F. The visual cells and visual pigments of the vertebrate eye. In: Dartnall H., editor. Photochemistry of Vision, Handbook of Sensory Physiology. Springer-Verlag; New York: 1972. pp. 245–363. [Google Scholar]
- 48.Marszalek J.R., Liu X., Goldstein L.S. Genetic evidence for selective transport of opsin and arrestin by kinesin-II in mammalian photoreceptors. Cell. 2000;102:175–187. doi: 10.1016/s0092-8674(00)00023-4. [DOI] [PubMed] [Google Scholar]
- 49.Pazour G.J., Baker S.A., Besharse J.C. The intraflagellar transport protein, IFT88, is essential for vertebrate photoreceptor assembly and maintenance. J. Cell Biol. 2002;157:103–113. doi: 10.1083/jcb.200107108. [DOI] [PMC free article] [PubMed] [Google Scholar]
- 50.Rosenbaum J.L., Cole D.G., Diener D.R. Intraflagellar transport: the eyes have it. J. Cell Biol. 1999;144:385–388. doi: 10.1083/jcb.144.3.385. [DOI] [PMC free article] [PubMed] [Google Scholar]
- 51.Mitchell D.R. The evolution of eukaryotic cilia and flagella as motile and sensory organelles. Adv. Exp. Med. Biol. 2007;607:130–140. doi: 10.1007/978-0-387-74021-8_11. [DOI] [PMC free article] [PubMed] [Google Scholar]
- 52.Berbari N.F., O’Connor A.K., Yoder B.K. The primary cilium as a complex signaling center. Curr. Biol. 2009;19:R526–R535. doi: 10.1016/j.cub.2009.05.025. [DOI] [PMC free article] [PubMed] [Google Scholar]
- 53.Besharse J.C., Hollyfield J.G. Turnover of mouse photoreceptor outer segments in constant light and darkness. Invest. Ophthalmol. Vis. Sci. 1979;18:1019–1024. [PubMed] [Google Scholar]
- 54.Goldstein L.S. Molecular motors: from one motor many tails to one motor many tales. Trends Cell Biol. 2001;11:477–482. doi: 10.1016/s0962-8924(01)02143-2. [DOI] [PubMed] [Google Scholar]
- 55.Goldstein L.S., Yang Z. Microtubule-based transport systems in neurons: the roles of kinesins and dyneins. Annu. Rev. Neurosci. 2000;23:39–71. doi: 10.1146/annurev.neuro.23.1.39. [DOI] [PubMed] [Google Scholar]
- 56.Signor D., Scholey J.M. Microtubule-based transport along axons, dendrites and axonemes. Essays Biochem. 2000;35:89–102. doi: 10.1042/bse0350089. [DOI] [PubMed] [Google Scholar]
- 57.Vale R.D. The molecular motor toolbox for intracellular transport. Cell. 2003;112:467–480. doi: 10.1016/s0092-8674(03)00111-9. [DOI] [PubMed] [Google Scholar]
- 58.Elbaum M., Libchaber A., Fygenson D.K. Buckling microtubules in vesicles. Phys. Rev. Lett. 1996;76:4078–4081. doi: 10.1103/PhysRevLett.76.4078. [DOI] [PubMed] [Google Scholar]
- 59.Jackson G.R., Owsley C., Curcio C.A. Photoreceptor degeneration and dysfunction in aging and age-related maculopathy. Ageing Res. Rev. 2002;1:381–396. doi: 10.1016/s1568-1637(02)00007-7. [DOI] [PubMed] [Google Scholar]
- 60.Cohen A. Rods and cones. In: Fuortes M., editor. Physiology of Rod Photoreceptor Organs, Handbook of Sensory Physiology. Springer; New York: 1972. pp. 63–110. [Google Scholar]
- 61.Wald G., Brown P.K., Gibbons I.R. The problem of visual excitation. J. Opt. Soc. Am. 1963;53:20–35. doi: 10.1364/josa.53.000020. [DOI] [PubMed] [Google Scholar]
- 62.Rosenkranz J. New aspects of the ultrastructure of frog rod outer segments. Int. Rev. Cytol. 1977;50:25–158. doi: 10.1016/s0074-7696(08)60098-4. [DOI] [PubMed] [Google Scholar]
- 63.McConnell D.G. The isolation of retinal outer segment fragments. J. Cell Biol. 1965;27:459–473. doi: 10.1083/jcb.27.3.459. [DOI] [PMC free article] [PubMed] [Google Scholar]
- 64.Clarke G., Goldberg A.F., McInnes R.R. Rom-1 is required for rod photoreceptor viability and the regulation of disk morphogenesis. Nat. Genet. 2000;25:67–73. doi: 10.1038/75621. [DOI] [PubMed] [Google Scholar]
- 65.Loewen C.J., Moritz O.L., Molday R.S. The role of subunit assembly in peripherin-2 targeting to rod photoreceptor disk membranes and retinitis pigmentosa. Mol. Biol. Cell. 2003;14:3400–3413. doi: 10.1091/mbc.E03-02-0077. [DOI] [PMC free article] [PubMed] [Google Scholar]
- 66.Humphries M.M., Rancourt D., Humphries P. Retinopathy induced in mice by targeted disruption of the rhodopsin gene. Nat. Genet. 1997;15:216–219. doi: 10.1038/ng0297-216. [DOI] [PubMed] [Google Scholar]
- 67.Lem J., Krasnoperova N.V., Sidman R.L. Morphological, physiological, and biochemical changes in rhodopsin knockout mice. Proc. Natl. Acad. Sci. USA. 1999;96:736–741. doi: 10.1073/pnas.96.2.736. [DOI] [PMC free article] [PubMed] [Google Scholar]
- 68.Frederick J.M., Krasnoperova N.V., Baehr W. Mutant rhodopsin transgene expression on a null background. Invest. Ophthalmol. Vis. Sci. 2001;42:826–833. [PubMed] [Google Scholar]
- 69.Arikawa K., Molday L.L., Williams D.S. Localization of peripherin/rds in the disk membranes of cone and rod photoreceptors: relationship to disk membrane morphogenesis and retinal degeneration. J. Cell Biol. 1992;116:659–667. doi: 10.1083/jcb.116.3.659. [DOI] [PMC free article] [PubMed] [Google Scholar]
- 70.Bascom R.A., Manara S., McInnes R.R. Cloning of the cDNA for a novel photoreceptor membrane protein (Rom-1) identifies a disk rim protein family implicated in human retinopathies. Neuron. 1992;8:1171–1184. doi: 10.1016/0896-6273(92)90137-3. [DOI] [PubMed] [Google Scholar]
- 71.Defoe D.M., Besharse J.C., Fliesler S.J. Tunicamycin-induced dysgenesis of retinal rod outer segment membranes. II. Quantitative freeze-fracture analysis. Invest. Ophthalmol. Vis. Sci. 1986;27:1595–1601. [PubMed] [Google Scholar]
- 72.Fliesler S.J., Rayborn M.E., Hollyfield J.G. Membrane morphogenesis in retinal rod outer segments: inhibition by tunicamycin. J. Cell Biol. 1985;100:574–587. doi: 10.1083/jcb.100.2.574. [DOI] [PMC free article] [PubMed] [Google Scholar]
- 73.Fliesler S.J., Rayborn M.E., Hollyfield J.G. Inhibition of oligosaccharide processing and membrane morphogenesis in retinal rod photoreceptor cells. Proc. Natl. Acad. Sci. USA. 1986;83:6435–6439. doi: 10.1073/pnas.83.17.6435. [DOI] [PMC free article] [PubMed] [Google Scholar]
- 74.Liu X., Wu T.H., Williams D.S. Defective phototransductive disk membrane morphogenesis in transgenic mice expressing opsin with a mutated N-terminal domain. J. Cell Sci. 1997;110:2589–2597. doi: 10.1242/jcs.110.20.2589. [DOI] [PubMed] [Google Scholar]
- 75.Ulshafer R.J., Allen C.B., Fliesler S.J. Tunicamycin-induced dysgenesis of retinal rod outer segment membranes. I. A scanning electron microscopy study. Invest. Ophthalmol. Vis. Sci. 1986;27:1587–1594. [PubMed] [Google Scholar]
Associated Data
This section collects any data citations, data availability statements, or supplementary materials included in this article.