Abstract
Objectives
To evaluate the registration of 3D models from cone-beam CT (CBCT) images taken before and after orthognathic surgery for the assessment of mandibular anatomy and position.
Methods
CBCT scans were taken before and after orthognathic surgery for ten patients with various malocclusions undergoing maxillary surgery only. 3D models were constructed from the CBCT images utilizing semi-automatic segmentation and manual editing. The cranial base was used to register 3D models of pre- and post-surgery scans (1 week). After registration, a novel tool allowed the visual and quantitative assessment of post-operative changes via 2D overlays of superimposed models and 3D coloured displacement maps.
Results
3D changes in mandibular rami position after surgical procedures were clearly illustrated by the 3D colour-coded maps. The average displacement of all surfaces was 0.77 mm (SD = 0.17 mm), at the posterior border 0.78 mm (SD = 0.25 mm), and at the condyle 0.70 mm (SD = 0.07 mm). These displacements were close to the image spatial resolution of 0.60 mm. The average interobserver differences were negligible. The range of the interobserver errors for the average of all mandibular rami surface distances was 0.02 mm (SD = 0.01 mm).
Conclusion
Our results suggest this method provides a valid and reproducible assessment of craniofacial structures for patients undergoing orthognathic surgery. This technique may be used to identify different patterns of ramus and condylar remodelling following orthognathic surgery.
Keywords: cone-beam CT, 3D models, superimposition
Introduction
The correction of maxillomandibular skeletal discrepancies requires teeth and jaws to be manipulated in all three dimensions.1 While more rotation and displacement in the condyles occur as a result of orthognathic surgery that include a ramus procedure, there is no information on the degree to which maxillary procedures induce condylar remodelling. A quantitative assessment of condylar rotation/displacement that was not feasible previously can now be accomplished using a cone-beam CT (CBCT) specialized for maxillofacial imaging. CBCT scanners render high-resolution images with lower doses of radiation compared with spiral CT.2,3 For these reasons, 3D CBCTs are the method of choice in evaluating the complex dentofacial structures. Cross-sectional cuts in axial, coronal and sagittal planes permit access to the internal morphology of soft tissues and skeletal structures, but the localization and relationship among various facial components can be difficult to interpret. The 3D modelling of the anatomical structures can facilitate this interpretation.4
The challenges in utilizing the 3D CBCT images include compilation of software for construction of the 3D models and for the assessment of changes with time as a result of treatment. Various techniques for the reconstruction of 3D CT images have been used in diagnosis, treatment planning and simulation.5–10 Image superimposition for assessment of changes with treatment poses challenges not only because of registration and homology issues, but also because of the choice of landmark locations in anatomic surfaces that lack suitable operational definitions in the three planes of space.11 – 15
The purpose of this study was to evaluate a new system to register models constructed from 3D CBCT, utilizing the grey value image information of the cranial base, instead of landmarks to register pre- and post-surgery scans. Specifically, this study assessed whether mandibular structures remain unchanged after maxillary surgery. A new tool was used for graphical overlay and 3D display to visually assess the location and quantify changes between superimposed models.
Methods
Ten patients with various malocclusions were recruited who were undergoing maxillary surgery at the UNC Dentofacial Deformities Program (3 males and 7 females; 20.6 ^ 5.2 years). Only individuals with dentofacial disharmony due to a developmental problem severe enough to warrant surgical correction were included. Informed consent was obtained from all subjects and the experimental protocols were approved by the Institutional Review Board. CBCT scans were taken before and 1 week after orthognathic surgery with the NewTom 9000 (Aperio Services LLC, Sarasota, FL, 34236). The second CBCT data was acquired immediately after surgery (1 week) to assess changes due to surgical procedures, and not changes due to remodelling or adaptive response to treatment.
Image acquisition
The imaging protocol involved a 70 s head CBCT scanning with a field of view of 230 mm × 230 mm. Primary reconstruction of 3608 projections used filtered back-projection techniques to build the 3D data volume similar to conventional CT.16 After completion of the primary reconstruction, the maximum spatial image resolution was 0.3 mm.
3D reconstruction and segmentation
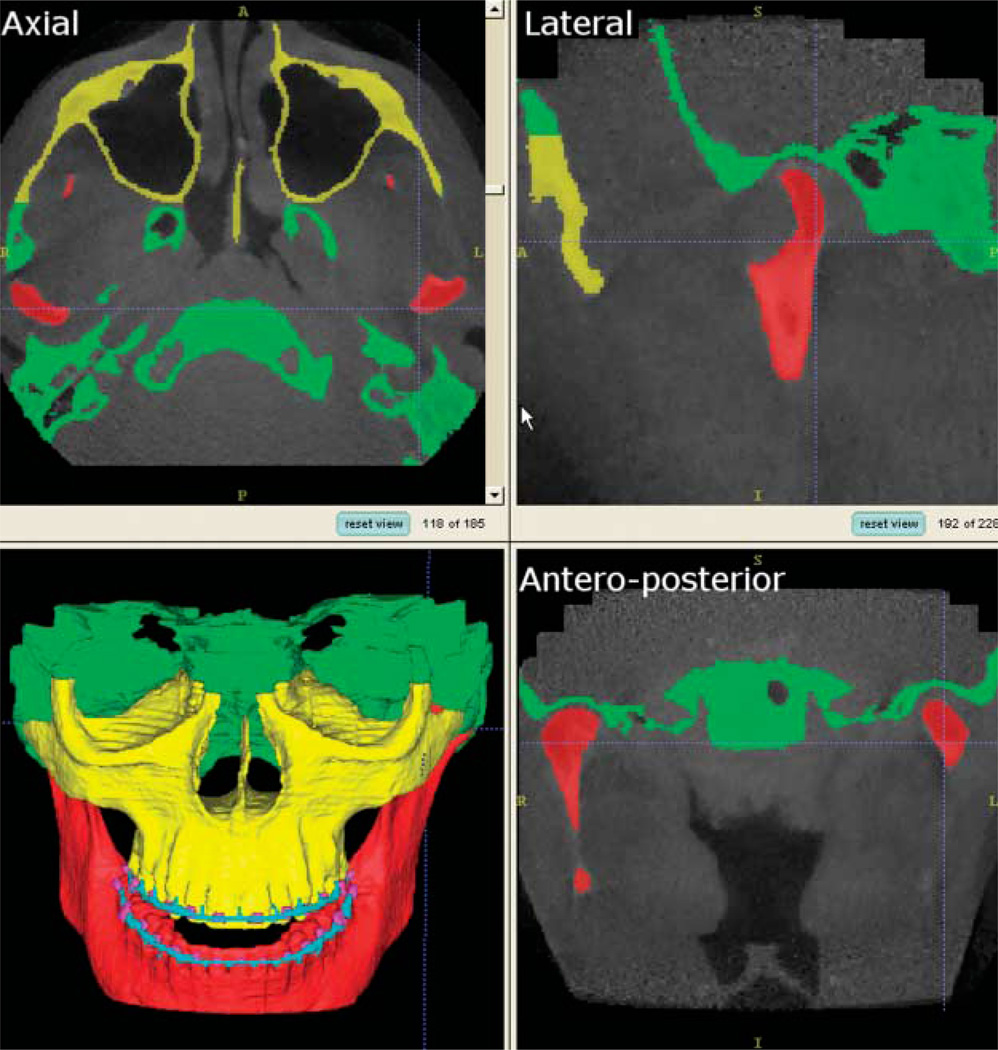
Using a trilinear interpolation algorithm, the images were reformatted to yield a voxel size of 0.58 mm × 0.58 mm × 0.6 mm and then cropped to facilitate image analysis. Segmentation of the cranial base and mandible was done with the Insight SNAP software,17 an interactive image segmentation program. Image segmentation refers to a process of examining cross-sections of a volumetric data set and outlining the shape of structures visible in these cross-sections. A key feature of SNAP is the ability to segment and navigate through the volumetric data set in any of the orthogonal slice windows (sagittal, coronal and axial views) with a linked cursor system that allows tracking of a single voxel. SNAP allows regional semiautomatic segmentation employing user-initialized deformable implicit surfaces that evolve to the most appropriate border between neighbouring structures. After the segmentation, a 3D graphical rendering of the volumetric object allows navigation between voxels in the volumetric image and the 3D graphics with zooming, rotating and panning (Figure 1).
Figure 1.
Visualization tool used (Insight SNAP) for visualization of 185 axial, 228 lateral (sagittal), and 203 anteroposterior (coronal) cross-sections for each CT image acquisition. A frontal view of the 3D surface models displays the segmentation of all slices stacked together without any smoothing
Reproducibility
A subset of ten CBCT scans (before and after surgery for five patients) was measured independently by three observers for the purpose of assessing interobserver reliability. The reproducibility of our method was also assessed using the hypothesis that mandibular structures remain unchanged after maxillary surgery, except for possible autorotation relative to the maxillary displacement with surgery.
Superimposition and assessment of mandibular displacement
The pre- and post-surgery models were registered based on the cranial base surface, as the cranial base structures are not altered by the surgery, unlike the maxilla and/or mandible. The fully automated registration was computed by the MIRIT software.18 MIRIT computed the rigid registration (translation and rotation) that optimally aligns the pre- and post-operative dataset with subvoxel accuracy at the cranial base (Figure 2). The computed registration was then applied to the segmented structures in order to measure mandibular rami alterations.
Figure 2.
Demonstration of superimposition of pre- and post-surgery models of a case treated with maxillary advancement and mandibular setback. This case is shown for illustration only and was not included in this study sample. The surface of the cranial base was used for registration performed with MIRIT. Note that the cranial base colour map is green (0 mm surface distance), showing adequate match of the before and after models for the cranial base Structures
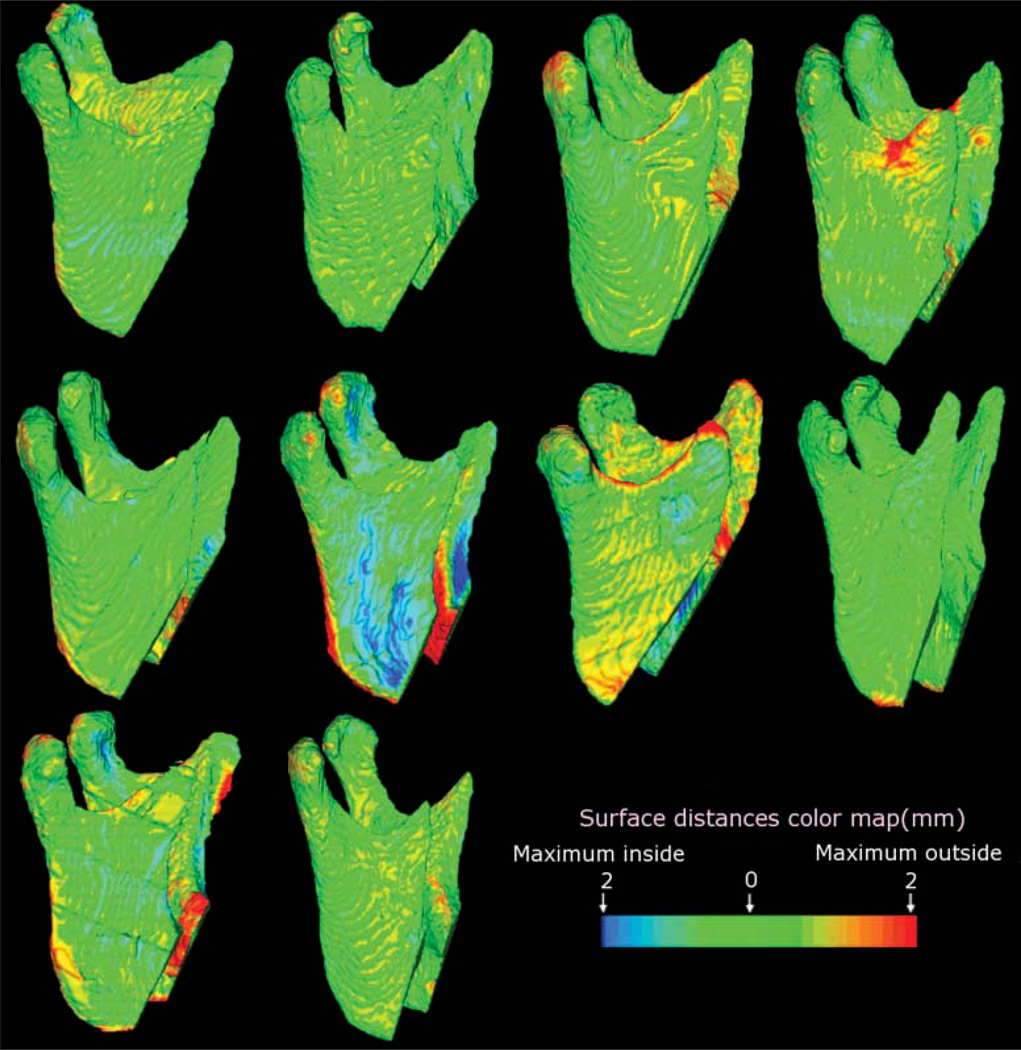
VALMET,19 a new tool for comparison of 3D models, was used for studying intraobserver and interobserver variability of segmentations. VALMET allowed both visual and quantitative assessment of the location and magnitude of segmentation differences via graphical overlays and 3D displays (Figures 2 and 3). Inputs to VALMET are the registered pre- and post-surgery segmented models of the mandibular rami. Quantitative evaluation includes intraclass correlation of the resulting volumes and shape distance metrics such as the mean absolute distance between the segmentations. These volumetric and shape measures are calculated for the full 3D segmentations. The resulting 3D graphical display of the structure is colour-coded with the regional magnitude of the displacement between the pre- and post-surgery segmentations (Figure 2). The pre- or post-operative segmentation results are overlaid on the CBCT image data for visual comparison (Figure 3).
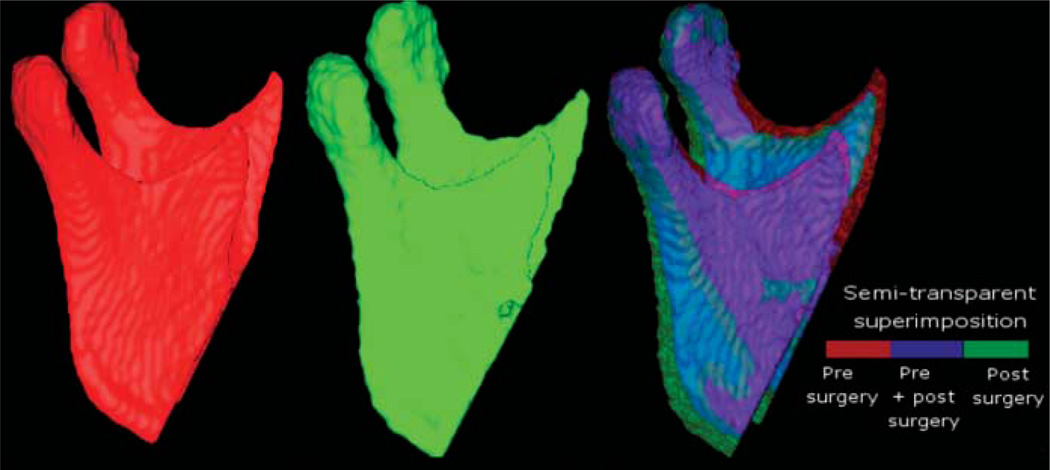
Figure 3.
Lateral views of 3D models of a patient treated with maxillary advancement and mandibular setback. The model labelled in red was constructed from a CBCT image acquired 1–2 weeks before surgery. The model labelled green was constructed from a 1 week post-surgery CBCT scan. The other anatomical structures are masked for better visualization of changes in the mandibular ramus and condyle. In the semi-transparent superimposition of mandibular models, red shows the pre-surgery model, blue shows the area where the pre- and post-surgery models overlap, and green shows the post-surgery
The direction of 3D displacement varies at different surfaces at the right or left sides of the face. For this reason, colour-coded maps indicate inward (blue) or outward (red) displacement between pre- and post-surgery segmentations. At the medial surfaces of the mandible, a blue colour code indicates an inward displacement of that surface after surgery, i.e. the displacement occurred in a lateral direction. This lateral displacement is depicted by the red colour in the lateral surfaces of the rami, indicating the outward (lateral) direction of displacement. If there was a medial displacement of the condyles and rami with surgery, the medial surfaces would be red colour coded and the lateral surfaces would be blue coded. For anterior surfaces, an inward blue colour code indicates posterior displacement (setback). This posterior displacement is shown at the posterior surfaces in red (outward displacement). Forward displacement (advancement) is shown in a red colour code in the anterior surfaces (outward), and blue colour code in the posterior surfaces (inward). Absence of surgical displacement is indicated by the green colour code (0 mm displacement).
VALMET computes several cumulative measures of the surface distances between pre- and post-surgery models. The most relevant of these measures, the mean surface distance, quantifies how much on average the two surfaces differ from each other.
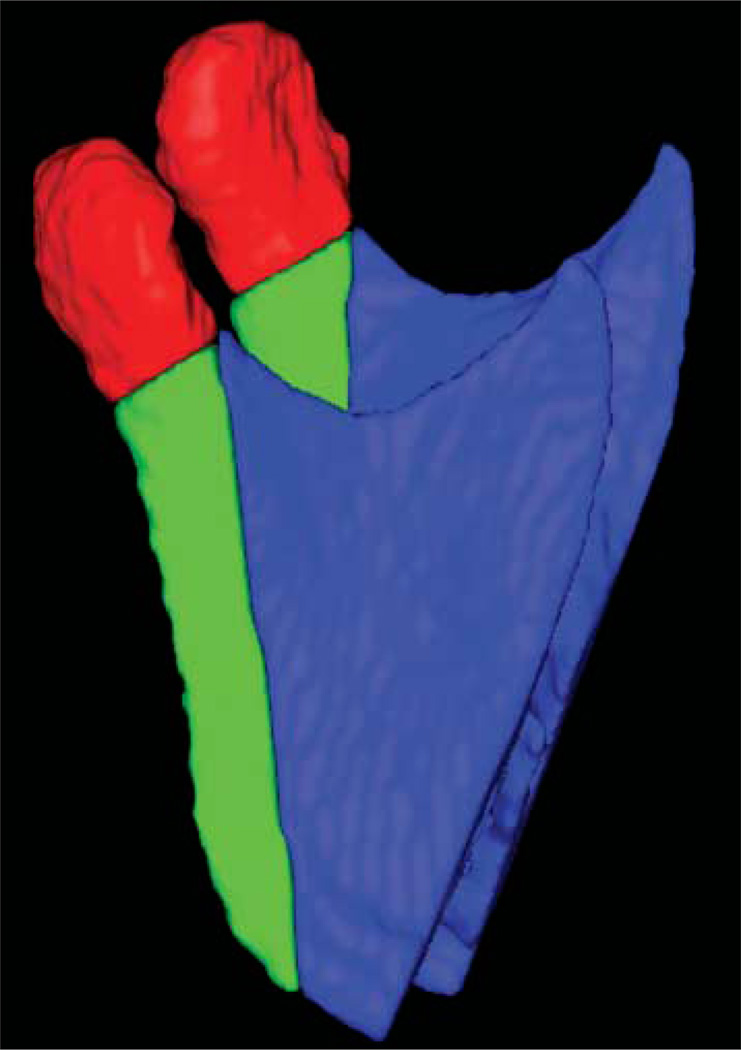
The mandibular rami models of pre- and post-surgery images were also analysed for specific regions of interest: the condyles and the posterior border of the rami (Figure 4). The definition of the region of interest was performed in SNAP using combined pre- and post-segmentation models to ensure that the regions of interest would be comparable. The posterior border region of interest was defined by a plane tangent to the anterior contour of the condyles and parallel to the posterior border of the rami. The inferior limit of the condylar region of interest was defined by the interface of the posterior border cut. After cutting, each region of interest was analysed separately in VALMET. The statistical analysis included one-sample t-tests to assess statistical significance of the mandibular displacement. The level of significance was set at 0.05.
Figure 4.
Lateral view of regions of interest in the mandibular rami, specifically the condyles (red) and the posterior border (green)
Results
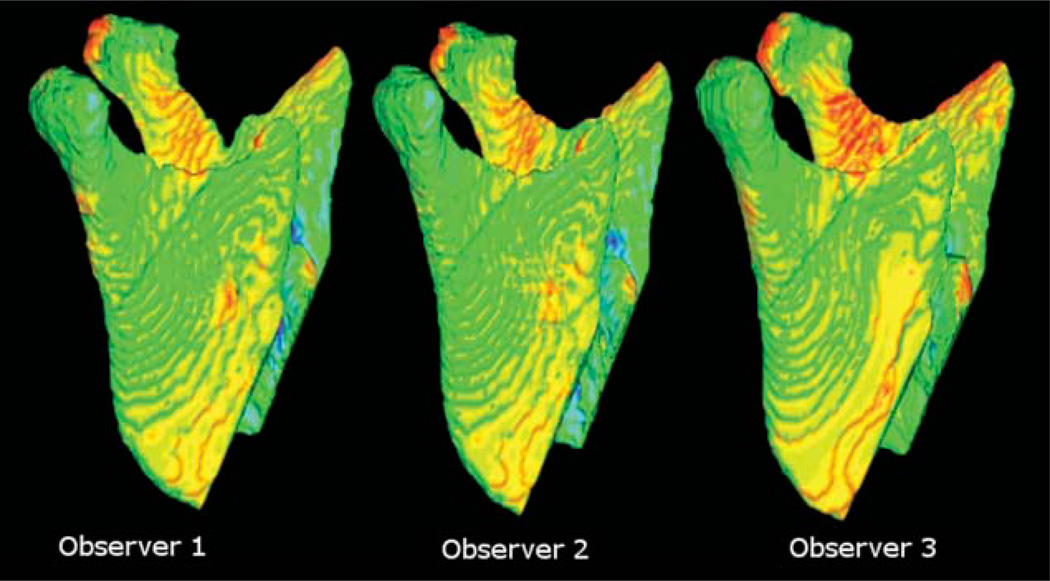
The 3D changes in post-operative mandibular rami position of 3D models constructed by three observers are illustrated with 3D colour-coded maps in Figure 5. The similarity of the 3D colour-coded maps as well as the small differences documented in Table 1 show that interobserver variability was negligible. Pre- to post-surgery surface distance measurements differed amongst the three observers by not more than 0.26 mm (maximal error measured as inward displacement at the mandibular rami surface). The colour-coded maps in Figure 5 also show clearly the similarity of the surface distances along all the mandibular rami surfaces among the three observers.
Figure 5.
Lateral view of the surface distances between pre- and post-surgery mandibular models of the same patient constructed by three different observers to assess interobserver variability. Note the similarity of the colour maps
Table 1.
Interobserver errors for the average of all mandibular rami surface distances (mm)
|
Mandibular rami surface |
Posterior border of the mandibular ramus |
Condyles |
||||
|---|---|---|---|---|---|---|
| Interobserver error | Inward | Outward | Inward | Outward | Inward | Outward |
| Range | 0.26 | 0.24 | 0.15 | 0.11 | 0.05 | 0.13 |
| Standard deviation | 0.12 | 0.10 | 0.07 | 0.04 | 0.02 | 0.08 |
The reproducibility of the method was confirmed by the colour-coded maps. The colour-coded maps shown in Figure 6 reveal that mandibular structures remained unchanged after maxillary surgery for most patients with predominantly green colour coded maps. All subjects showed small backward rotation of the mandibular rami (mean 0.78 mm, SD = 0.25 mm), with only one subject having a larger surface distance change (Figure 6 and Table 2).
Figure 6.
Ten subjects were treated with maxillary advancement only. Note that only one subject had a maximum surface distance change 2 mm (red along the posterior border of the rami). For all other patients, mandibular surface displacement was minimal
Table 2.
Mean distance (mm) between the surface of the pre- and post-surgery 3D models
|
Direction of displacement after surgery |
||||||
|---|---|---|---|---|---|---|
|
Mandibular rami surface |
Posterior border of the mandibular ramus |
Condyles |
||||
| Surgery | Inside | Outside | Inside | Outside | Inside | Outside |
| Maxilla only | 0.28 ± 0.10 | 0.77 ± 0.17 | 0.15 ± 0.09 | 0.78 ± 0.25 | 0.26 ± 0.12 | 0.70 ± 0.78 |
| P-value | <0.001 | <0.001 | <0.001 | <0.001 | <0.001 | <0.001 |
The average displacement in condylar position was 0.70 mm (SD = 0.07 mm), and the average surface distance for all surfaces of the mandibular rami was 0.77 mm (SD = 0.17 mm, Table 2).
The average inward displacement for all surfaces was smaller than the image spatial resolution of 0.6 mm.
The one-sample t-test P-values are statistically significant at all surfaces, despite the small values of displacements that were observed.
Discussion
CBCT may be an ideal method for evaluating alterations in the position of mandibular condyles and rami after surgical correction.20,21 The choice of image modality is affected by the excellent imaging of bone components of the temporomandibular joint with CT, while MRI allows more accurate rendering of the soft tissues.3,7,22 – 24 The use of CBCT addresses the issue of radiation dose with lower cost compared with spiral CT.2,16
Our choice of CBCT acquisition parameters was directed toward centring the condyles in the field of view to avoid a low signal-to-noise ratio in the periphery of the cone-beam. In the reconstruction parameters, the small slice thickness, 0.6 mm, improved the visual quality of 3D reconstruction. Further improvement is possible with a smaller slice thickness, but this would result in increased image size, requiring greater computational power and higher user interaction time.
The image analysis included 3D construction,17 registration and superimposition of pre- and post-surgery models,18 as well as surface distance calculation.19 All these methods were automated by applying in-house computer tools. This explains our negligible interobserver variability, and allows image analysis procedures largely independent of observer errors. The observation that mandibular structures remained unchanged after maxillary surgery, except for small autorotation relative to the maxillary displacement with surgery, suggests that the method is valid. The average surface distances at the mandibular surfaces indicated a small rotation/ displacement induced by maxillary procedures that was statistically significant. When the image spatial resolution is 0.6 mm, future long term follow up will assess whether observed changes in position of 0.7 mm are not clinically significant allowing for adaptive remodelling without negative sequelae.
The complexity of rotations and displacements in 3D make the colour-coded maps seem complex at first when describing outward and inward directions of displacement. As clinicians learn how to effectively use 3D imaging, it is necessary to think in 3D directions instead of 2D directions. For this reason, a lateral displacement of the ramus is described with two different colours for the medial and lateral surfaces of the ramus.
The fully automated superimposition using voxel-wise rigid registration of the cranial base represents advancement to the technique described by Kawamata et al.7 They used an observer dependent technique to superimpose and rotate the post-surgery CT until anatomical landmarks overlapped these same structures in the presurgery semi-transparent model. Interestingly, the semitransparency tool is similar to the one used for visualization of the 3D overlay in this study. Other studies1,25 that described methods for 3D imaging superimposition in orthognathic surgery utilized Procrustes analysis with errors of ~2 mm for some anatomical landmarks.
This study applied surface distance calculation to quantify mandibular rotations and displacement. The calculation of surface distance for each boundary point is computationally expensive, as each contour point is compared with all the other ones. These methods differ from Cevidanes et al11,12 and Hajeer et al,1 who quantified 3D displacement using the x, y, z vectors of landmark displacement. Kawamata et al7 and Harris et al26 describe methods referring to linear and angular measures. VALMET calculates all the 3D Euclidean Distances from the pre-surgery model to the overlaid post-surgery model, to measure the displacement. This measure does not reflect properties integrated along the whole boundary and surface. For these reasons, the measure of surface distances needs to be complemented by visualization of the 3D colour-coded maps. Subsol et al,13 Andresen et al,14 and Mitteroecker et al15 proposed methods that have guided our studies in progress, using semi-landmarks on the surface to incorporate information about vectors in the vicinity of the landmark.
Condyles may have been displaced in 3D during surgery in both position and in inclination; therefore it is difficult to differentiate condylar displacement from errors in conventional radiography.7,27 The increasing availability of CT scans has led to innumerable publications on condylar position following bilateral sagittal split osteotomy,1,26 – 30 but no data have previously shown whether maxillary procedures induce condylar remodelling. Tuinzing, discussing the studies of Harris et al, emphasised that comparisons between similar investigations are difficult because of variations in osteosynthesis screws and plates, the type of dentofacial deformity, and timing of assessment. 26 The 3D superimposition method described in our study allows identification of even small changes, which helps overcome the limitations that have been described previously.
Conclusion
The technique used in this study provides a valid and reproducible 3D assessment of craniofacial structures. These methods may be used to identify treatment outcomes and different patterns of remodelling following orthognathic surgery.
The visualization of 3D model superimposition and the surface distance calculations can help orthodontists, surgeons and other healthcare providers to better plan treatment. (Supported by NIDCR DE005215-26).
References
- 1.Hajeer MJ, Ayoub AF, Millett DT, Bock M, Siebert JP. Three-dimensional imaging in orthognathic surgery: The clinical application of a new method. Int J Adult Orthod Orthognath Surg. 2002;17:318–330. [PubMed] [Google Scholar]
- 2.Mah J, Hatcher D. Three-dimensional craniofacial imaging. Am J Orthod Dentofac Orthop. 2004;126:308–309. doi: 10.1016/j.ajodo.2004.06.024. [DOI] [PubMed] [Google Scholar]
- 3.Ludlow JB, Davies-Ludlow LE, Brooks SL. Dosimetry of two extraoral direct digital imaging devices: NewTom cone beam CT and Orthophos Plus DS panoramic unit. Dentomaxillofac Radiol. 2003;32:229–234. doi: 10.1259/dmfr/26310390. [DOI] [PubMed] [Google Scholar]
- 4.Chirani RA, Jacq JJ, Meriot P, Roux C. Temporomandibular joint: A methodology of magnetic resonance imaging 3-D reconstruction. Oral Surg Oral Med Oral Pathol Oral Radiol Endod. 2004;97:756–761. doi: 10.1016/j.tripleo.2004.02.073. [DOI] [PubMed] [Google Scholar]
- 5.Ono I, Ohura T, Narumi E, Kawashima K, Matsuno I, Nakamura S, et al. Three-dimensional analysis of craniofacial bones using three-dimensional computer tomography. J Craniomaxillofac Surg. 1992;20:49–60. doi: 10.1016/s1010-5182(05)80468-8. [DOI] [PubMed] [Google Scholar]
- 6.Nkenke EN, Zachow S, Benz M, Maier T, Veit K, Benz S, et al. Fusion of computed tomography data and optical 3D images of the dentition for streak artefact correction in the simulation of orthognathic surgery. Dentomaxillofac Radiol. 2004;33:226–232. doi: 10.1259/dmfr/27071199. [DOI] [PubMed] [Google Scholar]
- 7.Kawamata A, Fujishita M, Kuniteru N, Kanematu N, Niwa K, Langlais R. Three-dimensional computed tomography evaluation of postsurgical condylar displacement after mandibular osteotomy. Oral Surg Oral Med Oral Pathol Oral Radiol Endod. 1998;85:371–376. doi: 10.1016/s1079-2104(98)90059-2. [DOI] [PubMed] [Google Scholar]
- 8.Harrell WE, Jr, Hatcher DC, Bolt RL. In search of anatomic truth: 3-dimensional digital modeling and the future of orthodontics. Am J Orthod Dentofac Orthop. 2002;122:325–330. doi: 10.1067/mod.2002.126147. [DOI] [PubMed] [Google Scholar]
- 9.Miller AJ, Koutaro M, Hatcher DC. New diagnostic tools in orthodontics. Am J Orthod Dentofac Orthop. 2004;126:395–396. doi: 10.1016/j.ajodo.2004.04.014. [DOI] [PubMed] [Google Scholar]
- 10.Xia J, Samman N, Yeung RWK, Shen SG, Wang D, Ip HHS, et al. Three-dimensional virtual reality surgical planning and simulation workbench for orthognathic surgery. Int J Adult Orthod Orthognath Surg. 2000;15:265–282. [PubMed] [Google Scholar]
- 11.Cevidanes LHS, Franco AA, Gerig G, Proffit WR, Slice DE, Enlow DH, et al. Mandibular growth and response to orthopedic therapy in 3D magnetic resonance images. Am J Orthod Dentofac Orthop. 2005;128:16–26. doi: 10.1016/j.ajodo.2004.03.032. [DOI] [PubMed] [Google Scholar]
- 12.Cevidanes LHS, Franco AA, Gerig G, Proffit WR, Slice DE, Enlow DH, et al. Relative mandibular growth vectors using high resolution. Am J Orthod Dentofac Orthop. 2005;128:27–34. doi: 10.1016/j.ajodo.2004.03.033. [DOI] [PubMed] [Google Scholar]
- 13.Subsol G, Thirion JP, Ayache N. A scheme for automatically building three-dimensional morphometric anatomic atlases: application to skull atlas. Med Image Anal. 1998;2:37–60. doi: 10.1016/s1361-8415(01)80027-x. [DOI] [PubMed] [Google Scholar]
- 14.Andresen R, Bookstein FL, Conradsen K, Ersboll BK, Marsh JL, Kreiborg S. Surface-bounded growth modeling applied to human mandibles. IEEE Trans Med Imaging. 2000;19:1053–1063. doi: 10.1109/42.896780. [DOI] [PubMed] [Google Scholar]
- 15.Mitteroecker P, Gunz P, Bookstein FL. Semilandmarks in three dimensions. In: Slice DL, editor. Modern morphometrics in physical anthropology. New York, NY: Kluwer Academic Publishers; 2004. [Google Scholar]
- 16.Mozzo P, Procacci C, Tacconi A, Martini PT, Andreis IA. A new volumetric CT machine for dental imaging based on the cone-beam technique: preliminary results. Eur Radiol. 1998;8:1558–1564. doi: 10.1007/s003300050586. [DOI] [PubMed] [Google Scholar]
- 17.Yushkevich P. [Accessed 27 July 2005];ITK - SNaP Integration, NLM Insight. Webpage: http://www.itk.org/index.htm.
- 18.Maes F, Collignon A, Vandermeulen D, Marchal G, Suetens P. Multimodality image registration by maximization of mutual information. IEEE Trans Med Imaging. 1997;16:187–198. doi: 10.1109/42.563664. [DOI] [PubMed] [Google Scholar]
- 19.Gerig G, Jomier M, Chakos M. In: Niessen W, Viergever M, editors. Valmet: a new validation tool for assessing and improving 3D object segmentation; MICCAI 2001: Proceedings of the International Society and Conference Series on Medical Image Computing and Computer-Assisted Intervention; 14–17 Oct 2001; Utrecht, Netherlands. Berlin: Springer; 2001. pp. 516–528. [Google Scholar]
- 20.Bailey LJ, Cevidanes LHS, Proffit WR. Stability and predictability of orthognathic surgery. Am J Orthod Dentofac Orthop. 2004;126:273–277. doi: 10.1016/S0889540604005207. [DOI] [PMC free article] [PubMed] [Google Scholar]
- 21.Parks ET. Computed tomography applications for dentistry. Dent Clin North Am. 2000;44:371–410. [PubMed] [Google Scholar]
- 22.Mol A. Image processing tools for dental applications. Dent Clin North Am. 2000;44:299–317. [PubMed] [Google Scholar]
- 23.Takács B, Pieper S, Cebral J, Kiss B, Benedek B, Szijártó G. SPIE Electronic Imaging. Vol. 0. California: San Jose; 2004. Jan, Facial modeling for plastic surgery using magnetic resonance imagery and 3D surface data; pp. 18–22. [Google Scholar]
- 24.Heiland M, Habermann CR, Schmelze R. Indications and limitations of intraoperative navigation in maxillofacial surgery. J Oral Maxillofac Surg. 2004;62:1059–1063. doi: 10.1016/j.joms.2004.02.013. [DOI] [PubMed] [Google Scholar]
- 25.Khambay B, Nebel JC, Bowman J, Walker F, Hadley D, Ayoub A. 3D stereophotogrammetric image superimposition onto 3D CT scan images: the future of orthognathic surgery. A pilot study. Int J Adult Orthodon Orthognath Surg. 2002;17:331–341. [PubMed] [Google Scholar]
- 26.Harris MD, Van Sickels JE, Alder M. Factors influencing condylar position after the bilateral sagittal split osteotomy fixed with bicortical screws. J Oral Maxillofac Surg. 1999;57:650–654. doi: 10.1016/s0278-2391(99)90422-6. discussion 654-655. [DOI] [PubMed] [Google Scholar]
- 27.Lee W, Park JU. Three-dimensional evaluation of positional change of the condyle after mandibular setback by means of bilateral sagittal split ramus osteotomy. Oral Surg Oral Med Oral Pathol Oral Radiol Endod. 2002;94:305–309. doi: 10.1067/moe.2002.126452. [DOI] [PubMed] [Google Scholar]
- 28.Bettega G, Cinquin P, Lebeua J, Raphael B. Computer-assisted orthognathic surgery: clinical evaluation of a mandibular condyle repositioning system. J Oral Maxillofac Surg. 2002;60:27–34. doi: 10.1053/joms.2002.29069. [DOI] [PubMed] [Google Scholar]
- 29.Magalhaes AE, Stella JP, Tahasuri TH. Changes in condylar position following bilateral sagittal split ramus osteotomy with setback. Int J Adult Orthodon Orthognath Surg. 1995;10:137–145. [PubMed] [Google Scholar]
- 30.Ueki K, Marukawa K, Nakagawa K, Yamamoto E. Condylar and temporomandibular joint disc positions after mandibular osteotomy for prognathism. J Oral Maxillofac Surg. 2002;60:1424–1432. doi: 10.1053/joms.2002.36098. [DOI] [PubMed] [Google Scholar]


