Abstract
We labeled hyaluronan (HA) with two fluorophores, fluorescein amine and rhodamine B amine. These two fluorophores are suitable for a fluorescence (Foerster) resonance energy transfer (FRET) which results in a fluorescein quenching and an enhanced rhodamine emission. Such labeled HA (HA-FRET) is a potential sensor for HA degradation. We studied fluorescence properties of HA-FRET in the absence and presence of hyaluronidase enzyme (HA-ase). The time-resolved fluorescence measurements indicate more than 50% of FRET in the absence of HA-ase. In the presence of HA-ase FRET decreases with time, and relative fluorescence intensities of fluorescein and rhodamine shifts to fluorescein indicating a release of FRET. The kinetics of the digestion process of HA by HA-ase depends on the concentration of the enzyme. We demonstrate that simultaneous measurements of green and red emission of HA-FRET can be used in ratio metric detection of the HA-ase presence and activity. This in turn, can be utilized for the construction of a robust but reliable HA-ase sensing device.
Keywords: hyaluronan, FRET, hyaluronidase, fluorescence, ratio metric sensing
1. INTRODUCTION
Hyaluronan (HA), a linear, non-sulfated glycosaminoglycan is composed of multiple subunits of D-glucuronic acid (GlcA) and N-acetylglucosamine (GlcNAc) and has the primary structure [β1→4GlcA β1→3GlcNAc]n. With more than 10,000 disaccharide repeats (n > 10,000), a HA molecule can exceed 4,000 kDa (each disaccharide is ~400 Da) in molecular mass and have an extended length of >10 μm. In the skin, HA serves as a major structural component in the dermal extracellular matrix and as a filling material in the epidermis [1, 2]. Keratinocytes (the major cell type in the epidermis) actively synthesize and degrade HA with a half-life of < 24 hr [3, 4]. Tammi et al. [5] has shown that keratinocytes endocytose HA by CD44-mediated endocytosis and bulk phase macropinocytosis. HA is then degraded in lysosomes by HA degrading enzymes, termed ”hyaluronidases”. Despite its chemical simplicity, HA is now known to exhibit diverse biological functions including: a) maintenance of tissue structural integrity, b) formation of highly hydrated matrices around individual cells, c) promotion of cellular migration including metastasis, and d) mediation of intercellular and intracellular signaling. This functional diversity most likely reflects the ability of HA to interact with a variety of proteins.
The hyaluronidases constitute a family of enzymes that degrade HA, although chondroitin and chondroitin sulfate can be degraded at a significantly slower rate [6]. The hyaluronidases are endoglycosidases that catalyze HA depolymerization via cleavage of the β-N-acetyl-D-glucosaminidic bonds. In humans, five hyaluronidase genes and one hyaluronidase pseudogene has been described [7]. The hyaluronidase genes are clustered on chromosome 3p21.3 (Hyal1, Hyal2 and Hyal3) and chromosome 7q31.3 (Hyal4, Hyal1 pseudogene HyalP1 and PH20). Thus, the hyaluronidase genes appear to have resulted from duplication. The deduced hyaluronidase amino acid sequences show that these enzymes share approximately 40% identity [8]. The hyaluronidase enzymes are designated as Hyal1, Hyal2, Hyal3, Hyal4 and PH20. Hyal1 thru 4 are expressed in somatic tissues and PH20 is expressed in sperm and the epididymal lumen [9] although PH20 can also be aberrantly expressed in human malignancies [10–12].
Structural studies of bee venom hyaluronidase have shown that this enzyme has a (β / α)8 TIM barrel structure. The catalytic site for HA in the bee venom hyaluronidase is a groove that can interact with an HA hexasaccharide. The proposed mechanism for HA cleavage is an acid-base mode for catalysis with Asp111 and Glu113 being key amino acids in the bee venom enzyme for its activity. Briefly, Glu113 acts as a proton donor (acid) and the N-acetyl group of the N-acetylglucosamine as the proton acceptor (base). The Asp111 group then cleaves the β-N-acetyl-D-glucosaminidic bond [13]. Importantly, the Glu and Asp residues are conserved in the hyaluronidases underscoring their potential importance in enzymatic activity. In fact, site-directed mutagenesis studies of PH20 have verified that the Asp and Glu amino acids are essential for the catalytic activity of this enzyme [14]. In addition to the catalytic site, the hyaluronidases contain a HA binding groove that is required for enzymatic activity [15]. A number of cancer cell types overexpress hyaluronidase enzymes including prostate [10], bladder carcimoma [16], squamous cell head and neck cancer [17] and MM [18]. The increased activity of the hyaluronidases has been correlated with several tumor cell behaviors including tissue invasion [19], resistance to apoptosis [20] and the potentiation of angiogenesis [18].
Hyaluronidase activity has been evaluated as a biomarker in bladder cancer. Tumor associated Hyal1 is released into the urine of bladder cancer patients [21]. Urinary hyaluronidase activity was elevated in patients with intermediate and high grade bladder cancer as compared with patients with: a) low grade bladder cancer, b) patients with a history of bladder cancer, c) normal individuals, and d) patients with benign urologic conditions [22]. Expression of Hyal1 protein in diseased tissue is prognostic for bladder cancer progression and recurrence [23]. Using malignant tissue, Kramer et al. similarly showed that expression of Hyal1 and hyaluronan synthase-1 mRNA in malignant tissue predicted bladder cancer metastasis and disease recurrence [24]. These findings underscore the potential utility of the hyaluronidases to serve as biomarkers for bladder cancer.
In our previous report we developed a novel fluorescent substrate (termed HA-FRET) to measure hyaluronidase enzyme kinetics [25]. This fluorescent substrate is highly labeled with two dyes: fluorescein as a green donor fluorophore, and rhodamin B as a red acceptor fluorophore. The excitation energy is transferred from the fluorescein moiety to the rhodamine B moiety. We showed that the HA-FRET probe does not suffer from inner filter effects and that it is a useful substrate to measure hyaluronidase enzyme kinetics. Herein, we present a spectroscopic evaluation of HA-FRET using steady state and time resolved fluorescence methods. Based on our results, we propose that HA-FRET is a useful substrate for HA-ase sensing.
2. MATERIALS AND METHODS
Sodium hyaluronate from bacterial fermentation was obtained from Acros Organics. Fluorescein amine, rhodamine B amine, dimethyl sulfoxide (DMSO), guanidine hydrochloride, acetaldehyde, cyclohexyl isocyanide, Sephadex G-75, and bovine testes hyaluronidase (EC 3.2.1.35, type 1-S, 451 U/mg) all were obtained from Sigma–Aldrich. Dulbecco's phosphate-buffered saline (PBS) was purchased from Invitrogen Life Technologies and was adjusted to pH 6.0 with 0.1 N HCl after reconstitution in distilled water (dH2O). Slide-A-Lyser dialysis cassettes (10,000 molecular weight cutoff) were purchased from Pierce Chemical.
2.1. Preparation of conjugated Hyaluronan (HA-FRET Probe)
HA was covalently conjugated to fluorescein amine and rhodamine B amine using the condensation reaction [26]. In this reaction, the fluorescein amine and rhodamine B amine molecules were coupled to the carboxylic acid functional groups of the glucuronic acid monosaccharides. Briefly, HA was dissolved to 1.25 mg/ml in dH2O. The HA solution was diluted 1:2 in DMSO, and fluorescein amine and rhodamine B amine (both predissolved as DMSO stock solutions) were simultaneously added to final concentrations of 0.42 mg/ml for each of the fluorophores. Acetaldehyde and cyclohexyl isocyanide were added to 0.04% (v/v), and the reaction was allowed to proceed for 16 h at 25 °C. Afterward, the solution was diluted 1:14 in ethanol/guanidine HCl (50 μl of 3 M guanidine HCl per 900 μl of 100% ethanol) and the HA was allowed to precipitate overnight at −20 °C. The precipitate was centrifuged, the pellet washed twice with ice cold ethanol and then dissolved in 1 ml of dH2O, followed by extensive dialysis against dH2O. Purity of the dual-labeled HA conjugate was ascertained by applying the sample to a Sephadex G-75 size exclusion column and monitoring the fluorescence of the fractions using a spectrophotometer. The concentration of HA was estimated using the HA ELISA kit, and the concentrations of fluorescein amine and rhodamine B amine were determined using their molar extinct extinction coefficients in Dulbecco's PBS (pH 6.0). The extinction coefficient for fluorescein amine was 49,000 M−1 cm−1 at 490 nm and for rhodamine B amine was 107,034 M−1 cm−1 at 565 nm.
2.2. Fluorescence Measurements of Hyaluronan Hydrolysis
HA-FRET probe (labeled hyaluronan) was incubated with different concentration of hyaluronidase in PBS at room temperature. At selected time points, fluorescence emission spectra were collected using Cary Eclipse spectrofluorometer (Varian Inc., Australia). Measurements were performed in 0.4×0.4 cm quartz cells with the excitation at 470 nm and emission at 520 nm.
2.3. Lifetime Measurements of HA-FRET Probe
Fluorescence lifetime measurements were done using FluoTime 200 fluorometer (PicoQuant, GmbH, Berlin, Germany). This time–resolved instrument is equipped with an ultrafast detector, a Hamamatsu R3809U-50 microchannel plate photomultiplier (MCP). For the excitation we used a 470 nm picosecond pulsed laser diode. The detection was through a monochromator supported by 495 nm long wave pass filter in order to eliminate a scattering excitation light. The decay data were analyzed with FluoFit, version 5.0 software (PicoQuant, GmbH). Fluorescence intensity decays were analyzed by reconvolution with the instrument response function and analyzed as a sum of experimental terms:
| (1) |
Where I(t) is the fluorescence intensity at time t and αi ie a pre-exponentioal factor representing the fractional contribution to the time-resolved decay of the component with the lifetime τi . The amplitude average lifetime was calculated as .
2.4. Anisotropy Measurements of Hyaluronan Hydrolysis
For anisotropies, fluorescence signals were measured using the Cary Eclipse spectrofluorometer equipped with polarizer (Varian Inc.) at excitation and emission paths. Measurements were performed in 0.4×0.4 cm quartz cells with the excitation at 470 nm and emission at 520 nm. Measurements were taken with vertically oriented excitation polarizer in combination with either vertically or horizontally oriented emission polarizer. From these measurements, anisotropies were calculated using the expression
| (2) |
Where r is the anisotropy, IVV is the intensity measured with vertically oriented excitation polarizer and vertically oriented emission polarizer, IVH is the intensity measured with vertically oriented excitation polarizer and horizontally oriented emission polarizer and G is the instrument factor.
3. RESULTS AND DISCUSSION
3.1. Fluorescence Spectra
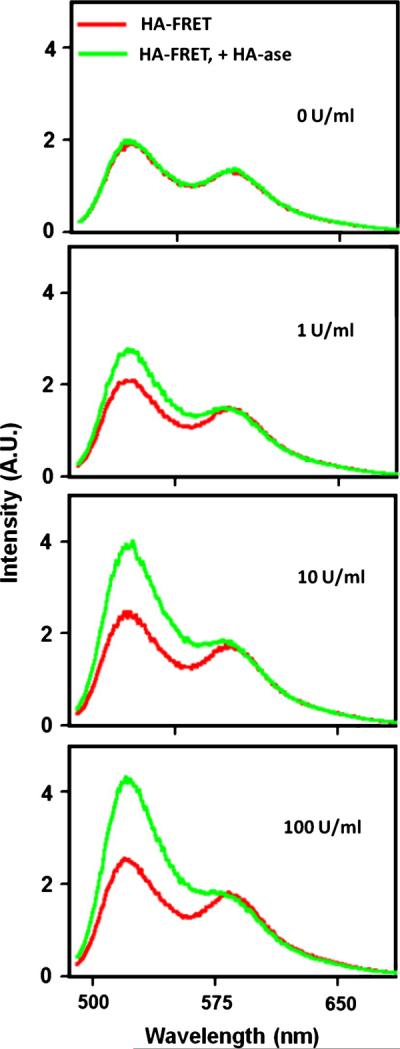
We measured fluorescence spectra of HA-FRET probe (Figure 1) in the absence and presence of HA-ase enzyme. The samples were incubated for one hour with the different concentrations of the enzyme at room temperature. In the absence of the enzyme (Figure 1, top) we did not notice any changes in the HA-FRET fluorescence spectrum. It should be also noted that the intensity of the rhodamine B at 590 nm is significantly stronger than observed from the rhodamine B solution without fluorescein. The presence of HA-ase in the solution (Figure 1, bottom panels) results in an increased emission of the fluorescein, and this effect depends on the concentration of the enzyme. The observed spectral changes in HA-FRET fluorescence are consistent with a reduction of FRET in the presence of HA-ase enzyme.
Figure 1.

Emission spectra of HA-FRET in the absence and presence of HA-ase. The concentration of HA-FRET probe was 1 μM. The measurements were done at room temperature, after one hour of incubation with the enzyme. The excitation was 470 nm.
3.2. Fluorescence Lifetimes
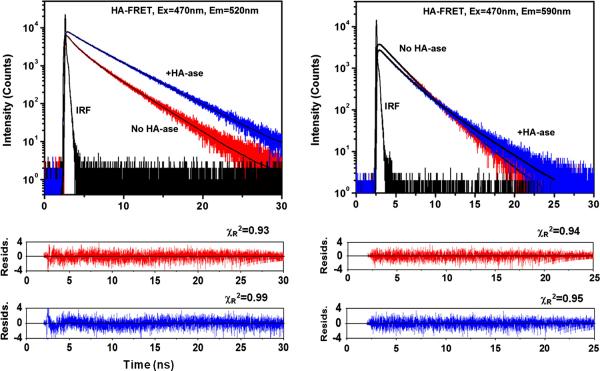
We questioned if the observed spectral changes are accompanied by lifetime changes, i.e., if these changes are the result of an increase/decrease of a non-radiative rates of fluorescein and rhodamine emissions. The intensity decay measurements are presented in Figure 2, left for fluorescein (520 nm), and Figure 2, right for rhodamine B (590 nm) emissions. The fluorescein is strongly quenched in the absence of HA-ase, showing a heterogeneous decay (three exponents are needed to fit the data with lifetimes: 0.2ns, 1.28ns and 3.33ns and amplitudes: 0.35, 0.33 and 0.32, respectively) with the amplitude average lifetime of 1.64ns. In the presence of HA-ase, the fluorescein intensity decay becomes longer and less heterogeneous (two exponents are needed to fit the data with lifetimes: 1.24ns and 3.99ns, and amplitudes: 0.17 and 0.83, respectively) with the amplitude averaged lifetime of 3.52ns. In contrast, at the observation 590 nm, where rhodamine B emits, the lifetime is longer in the absence of HA-ase (three exponents are needed to fit the data with lifetimes: 1.65ns, 2.64ns and 0.21ns and amplitudes: 0.56, 0.57 and −0.13, respectively) with the amplitude average lifetime of 2.42ns. In addition, the multi-exponential fit to the data reveals a negative component. In the presence of HA-ase the lifetime is shorter (three exponents are needed to fit the data with lifetimes: 0.18ns, 1.78ns and 3.55ns and amplitudes: 0.11, 0.62 and 0.27, respectively) with the amplitude average lifetime of 2.08ns. The time-resolved measurements strongly indicate the release of FRET in the presence of HA-ase.
Figure 2.
Fluorescence intensity decays of 1 μM HA-FRET in the absence and presence of HA-ase. The HA-FRET sample (0.25ml) was incubated with 100 U/ml HA-ase for 1 hour. Left: observation at the donor emission. In the presence of HA-ase, the lifetime of the donor increases and the intensity decay becomes less heterogeneous, indicating a release of FRET.
Right: observation at the acceptor emission. In the presence of the HA-ase, the lifetime becomes shorter. In the absence of the HA-ase, the decay is longer and an approximation with a multi-exponential model results in a one weak negative exponent which is characteristic for an excited state reaction.
3.3. Fluorescence Anisotropy
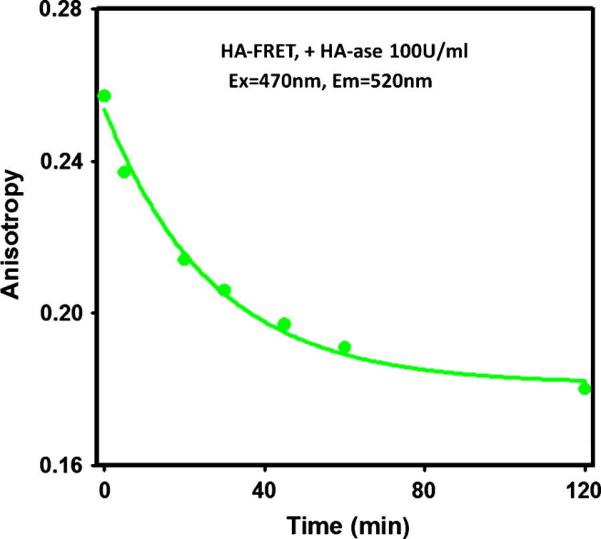
The digestion of HA-FRET probe by HA-ase enzyme results in smaller subunits of the macromolecule. In addition, acceptors are being spatially separated from the donors which results in a longer lifetime of the fluorescein. Both effects - the fragmentation and longer lifetime - should lower the donor fluorescence polarization. Figure 3 shows the time-dependent fluorescence anisotropy of the HA-FRET probe at the fluorescein (520 nm) emission after addition of HA-ase enzyme. There is a progressive decrease in fluorescence anisotropy. Polarization measurements confirm the effective cleavage of HA-FRET probe by the enzyme.
Figure 3.

Progressive anisotropy changes of the 1 μM HA-FRET probe in the presence of HA-ase. The observation was at the donor fluorescence. No changes in the fluorescence anisotropy were observed in the absence of the HA-ase. Two effects resulting from the HA-FRET cleavage are responsible for the anisotropy decrease: 1) smaller fragments of the macromolecule rotate faster, 2) a lifetime of fluorescein donor increases in the absence of acceptors.
3.4 FRET-based Ratiometric Sensing of HA-ase
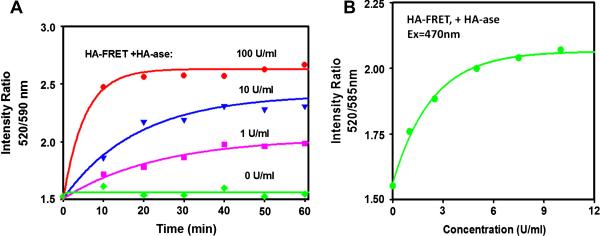
Next, we studied initial kinetics of HA-FRET probe cleavage using different concentrations of the HA-ase enzyme. In order to eliminate geometrical factors and variations in the excitation intensity, we measured a ratio of a green to red intensity. The results shown on Figure 4A indicate a strong dependence of digestion kinetics on the enzyme concentration. Such dependence facilitates the detection of the presence and activity of the HA-ase enzyme. Figure 4B shows the dependence of the 520nm/590nm intensity on the concentration of HA-ase.
Figure 4.

A) Time-dependent intensity ratios (green/red emission) of HA-FRET probe in the absence and presence of HA-ase. The concentration of HA-FRET sample (0.25 ml) was 1 μM, the excitation was 470 nm, and the experiment was done at room temperature. B) The dependence of HA-FRET probe's green/red intensities on the HA-ase concentration. The concentration of HA-FRET probe (0.25 ml) was 1 μM, and the incubation time at room temperature was 1 hour.
In conclusion: Measurements presented above show that it is possible to trace the HA-ase activity from the changes in the HA-FRET substrate fluorescence. The dynamic range of these changes can be significantly extended using donor and acceptor dyes more suitable for the resonance energy transfer. The observed change upon addition of HA-ase towards increased intensity of the donor is an advantage over probes quenched by analyte. The proposed ratio-metric detection method reduces many undesirable experimental factors. For example, emission intensity measurements are based on probe concentration and could lead to experimental variation due to lot-to-lot differences in HA-FRET preparations. At the same time, ratio-metric sensing should be more sensitive than single point acquisition of donor or acceptor emissions. We believe that the presented study will inspire researchers from the sensing field to construct a device based on the fluorescence ratio-metric detection of HA-ase. In addition, several parameters can be measured simultaneously, like polarization and lifetimes, and all data should be analyzed globally. One can imagine a fluorescence-based multi-modal sensing device, which will be small, robust, computerized and relatively inexpensive. Such a device may be especially useful for detecting Hyal1 activity in the urine of bladder carcinoma patients.
ACKNOWLEDGEMENT
This work was supported by NIH R21CA149897 and RO1 EB012003 grants (Z.G.) and NIH RO1 AR48840 (M.E.M.).
REFERENCES
- 1.Tammi R, Ripellino JA, Margolis RU, Tammi M. Localization of epidermal hyaluronic acid using the hyaluronate binding region of cartilage proteoglycan as a specific probe. J. Invest. Dermatol. 1988;90:412–414. doi: 10.1111/1523-1747.ep12456530. [DOI] [PubMed] [Google Scholar]
- 2.Tammi R, Saamanen AM, Maibach HI, Tammi M. Degradation of newly synthesized high molecular mass hyaluronan in the epidermal and dermal compartments of human skin in organ culture. J. Invest. Dermatol. 1991;97:126–130. doi: 10.1111/1523-1747.ep12478553. [DOI] [PubMed] [Google Scholar]
- 3.Tammi R, MacCallum D, Hascall VC, Pienimaki JP, Hyttinen M, Tammi M. Hyaluronan bound to CD44 on keratinocytes is displaced by hyaluronan decasaccharides and not hexasaccharides. J. Biol. Chem. 1998;273:28878–28888. doi: 10.1074/jbc.273.44.28878. [DOI] [PubMed] [Google Scholar]
- 4.Tammi R, Ripellino JA, Margolis RU, Maibach HI, Tammi M. Hyaluronate accumulation in human epidermis treated with retinoic acid in skin organ culture. J. Invest. Dermatol. 1989;92:326–332. doi: 10.1111/1523-1747.ep12277125. [DOI] [PubMed] [Google Scholar]
- 5.Tammi R, Rilla K, Pienimaki JP, MacCallum DK, Hogg M, Luukkonen M, Hascall VC, Tammi M. Hyaluronan enters keratinocytes by a novel endocytic route for catabolism. J. Biol. Chem. 2001;276:35111–35122. doi: 10.1074/jbc.M103481200. [DOI] [PubMed] [Google Scholar]
- 6.Weigel PH, Hascall VC, Tammi M. Hyaluronan synthases. J. Biol. Chem. 1997;272:13997–14000. doi: 10.1074/jbc.272.22.13997. [DOI] [PubMed] [Google Scholar]
- 7.Csoka AB, Frost GI, Stern R. The six hyaluronidase-like genes in the human and mouse genomes. Matrix Biol. 2001;20:499–508. doi: 10.1016/s0945-053x(01)00172-x. [DOI] [PubMed] [Google Scholar]
- 8.Lokeshwar VB, Selzer MG. Both a tumor promoter and suppressor, Hyalurondiase: Semin. Cancer Biol. 2008;18:281–287. doi: 10.1016/j.semcancer.2008.03.008. [DOI] [PMC free article] [PubMed] [Google Scholar]
- 9.Cherr GN, Yudin AI, Overstreet JW. The dual functions of GPI-anchored PH-20: Hyaluronidase and intracellular signaling. Matrix Biology. 2001;20:515–525. doi: 10.1016/s0945-053x(01)00171-8. [DOI] [PubMed] [Google Scholar]
- 10.Madan AK, Pang Y, Wilkiemeyer MB, Yu D, Beech DJ. Increased hyaluronidase expression in more aggressive prostate adenocarcinoma. Oncol. Rep. 1999;6:1431–1433. doi: 10.3892/or.6.6.1431. [DOI] [PubMed] [Google Scholar]
- 11.Godin DA, Fitzpatrick PC, Scandurro AB, Belafsky PC, Woodworth BA, Amedee RG, Beech DJ, Beckman BS. PH20: A novel tumor marker for laryngeal cancer. Arch. Otolaryngol. Head Neck Surg. 2000;126:402–404. doi: 10.1001/archotol.126.3.402. [DOI] [PubMed] [Google Scholar]
- 12.Beech DJ, Madan AK, Deng N. Expression of PH-20 in normal and neoplastic breast tissue. J. Surg. Res. 2002;103:203–207. doi: 10.1006/jsre.2002.6351. [DOI] [PubMed] [Google Scholar]
- 13.Markovic-Housley Z, Miglierini G, Soldatova L, Rizkallah PJ, Muller U, Schirmer T. Crystal structure of hyaluronidase, a major allergen of bee venom. Structure. 2000;8:1025–1035. doi: 10.1016/s0969-2126(00)00511-6. [DOI] [PubMed] [Google Scholar]
- 14.Arming S, Strobl B, Wechselberger C, Kreil G. In vitro mutagenesis of PH-20 hyaluronidase from human sperm. Eur. J. Biochem. 1997;247:810–814. doi: 10.1111/j.1432-1033.1997.t01-1-00810.x. [DOI] [PubMed] [Google Scholar]
- 15.Lokeshwar VB, Schroeder GL, Carey RI, Soloway MS, Iida N. Regulation of hyaluronidase activity by alternative mRNA splicing. J. Biol. Chem. 2002;277:33654–33663. doi: 10.1074/jbc.M203821200. [DOI] [PubMed] [Google Scholar]
- 16.Pham HT, Block NL, Lokeshwar VB. Tumor-derived hyaluronidase: A diagnostic urine marker for high-grade bladder cancer. Cancer Res. 1997;57:778–783. [PubMed] [Google Scholar]
- 17.Franzman EJ, Schroeder GL, Goodwin WJ, Weed DT, Fisher P, Lokeshwar VB. Expression of tumor markers hyaluronic acid and hyaluronidase (HYAL1) in head and neck tumors. Int. J. Cancer. 2003;106:438–445. doi: 10.1002/ijc.11252. [DOI] [PubMed] [Google Scholar]
- 18.Liu D, Pearlman E, Diaconu E, Guo K, Mori H, Haqqi T, Markowitz S, Willson J, Sy MS. Expression of hyaluronidase by tumor cells induces angiogenesis in vivo. Proc. Natl. Acad. Sci. USA. 1996;93:7832–7837. doi: 10.1073/pnas.93.15.7832. [DOI] [PMC free article] [PubMed] [Google Scholar]
- 19.Lokeshwar VB, Cerwinka WH, Lokeshwar BL. HYAL1 hyaluronidase: A molecular determinant of bladder tumor growth and invasion. Cancer Res. 2005;65:2243–2250. doi: 10.1158/0008-5472.CAN-04-2805. [DOI] [PubMed] [Google Scholar]
- 20.Xu H, Ito T, Tawada A, Maeda H, Yamanokuchi H, Isahara K, Yoshida K, Uchiyama Y, Asari A. Effect of hyaluronan oligosaccharides on the expression of heat shock protein 72. J. Biol. Chem. 2002;277:17308–17314. doi: 10.1074/jbc.M112371200. [DOI] [PubMed] [Google Scholar]
- 21.Hautmann SH, Lokeshwar VB, Schroeder GL, Civantos F, Duncan RC, Gnann R, Friedrich MG, Soloway MS. Elevated tissue expression of hyaluronic acid and hyaluronidase validates the HA-HAase urine test for bladder cancer. J. Urol. 2001;165:2068–2074. doi: 10.1097/00005392-200106000-00072. [DOI] [PubMed] [Google Scholar]
- 22.Pham HT, Block NL, Lokeshwar VB. Tumor-derived hyaluronidase: A diagnostic urine marker for high-grade bladder cancer. Cancer Res. 1997;57:778–783. [PubMed] [Google Scholar]
- 23.Kramer MW, Golshani R, Merseburger AS, Knapp J, Garcia A, Hennenlotter J, Duncan RC, Soloway MS, Jorda M, Kuczyk MA, Lokeshwar VB. HYAL-1 hyaluronidase: a potential prognostic indicator for progression to muscle invasion and recurrence in bladder cancer. Eur Urol. 2010;57:86–93. doi: 10.1016/j.eururo.2009.03.057. [DOI] [PMC free article] [PubMed] [Google Scholar]
- 24.Kramer MW, Escudero DO, Lokeshwar SD, Golshani R, Ekwenna OO, Acosta K, Merseburger AS, Soloway M, Lokeshwar VB. Association of hyaluronic acid family members (HAS1, HAS2, and HYAL-1) with bladder cancer diagnosis and prognosis. Cancer. doi: 10.1002/cncr.25565. n/a. doi: 10.1002/cncr.25565. [DOI] [PMC free article] [PubMed] [Google Scholar]
- 25.Zhang L-S, Mummert ME. Development of a fluorescent substrate to measure hyaluronidase activity. Anal. Biochem. 2008;379:80–85. doi: 10.1016/j.ab.2008.04.040. [DOI] [PMC free article] [PubMed] [Google Scholar]
- 26.de Belder AN, Wik KO. Preparation and properties of fluorescein-labelled hyaluronate. Carbohydrate Res. 1975;44:251–257. doi: 10.1016/s0008-6215(00)84168-3. [DOI] [PubMed] [Google Scholar]


