To the Editor:
Advances in next-generation sequencing platforms have reshaped the landscape of genomic and epigenomic research. Large consortiums such as the ENCyclopedia of DNA Elements (ENCODE), the Roadmap Epigenomics project and The Cancer Genome Atlas (TCGA) have generated tens of thousands of sequencing-based genome-wide datasets, creating a reference and resource for the scientific community. Small groups of researchers are now able to rapidly obtain huge volumes of genomic data and are in great need of putting their data in the context of the large consortium data for comparison. These data are often accompanied by rich metadata describing the sample and experiment, critical for their interpretation. Visualizing, navigating, and interpreting such data in a meaningful way is a daunting challenge1.
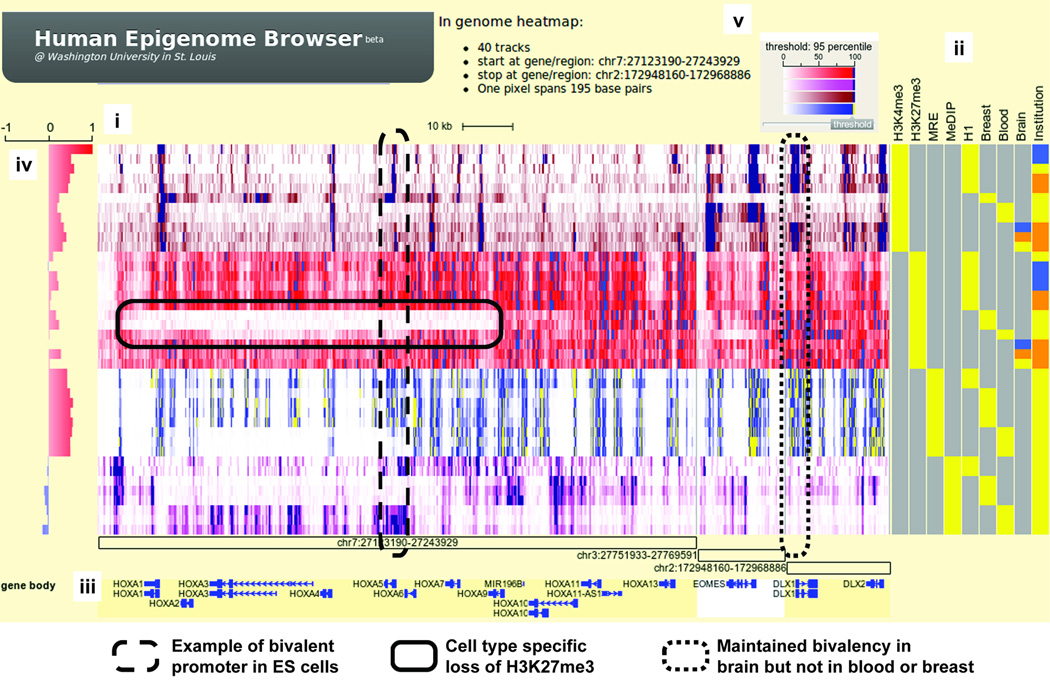
We have developed the Human Epigenome Browser to host Human Epigenome Atlas data produced by the Roadmap Epigenomics project2 and to support navigation of the Atlas and its interactive visualization, integration, comparison and analysis (http://epigenomegateway.wustl.edu/, see Supplementary Notes and Protocol for main components and use). The Browser is web-based and it extends the seminal concept invented by the UCSC Cancer Genomics Browser3 to support large, sequencing-based datasets. Epigenomic measurements are displayed as genome-heatmaps where color gradients reflect strength of the signal (Fig. 1, Supplementary Fig. 1). Metadata such as cell type, assay type, epigenetic mark and phenotype of the sample are encoded numerically and displayed in different colors by a “metadata heatmap” alongside the genome-heatmap (Fig. 1, Supplementary Fig. 2). Investigators can zoom and pan in a “Google Maps”-like style to examine dozens to hundreds of datasets at any level of detail from single nucleotides up to whole-genome, including a bird’s eye view (Supplementary Protocol). Data tracks can be sorted, organized, dragged and dropped individually or by any combination of their metadata (Supplementary Protocol). Investigators can also toggle between heatmap views and typical track-based, ‘wiggle’ views (Supplementary Fig. 1). In addition, investigators can visualize data for selected genomic features (e.g. promoters), any set of genes or genomic coordinates, or any pathways which are dynamically obtained from popular pathway resources (e.g. KEGG) (Supplementary Protocol). Investigators can also apply standard statistical analysis and display the results graphically on the browser (Supplementary Fig. 2, Protocol). These features help investigators quickly develop hypotheses and create biological insights from genome-scale data, as illustrated in an example where we identify tissue-specific DNA methylation of an LTR retrotransposon (Supplementary Fig. 7).
Figure 1.
Epigenomic landscape of bivalent domains. (i) Genomic heatmap of 36 datasets over three regions. Green: H3K4me3 ChIP-seq; Red: H3K27me3 ChIP-seq; Brownish-red: MRE-seq; Pink: MeDIP-seq. (ii) Metadata heatmap. Epigenetic marks and sample types are in different feature columns. For brain, yellow: substantia nigra; orange: hippocampus (middle portion); blue: anterior caudate. For institution, yellow: UCSF; blue: UCSD; orange: Broad Institute. (iii) Annotation tracks. Genomic coordinates of three regions are labeled with open boxes. Known genes are diagramed. (iv) Statistical correlation track. Pearson correlation coefficients were calculated between H3K4me3 track of H1 ES cell and all other tracks. (v) Color gradient scheme for genomic heatmap. In addition, green dashed-box highlights a bivalent promoter in H1 ES cells. Blue dashed-box highlights cell type specific loss of H3K27me3 compared to ES cells. Red dashed-box highlights a promoter whose bivalency is preserved in ES cells and in brain samples, but not in breast or blood.
We used the Browser to display the epigenomic landscape of three genomic domains around developmental genes in embryonic stem cells and multiple somatic tissues (Fig. 1). These domains are termed “bivalent” because they bear both active, H3K4me3 and repressive, H3K27me3 histone modifications in ES cells4, where H3K4me3 also correlates strongly with unmethylated DNA. In differentiated cells, however, H3K4me3 or H3K27me3 signals are selectively lost, consistent with keeping some developmental genes on and others off in specific cell types. The degree and scope of change is cell type specific, as illustrated by the differences in loss of H3K27me3 within the HoxA cluster which are also accompanied by differences in gain of DNA methylation. Interestingly, several somatic cell-types maintain bivalency at certain genes, suggesting novel roles for these developmental genes in these tissues.
The Human Epigenome Browser currently hosts close to one thousand epigenomics datasets from more than one hundred human cell/tissue types from the Human Epigenome Atlas, and another seven hundred datasets from the ENCODE project (Supplementary Methods). This includes an increasing number of full, base-resolution DNA methylomes, profiles of 26 different types of histone marks, locations of open chromatin, small RNA and strand-specific mRNA-seq based expression and RNA splicing profiles. We used advanced, multi-resolution data formats5 which require minimal system resources and support remote data access. Therefore, investigators can display their own genome-wide data and metadata on the Browser as custom tracks (Supplementary Figures) for direct comparison with the reference epigenomes, without having to transfer the entire dataset to the Browser. The Browser can be easily expanded to support any sequencing or array-based genomics projects including many that focus on human diseases. It is an increasingly important and widely accessible tool to derive biological insights from the unprecedented amount of high-quality genomic, epigenomic and expression data.
Supplementary Material
REFERENCE
- 1.Nielsen CB, Cantor M, Dubchak I, Wang T. Nat Methods. 2010;7(3 Suppl):S5–S15. doi: 10.1038/nmeth.1422. [DOI] [PubMed] [Google Scholar]
- 2.Bernstein BE, Stamatoyannopoulos JA, Costello JF, et al. Nat Biotechnol. 2010;28(10):1045–1048. doi: 10.1038/nbt1010-1045. [DOI] [PMC free article] [PubMed] [Google Scholar]
- 3.Zhu J, Sanborn JZ, Benz S, et al. Nat Methods. 2009;6(4):239–240. doi: 10.1038/nmeth0409-239. [DOI] [PMC free article] [PubMed] [Google Scholar]
- 4.Bernstein BE, Mikkelsen TS, Xie X, et al. Cell. 2006;125(2):315–326. doi: 10.1016/j.cell.2006.02.041. [DOI] [PubMed] [Google Scholar]
- 5.Kent WJ, Zweig AS, Barber G, et al. Bioinformatics. 2010;26(17):2204–2207. doi: 10.1093/bioinformatics/btq351. [DOI] [PMC free article] [PubMed] [Google Scholar]
Associated Data
This section collects any data citations, data availability statements, or supplementary materials included in this article.


