

Abstract
Noninvasive methods are needed to explore the heterogeneous tumor microenvironment and its modulation by therapy. Hybrid PET/MRI systems are being developed for small-animal and clinical use. The advantage of these integrated systems depends on their ability to provide MR images that are spatially coincident with simultaneously acquired PET images, allowing combined functional MRI and PET studies of intratissue heterogeneity. Although much effort has been devoted to developing this new technology, the issue of quantitative and spatial fidelity of PET images from hybrid PET/MRI systems to the tissues imaged has received little attention. Here, we evaluated the ability of a first-generation, small-animal MRI-compatible PET scanner to accurately depict heterogeneous patterns of radiotracer uptake in tumors.
Methods
Quantitative imaging characteristics of the MRI-compatible PET (PET/MRI) scanner were evaluated with phantoms using calibration coefficients derived from a mouse-sized linearity phantom. PET performance was compared with a commercial small-animal PET system and autoradiography in tumor-bearing mice. Pixel and structure-based similarity metrics were used to evaluate image concordance among modalities. Feasibility of simultaneous PET/MRI functional imaging of tumors was explored by following 64Cu-labeled antibody uptake in relation to diffusion MRI using cooccurrence matrix analysis.
Results
The PET/MRI scanner showed stable and linear response. Activity concentration recovery values (measured and true activity concentration) calculated for 4-mm-diameter rods within linearity and uniform activity rod phantoms were near unity (0.97 ± 0.06 and 1.03 ± 0.03, respectively). Intratumoral uptake patterns for both 18F-FDG and a 64Cu-antibody acquired using the PET/MRI scanner and small-animal PET were highly correlated with autoradiography (r > 0.99) and with each other (r = 0.97 ± 0.01). On the basis of these data, we performed a preliminary study comparing diffusion MRI and radiolabeled antibody uptake patterns over time and visualized movement of antibodies from the vascular space into the tumor mass.
Conclusion
The MRI-compatible PET scanner provided tumor images that were quantitatively accurate and spatially concordant with autoradiography and the small-animal PET examination. Cooccurrence matrix approaches enabled effective analysis of multimodal image sets. These observations confirm the ability of the current simultaneous PET/MRI system to provide accurate observations of intratumoral function and serve as a benchmark for future evaluations of hybrid instrumentation.
Keywords: PET/MRI, multimodal imaging, tumor heterogeneity, quantitative molecular imaging, preclinical
The tumor microenvironment greatly affects the efficacy of cancer treatment (1). Factors such as heterogeneous perfusion and subpopulations of cells within tumors affect tumor progression and response to therapy. Investigations of these factors usually involve measurements at a whole-tumor level (e.g., size) and tissue sampling for histologic or biochemical assays. Noninvasive imaging complements these studies by providing intact tissue information at multiple time points in the same individual (2).
The utility of multimodal imaging is well demonstrated in cancer research (3). Advances in hybrid PET/MRI systems (4) show particular promise for understanding the heterogeneous nature of the tumor microenvironment. For example, spatially and temporally matched, high-resolution anatomic and functional information such as the perfusion status (5), cellular density (6), and metabolic status of specific tissue regions acquired with MRI can enhance the interpretation of functional data provided by PET (e.g., oxygenation (7), cellular proliferation (8), and receptor expression (9)) and vice versa.
Conventional PET image analysis focuses on regions of interest (ROIs) encompassing whole tumors, with some studies omitting obvious necrotic regions during analysis (6). Efforts to improve the spatial resolution of reconstructed PET images (10) and availability of coregistered PET and MR images have engendered interest in understanding the heterogeneity of radionuclide uptake observed with PET. For example, a recent clinical study by Metz et al. examined heterogeneity of tumor perfusion using MRI and correlated it with PET studies of integrin expression and tumor metabolism (11). Similarly, Cho et al. compared MRI measures of tumor perfusion with uptake of the PET hypoxia tracer 18F-fluoromisonidazole within rat tumor xenografts (7).
Correct interpretation of PET images, especially within regions of heterogeneous tracer uptake, requires that fidelity be verified between these images and actual tissue activity concentration patterns. Characterization of PET instrumentation usually entails measuring a standard set of metrics in a variety of phantoms (12), followed by gross in vivo verification. Although this approach examines the general performance of the scanner, simple geometric patterns of phantoms may be insufficient to predict in vivo performance. To validate the heterogeneous spatial patterns seen in PET images, one needs to compare these images with a gold standard, such as quantitative autoradiography (QAR) (13).
We have evaluated the image quality of a first-generation MRI-compatible PET scanner (PET/MRI scanner) (14). Previous reports used standard metrics to assess the performance characteristics of the scanner (15) and its ability to function within the integrated PET/MRI environment (16). Here, we examined the image fidelity of the PET/MRI scanner and its ability to quantify heterogeneous uptake patterns in mice, compared with QAR and a commercial small-animal PET system. Phantoms were used to evaluate the quantitative capability of the PET/MRI scanner. Next, the 3 systems were used to image patterns of 18F-FDG and 64Cu-antibody uptake within mouse tumor xenografts. Finally, a preliminary, simultaneous in vivo diffusion MRI/radiolabeled antibody PET study was performed, and a cooccurrence matrix method was applied to analyze the bimodal dataset.
MATERIALS AND METHODS
MRI-Compatible PET Scanner
The PET/MRI scanner being evaluated has been described in detail (14). The system fits in a 7-T MRI system run using PARA-VISION4 (Bruker Biospin). PET data were acquired using custom software. PET/MRI data were collected with an energy window of 350–650 keV. No attenuation, random coincidence, scatter, or dead-time corrections were applied to PET/MRI datasets (all data were collected at counting rates low enough to avoid significant effects from dead time). Images were reconstructed with a 3-dimensional maximum a posteriori (MAP) algorithm (30 iterations, β = 1 × 10⁻⁵) (17). Detector sensitivity normalization was incorporated into the forward model in MAP reconstruction. The field of view (FOV) of reconstructed PET/MRI scanner images was 35.4 × 35.4 × 12.8 mm. Image matrix dimensions were 128 × 128 × 17, and voxel size was 0.28 × 0.28 × 0.75 mm. The average spatial resolution of the scanner (mean of values measured at off-axis distances of 0, 5, and 10 mm using filtered backprojection reconstructed images) was 1.5 mm (15).
Phantom Studies
We measured the linearity and uniformity of reconstructed image intensities from the PET/MRI scanner. A linearity phantom was constructed by evenly spacing four 1-mL syringes (Becton Dickinson; inner diameter, 4 mm) on the inner surface of a 50-mL Falcon tube (diameter, 30 mm [Becton Dickinson]; Supplemental Fig. 1 [supplemental materials are available online only at http://jnm.snmjournals.org]). Syringes were filled with 18F-FDG at concentrations of 2.5, 1.3, 0.63, and 0.31 MBq/mL, as measured by a well counter (CRC-15R; Capintec). The phantom was centered in the PET FOVand imaged simultaneously with PET/MRI 9 times over 2 h (PET: duration, 720 s; MRI: Fast Low Angle SHot gradient echo (FLASH) repetition time/echo time, 500/4 ms; FOV, 35.4 × 35.4 mm; slice thickness, 0.75 mm; matrix size; 128 × 128; 40 slices). The phantom was rotated 90° clockwise about the long axis of the system between each scan to test for activity-dependent differences in response among different regions of the reconstructed images. Response homogeneity within PET images was measured with a hot-rod phantom configured with the same geometry as the linearity phantom, except that all syringes contained 1.5 MBq of 18F-FDG per milliliter. The hot-rod phantom was imaged 10 times over 2 h (PET: 600 s) with a 90° clockwise rotation between consecutive scans. The first linearity phantom scan of the study session was used to derive regression coefficients with which other scans were calibrated; this method incorporated phantom-specific compensation for attenuation, scatter, and partial-volume effects. A detailed description of the calibration procedure is given in the supplemental data.
We also validated stability of the PET/MRI scanner over multiple imaging sessions. Linearity phantoms were prepared and imaged as described for 3 separate imaging sessions over 10 d. The coefficients of variation of calibration coefficients across sessions were calculated.
Animal Studies
Animal studies were approved by the Animal Care and Use Committee at Caltech. Ten days before imaging, TgCEA+C57BL/6 mice were implanted in the right flank with 8 × 10⁵ MC-38.CEA (CEA, carcinoembryonic antigen) colorectal adenocarcinoma cells (18).
18F-FDG
A tumor-bearing mouse was kept fasting for 4 h, injected intravenously with 37 MBq of 18F-FDG, and then warmed and sedated with a mixture of 1.5% isoflurane and air. The injected activity was sufficient to allow imaging of the same mouse by PET/MRI, small-animal PET, and QAR in the same study session. After 60 min, the mouse was euthanized and secured to a cardboard platform; mouse and platform were placed on a custom-designed plastic holder. The mouse was positioned with its long axis orthogonal to the transaxial imaging planes of the PET/MRI scanner and imaged unfrozen with simultaneous PET/MRI (PET: 600 s; MRI: Rapid Acquisition with Relaxation Enhancement (RARE) repetition time/echo time, 3,500/4.5 ms; matrix size, 128 × 128; resolution, 0.28 × 0.28 mm; slice thickness, 0.75 mm; 34 slices). After the initial PET/MRI scan, the mouse was frozen in a dry-ice and isopropyl alcohol bath, repositioned into the holder, and reimaged (PET: 1,200 s; MRI: RARE, same parameters as above). Using recorded prompts counting rate and previous work relating prompts rate to true coincidence counting rate for the PET/MRI scanner (15), we estimated the true-to-prompt coincidence event ratio for our scans to be approximately 50%–75%.
To facilitate shielded transport between the laboratories at which PET/MRI and small-animal PET/autoradiography experiments were done and cryosectioning for autoradiography, the frozen mouse was cut to obtain a 3.5-cm-long section axially centered on the tumor. A laser guide ensured that the cut face was orthogonal to the long axis of the mouse. The section was positioned in an imaging holder parallel to the holder’s axis to ensure that the cut face was orthogonal to the long axis of the microPET R4 scanner (Concorde Microsystems) (19). The mouse section was then serially imaged with small-animal PET and small-animal CT (Siemens InveonCT) (PET: 1,200 s, 350- to 650-keV energy window, 6-ns timing window, and corrections made for detector normalization, dead time, and random coincidence events, CT: 80 kVp, 500 μA, 200 ms/step, 361 steps covering 360°, 2 axial bed positions with a 20% overlap, voxels binned × 4). Measured true-to-prompt event ratios in all small-animal PET scans were greater than 99%. Small-animal CT images were reconstructed with the COBRA 3-dimensional reconstruction algorithm (Exxim) to produce datasets with isotropic voxels (210 μm per side). Before reconstruction, small-animal PET list-mode data were truncated to contain the same number of prompt coincidence events as in the PET/MRI frozen-state scan. This was done in order to make true count densities at least roughly comparable in the PET/MRI and small-animal PET scans. Images were then reconstructed using 3-dimensional ordered-subset expectation maximization MAP: 4 iterations, 12 subsets, followed by MAP: 30 iterations, β = 0.33, optimized for uniform resolution).
After small-animal PET, the mouse section was embedded in a 4% carboxymethylcellulose (Sigma-Aldrich) water mixture within a custom steel mold. The mold was placed in a dry-ice and isopropyl alcohol bath for 10 min and then into a −20°C freezer for 1 h before being mounted onto a cryomicrotome (Bright 5030/WD/MR; Hacker Instruments). Slices were removed until tumor tissue was apparent. After that, 50-μm-thick transaxial frozen sections, spaced 250 μm apart, were acquired for autoradiography until all tumor tissue had been sectioned, ensuring at least 3 autoradiography slices per PET/MR image slice. During sectioning, the block face was photographed (D70 camera [Nikon]; 90 mm 1:2:8 Macro φ55 lens [Tamra]). Sections were placed onto storage phosphor screens (Super Resolution Screen; PerkinElmer). A 14C standard strip (Amersham) was placed on each screen for calibration of screen sensitivity. Screens were exposed to collected sections for 3.5 d at −20°C and then read with a laser scanner (Packard Cyclone).
64Cu-Labeled Antibody
Distribution of a radiolabeled antibody against CEA, 64Cu-DOTA-NHS-M5A (9), was imaged in a tumor-bearing mouse. The antibody (5.6 MBq; specific activity, 0.37 MBq/μg) was injected intravenously, and in vivo simultaneous PET/MRI was performed at 4 and 20 h after injection. The animal was kept at 35°C–37°C with a warm air flow. At each time point, PET (3,600 s), anatomic MRI (RARE, same parameters as listed above), and diffusion MR images (repetition time/echo time, 3,000/25 ms; matrix size, 128 × 128; resolution, 0.28 × 0.28 mm; slice thickness, 0.75 mm; 10 slices, δ/Δ [where δ is the duration of the diffusion gradient pulses and Δ the time between the pulses], 7/14 ms; b-values [b-factor describes the diffusion weighting of the pulses], 0, 300, and 1,000 s/mm3; 1 direction) were acquired. The mouse was sacrificed 24 h after injection. Images were then acquired with the PET/MRI scanner, small-animal PET, and autoradiography and processed as per the 18F-FDG experiment.
Image Analysis
Image Coregistration
PET/MRI scanner images were aligned with MR images as previously described (20). Images from nonfrozen and frozen specimens were aligned using a rigid-body transformation obtained via landmarks along the anatomic contour. Small-animal PETand small-animal CT images were coregistered with a rigid-body transformation (Amira) using landmarks present on both images.
Autoradiography images acquired from different phosphor screens during the same study session were cross-calibrated using 14C standard strips. For animal studies, slices within each autoradiography and photography image z-stacks were first aligned across the stack using the Fiji StackReg function (http://pacific.mpi-cbg.de/wiki/index.php/Fiji). The 2 stacks were then coregistered using a rigid-body transformation derived from 12 landmarks per slice clearly seen on both stacks. Three adjacent slices falling within a given PET slice were averaged to match the slice thickness of the PET/MRI scanner.
Before cross-modal registration, PET/MRI and autoradiography/photography datasets were resliced to 1.2-mm thickness to match the slice thickness of reconstructed small-animal PET images. Finally, PET/MRI and small-animal PET and small-animal CT image stacks were aligned to the autoradiography/photography stack using a landmark-based rigid-body algorithm implemented in Matlab (The Math-Works), resulting in a coregistered combined dataset with voxel dimensions of 0.28 × 0.28 × 1.2 mm.
ROIs
For phantom images acquired in PET/MRI studies, cylindric volumes of interest (VOIs) were axially centered within images of rods (diameter, 40% of the rod; length, 8.3 mm).
Tumor and whole-animal VOIs were drawn on photographic stacks using MRIcro (http://www.MRIcro.com) and applied to PET and autoradiography images.
PET/Autoradiography Comparisons
Similarity metrics used to compare animal images are summarized in Supplemental Table 1. Image intensities within VOIs were scaled to fall between 0 and 1 for similarity analysis. We used scaled images because it was not feasible to perform autoradiography of a linear calibration phantom during day-long animal imaging experiments. Scaling was valid because phantom studies showed that the PET/MRI scanner, small-animal PET, and autoradiography responses were linear (Supplemental Figs. 2 and 3).
In Vivo PET/Diffusion MRI
Aligned and calibrated (using a linearity phantom as described in the supplemental data) PET/MRI scanner images were converted to units of percentage injected dose per gram. Apparent diffusion coefficient (ADC) tumor maps were generated from diffusion MRI data (6). Cooccurrence matrix analysis was used to compare ADC and PET images while taking into account the resolution differences between imaging modalities. The cooccurrence matrix C was calculated using the following equation:
ADCr and PETr are ADC and PET images whose voxel values have been binned to 1 of 15 evenly spaced values lying within the intervals i ∈ [0, 1.5 × 10⁻³ mm2/s] and j ∈ [0.25 d, 0.75 d] (d is the maximum percentage injected dose per gram value in the VOI), respectively. p, q, and r are voxel coordinates along x, y, and z directions of the n × m × l image volume (defined by the VOI). a, b, and c are the PET voxel dimensions (0.28 × 0.28 × 0.75 mm). The parameters |Δx|, |Δy| (≤1.5 mm), and |Δz| (≤2.1 mm) were equated to the image resolution (average full width at half maximum [FWHM]) of the PET/MRI scanner (15).
Statistical Analysis
Two-way ANOVA was used to compare image homogeneity and linearity of PET/MRI scanner phantom data. Differences between rod intensities measured from different quadrants of the image and individual rod intensities measured from separate images during the study session were tested. Differences were considered significant when P values were less than 0.05.
RESULTS
PET/MRI Scanner Response
Activity Concentration Recovery
Activity concentration recovery (ACR = measured value/true value, measured value obtained from images using calibration coefficients derived as described in supplemental data) from PET/MRI scanner phantom images are shown in Figure 1. Linearity phantom images had ACRs close to unity (0.97 ± 0.06) for all rods (diameter, 4 mm) across a 10-fold range of activity concentrations (Figs. 1A and 1B). No significant difference in activity concentration recovery among spatial locations (P = 0.3) or among different rod activity concentrations (P = 0.3) were observed. However, reproducibility of the scanner-derived ACR was inversely related to rod activity concentration (ACR SD, 23% for the lowest-activity-concentration rod, compared with 9% for the highest-activity-concentration rod). This is likely because of increased noise in reconstructed images at lower activity concentrations. Hot-rod phantom images also had ACRs (1.03 ± 0.03) close to unity for a range of activities (Figs. 1C and 1D). Again, no significant dependence of ACRs on spatial location (P = 0.5) or rod identity (P = 0.5) was seen.
FIGURE 1.

PET/MRI scanner accuracy and stability within imaging session. Measurements were made on syringe rod phantoms described in “Materials and Methods” section. (A) ACR for 18F-FDG linearity phantom images acquired over 2 h, with ROIs drawn over rods with varying activity concentrations. No significant dependence on spatial location (P = 0.3) or activity concentration (P = 0.3) was observed. (B) Rod ACRs, compared with actual rod activity concentrations. (C) ACRs of 18F-FDG hot-rod phantom images acquired over 2 h, compared with respect to spatial location and rod identity. No dependence on spatial location (P = 0.5) or rod identity (P = 0.5) was observed. (D) Rod ACRs, compared with actual rod activities at the time of imaging. All hot-rod syringes contained same activity concentration. Error bars denote SD. BR = bottom right of image FOV; BL = bottom left of image FOV; TL = top left of image FOV; TR = top right of image FOV.
Stability Across Imaging Sessions
Calibration curves and regression coefficients obtained with linearity phantoms from 3 separate imaging sessions over 10 d are shown in Supplemental Figure 3. The data show that the PET/MRI scanner has a temporally stable and linear response across a wide range of activity concentrations when system parameters are kept constant.
Comparison of Image Intensity Patterns Across Modalities
Qualitative Assessments
Figure 2A shows coregistered images of a mouse injected with 18F-FDG and imaged using PET/MRI, small-animal PET/CT, and autoradiography and photography. As expected, 18F-FDG uptake in the tumor was elevated, compared with surrounding tissues. The image intensity pattern was heterogeneous within the tumor and approximately congruent among all 3 imaging systems. Regions of high activity were present in lateral and medial lobes of the tumor, with a region of lower activity in between. The central region had somewhat higher relative intensity in autoradiography, compared with PET images.
FIGURE 2.

Multimodal imaging of radio-tracer uptake in tumors. Mice bearing MC38.CEA tumors were injected either with 18F-FDG (A) or anti-CEA 64Cu-DOTA-NHS-M5A antibody (B) and sacrificed after uptake period. Tumor regions were then imaged with the PET/MRI scanner, frozen, reimaged with PET/MRI, imaged in frozen state with small-animal PET and small-animal CT, cryosectioned, and imaged with autoradiography. Matched tumor slices show qualitatively similar uptake patterns. PET/MRI scanner images of 18F-FDG show hot spot (circle) not observed with other modalities. Comparison with MRI showed hot spot to be on animal’s surface, indicating that it was caused by urine residue, which was removed before subsequent imaging (scale bar = 10 mm).
Images acquired 24 h after injection of 64Cu-DOTA-NHS-M5A are shown in Figure 2B. Expected tumor localization of the antibody is observed, along with intratumoral heterogeneity. The multilobed intratumoral uptake pattern is similar across PET/MRI, small-animal PET, and autoradiography.
Quantitative Evaluation
Image similarity between different pairs of radioactivity image sets was quantified using several metrics. Comparisons of the PET/MRI and microPET R4 scanners with autoradiography are shown in Figures 3 and 4. Pixel-based correlation coefficients for all PET-to- autoradiography comparisons were moderate to high (>0.7) for both whole-mouse cross-sections and tumor ROIs (Figs. 3A and 3B). Not surprisingly, correlation increased when autoradiography was blurred to match resolution to the PET/MRI scanner and small-animal PET and dropped nearly to zero when the autoradiography dataset was scrambled. An alternative pixel-based metric, peak signal-to-noise ratio, gave similar results except that values were higher for whole-body than tumor ROIs and the drop in metric value was less pronounced for a randomly scrambled image (Figs. 3C and 3D).
FIGURE 3.

Pixel-based similarity across PET/MRI (frozen specimens), small-animal PET, and autoradiography images. 18F-FDG and 64Cu-antibody coregistered datasets were compared at whole-body and tumor ROI levels using correlation coefficients (A and B) and peak signal-to-noise ratio (C and D). Similarity between each PET dataset and autoradiography (with and without gaussian filter applied to autoradiography) was calculated and plotted against each other. Control comparison between PET datasets and scrambled autoradiography volume showed large decreases for correlation coefficient but not peak signal-to-noise ratio. Pearson correlation coefficients comparing PET/MRI vs. autoradiography and small-animal PET vs. autoradiography metrics are shown. Similarity metrics are described in Supplemental Table 1.
FIGURE 4.

Structure-based similarity among PET/MRI (frozen specimen), small-animal PET, and autoradiography images. 18F-FDG and 64Cu-antibody coregistered datasets were at whole-body and tumor ROI levels using SSIM (A and B) and CWSSIM (C and D). Pearson correlation coefficients comparing PET/MRI vs. autoradiography and small-animal PET vs. autoradiography metrics are shown.
Images were also analyzed with structure-based metrics (Fig. 4). Mean structural similarity index (SSIM) and Complex Wavelet Structural Similarity Index (CWSSIM) analyses showed no clear difference between PET/MRI and microPET R4 scanners. With both measures, comparison of PET images for tumor ROIs generally showed higher in-termodal similarity than did whole-body ROIs. When the autoradiography dataset was scrambled, structure-based comparisons decreased to nearly zero, confirming that the metrics do reflect image similarity. Similarity metrics obtained by comparing PET/MRI and small-animal PET images with autoradiography were highly correlated (r ≥ 0.9).
Small differences shown by the metrics can be related to images. For example, comparison of 18F-FDG data slightly favored the PET/MRI scanner over the small-animal PET scanner. A possible explanation for this can be seen in Figure 2A, where PET/MRI of the frozen specimen and QAR images show a more pronounced low-activity region between the 2 main high-activity lobes and relatively flat dorsal tumor contours, compared with the small-animal PET image. Differences among modalities are less pronounced in the antibody images; this is seen in Figures 3B, 3D, 4B, and 4D, where on average data points lie closer to the identity line than for 18F-FDG images. CWSSIM, a metric less sensitive to geometric distortions than other metrics (21), attenuates these differences but also indicates improved structural agreement between small-animal PET and blurred autoradiography images of 64Cu in tumor, compared with PET/MRI.
Simultaneous In Vivo PET/MRI
Tumor uptake of 64Cu-DOTA-NHS-M5A at 4 and 20 h after injection is compared with simultaneously acquired MRI ADC images in Figure 5. At 4 h after injection, much of the antibody was still in the blood, as shown by the high signal in the inferior vena cava (Fig. 5A) and low uptake within the ventral portion of the tumor. At 20 h, the antibody signal was spread throughout the tumor parenchyma (Fig. 5B). Cooccurrence matrix analyses of the uptake pattern reflect these observations (Fig. 6). At 4 h, regions of relatively high antibody concentration within the tumor tended to be in regions with high ADC values, suggesting that the antibodies were in the tumor’s intravascular or interstitial spaces (Fig. 6A). By 20 h, this high uptake and high ADC cooccurrence disappeared, suggesting uniform antibody distribution within the tumor (Fig. 6B).
FIGURE 5.

In vivo simultaneous diffusion-MRI/radiolabeled antibody PET reveals phases of antibody uptake. PET/MRI of mouse was obtained at 4 (A) and 20 (B) h after injection. Slices from 2 time points were matched as closely as possible. Both PET and diffusion MRI show intratumoral heterogeneity of uptake and ADC values, respectively. General accumulation of antibody was observed between 4 and 20 h. Focal distribution of antibody was observed in more dorsal portion of tumor at 4 h after injection; by 20 h, distribution encompassed most of tumor mass. Spatial patterning of ADC (shown only for tumor) was similar at both time points. PET images were calibrated using linearity phantom as described in supplemental data. Arrow points to inferior vena cava (scale bar = 10 mm).
FIGURE 6.
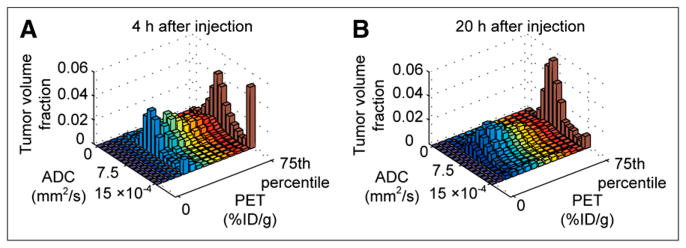
Cooccurrence matrix analysis of functional PET and MRI data offers insight into tumor antibody uptake. (A) Cooccurrence matrix comparing antibody uptake and ADC values at 4 h after injection. Uptake comparison window was adjusted to account for lower spatial resolution of PET (1.5 mm in FWHM), compared with MRI. At 4 h, large fraction of antibody signal colocalized with regions of high ADC (≥0.0015 mm2/s), suggesting much of the antibody was in vascular or interstitial spaces. (B) By 20 h, that component had disappeared; antibody was spread more evenly across tumor mass. This was not apparent with pixel-by-pixel matching (Supplemental Fig. 4).
DISCUSSION
The feasibility of in vivo PET/MRI has been well demonstrated (4). However, it remains to be shown that PET images from such a scanner accurately depict activity distribution within the imaged tissue. Here, we demonstrated the ability of a MRI-compatible PET scanner (16) to produce quantifiable intratumoral images that are stable, linear, and concordant with images from a commercial small-animal PET scanner and autoradiography.
PET systems require a uniform and linear image intensity response. PET/MRI scanner–derived images of linearity and hot-rod phantoms showed the system to be stable and linear during a single imaging session and across multiple sessions. The linearity phantom allowed us to demonstrate the stability of the PET/MRI system for measuring multiple activity concentrations in the same image across multiple time-points within an imaging session. These characteristics are crucial for successful dynamic simultaneous PET/MRI studies. Activity concentration recovery in this study compares well with previous reports for small-animal PET (22,23).
To quantitatively interpret and compare PET and QAR images, image intensities for both modalities need to be linearly related to object activity concentration. To demonstrate that PET and QAR imaging systems used in this study are linear and to confirm that our intended strategy for animal studies is valid, we developed a gelatin phantom that could be visualized by optical imaging, MRI, CT, PET, and QAR and assayed for radioactivity concentration by γ-counting (Supplemental Fig. 1). Supplemental Figure 2 shows that image intensities derived from phantoms were linearly related to sample activity concentration for all 3 imaging systems, enabling us to compare images from different systems with confidence.
The ability to return images with intensity patterns reflecting actual in vivo activity distributions was compared among PET/MRI, small-animal PET, and QAR. Intratumoral activity distributions for a metabolic marker (18F-FDG) and a targeted antibody were in good overall spatial concordance among modalities. However, detailed examination of the images revealed some differences. Resolution differences between autoradiography and PET can be seen by the presence of finer structures in autoradiographs than in their PET counterparts. For example, the antibody distribution in Figure 2B showed a small rim of relatively high activity in the ventral portion of the tumor autoradiographs not visible with PET. Christian et al. reported similar observations, attributing them to differences in resolution between PET and autoradiography (24). Lack of attenuation and scatter correction in PET/MRI scanner images may also contribute to disparities. Attenuation of 511-keV photons can be as high as 15% with small-animal–sized objects (25). However, because tumors imaged in our experiments were superficial, we expect attenuation-related differences between PET and autoradiography to be minimal. Regardless of the limitations of the imaging techniques used in this study, the intratumoral patterns are qualitatively similar among PET/MRI, small-animal PET, and QAR for both 18F-FDG and the 64Cu-antibody. Furthermore, similarity metrics showed good overall correlation between both PET systems and QAR. Image differences between the 2 PET systems may be due to resolution differences between the systems and, in case of the 18F-FDG study, high counting rates during the PET/MRI scan compared with the small-animal PET.
The necessity and utility of detailed quantitative analyses are illustrated in Figure 5. Having demonstrated good spatial fidelity of PET/MRI scanner images, we hypothesized that biologic inferences can be made by comparing simultaneously acquired PET and MR images. Fidelity of the PET images allowed us to conclude that there was a time-dependent heterogeneous tumor accumulation of antibody during a preliminary study (Figs. 4 and 5).
Previously, 2 methods have been used to compare multimodal intratumoral datasets. Cho et al. performed a pixel-wise comparison of PET and dynamic contrast-enhanced MRI maps (7), whereas Metz et al. used arbitrary thresholds to segment tumor subregions for comparison (11). The former approach neglects differences in resolution between the imaging modalities, whereas the latter requires multiple PET datasets and is observer-dependent. We accounted for differences in resolution between PET and MRI by analyzing image sets with a cooccurrence matrix bin offset equal to the mean FWHM of the scanner. This analysis demonstrated spreading of antibody from a highly intravascular and extracellular region throughout the tumor. There is recent interest in modeling tumor growth kinetics using multimodal imaging datasets on a pixel-by-pixel basis (26). The cooccurrence matrix method can be incorporated into these analyses to account for resolution differences between the different modalities. Further improvements can be made to this method. For instance, one can vary the FWHM window to account for varying spatial resolution within the PET FOV.
To date, few studies have been published that evaluate PET image fidelity to actual in vivo activity distributions. Christian et al. developed a Styrofoam (The Dow Chemical Co.) holder surrounding a mouse to allow coregistered PET and autoradiography (27). Cho et al. developed a foam mold and plastic holder for rat imaging (7). The current PET/MRI scanner is not large enough to accommodate these solutions. Instead, landmarks visible on all anatomic images (MRI, CT, photography) along with laser-guided positioning of the mice allowed effective coregistration between PET and QAR.
It is remarkable that, despite limitations inherent in a first-generation prototype (e.g., low sensitivity and lack of random coincidence or dead-time corrections), the current PET/MRI scanner, operated simultaneously with MRI, provided PET images with spatial patterns essentially equivalent to those of the well-established microPET R4 scanner. This demonstrates the ability of the MRI-compatible PET scanner to deliver useful in vivo information acquired simultaneously with MRI. Next-generation systems (28) will likely improve on the quantitative ability and image quality of the current system. Methods developed here can be used as a benchmark to assess the image quality of future systems. Further, availability of good-fidelity, coregistered PET/MRI datasets and their QAR/photography counterparts offers the opportunity to explore the biologic implications of complementary imaging information and provide a test bed to develop and evaluate in vivo–relevant PET partial-volume, motion-correction, and attenuation-correction algorithms.
CONCLUSION
We evaluated the ability of an MRI-compatible PET scanner to generate spatially and quantitatively accurate images. Images acquired from tumor-bearing mice using different radioisotopes showed good correspondence among PET/MRI, microPET R4 imaging, and autoradiography. A cooccurrence matrix method enabling effective comparison of complementary PET and MR images was presented. This work provides a basis for pursuing biologically relevant simultaneous PET/MRI studies. Progress in hybrid PET/MRI technology will provide improvements in image quality. Methods from this study can be applied to evaluate such improvements.
Supplementary Material
Acknowledgments
We thank Dr. Kofi Poku for preparing the 64Cu-DOTA-NHS-M5A antibody and Dr. Andrey Demyanenko, Desiree Crow, Alex Poznak, Sonia Collazo, and Bita Alaghebandan for their technical assistance. Drs. Yibao Wu and Scott Fraser gave helpful advice. The project was funded by NIBIB R01 EB000993, NCRR S10 RR015703, S10 RR019253, the Beckman Institute, USC Molecular Imaging Center, and the Caltech/City of Hope Biomedical Initiative.
References
- 1.Hanahan D, Weinberg Robert A. Hallmarks of cancer: the next generation. Cell. 2011;144:646–674. doi: 10.1016/j.cell.2011.02.013. [DOI] [PubMed] [Google Scholar]
- 2.Weissleder R, Pittet MJ. Imaging in the era of molecular oncology. Nature. 2008;452:580–589. doi: 10.1038/nature06917. [DOI] [PMC free article] [PubMed] [Google Scholar]
- 3.Cherry SR. Multimodality imaging: beyond PET/CT and SPECT/CT. Semin Nucl Med. 2009;39:348–353. doi: 10.1053/j.semnuclmed.2009.03.001. [DOI] [PMC free article] [PubMed] [Google Scholar]
- 4.Sauter AW, Wehrl HF, Kolb A, Judenhofer MS, Pichler BJ. Combined PET/MRI: one step further in multimodality imaging. Trends Mol Med. 2010;16:508–515. doi: 10.1016/j.molmed.2010.08.003. [DOI] [PubMed] [Google Scholar]
- 5.Choyke PL, Dwyer AJ, Knopp MV. Functional tumor imaging with dynamic contrast-enhanced magnetic resonance imaging. J Magn Reson Imaging. 2003;17:509–520. doi: 10.1002/jmri.10304. [DOI] [PubMed] [Google Scholar]
- 6.Galbán CJ, Bhojani MS, Lee KC, et al. Evaluation of treatment-associated inflammatory response on diffusion-weighted magnetic resonance imaging and 2-[18F]-fluoro-2-deoxy-d-glucose-positron emission tomography imaging biomarkers. Clin Cancer Res. 2010;16:1542–1552. doi: 10.1158/1078-0432.CCR-08-1812. [DOI] [PMC free article] [PubMed] [Google Scholar]
- 7.Cho H, Ackerstaff E, Carlin S, et al. Noninvasive multimodality imaging of the tumor microenvironment: registered dynamic magnetic resonance imaging and positron emission tomography studies of a preclinical tumor model of tumor hypoxia. Neoplasia. 2009;11:247–259. doi: 10.1593/neo.81360. [DOI] [PMC free article] [PubMed] [Google Scholar]
- 8.Bading JR, Shields AF. Imaging of cell proliferation: status and prospects. J Nucl Med. 2008;49:64S–80S. doi: 10.2967/jnumed.107.046391. [DOI] [PubMed] [Google Scholar]
- 9.Li L, Bading JR, Yazaki PJ, et al. A versatile bifunctional chelate for radio-labeling humanized anti-CEA antibody with In-111 and Cu-64 at either thiol or amino groups: PET imaging of CEA-positive tumors with whole antibodies. Bioconjug Chem. 2008;19:89–96. doi: 10.1021/bc700161p. [DOI] [PMC free article] [PubMed] [Google Scholar]
- 10.Yang Y, Tai YC, Siegel S, et al. Optimization and performance evaluation of the microPET II scanner for in vivo small-animal imaging. Phys Med Biol. 2004;49:2527–2545. doi: 10.1088/0031-9155/49/12/005. [DOI] [PubMed] [Google Scholar]
- 11.Metz S, Ganter C, Lorenzen S, et al. Phenotyping of tumor biology in patients by multimodality multiparametric imaging: relationship of microcirculation, αvβ3 expression, and glucose metabolism. J Nucl Med. 2010;51:1691–1698. doi: 10.2967/jnumed.110.077719. [DOI] [PubMed] [Google Scholar]
- 12.National Electrical Manufacturers Association (NEMA) NEMA Standards Publication NU4-2008. Rosslyn, VA: National Electrical Manufacturers Association; 2008. Performance Measurements of Small-animal Positron Emission Tomographs. [Google Scholar]
- 13.Coe RA. Quantitative whole-body autoradiography. Regul Toxicol Pharmacol. 2000;31:S1–S3. doi: 10.1006/rtph.2000.1379. [DOI] [PubMed] [Google Scholar]
- 14.Catana C, Wu Y, Judenhofer MS, Qi J, Pichler BJ, Cherry SR. Simultaneous acquisition of multislice PET and MR images: initial results with a MR-compatible PET scanner. J Nucl Med. 2006;47:1968–1976. [PubMed] [Google Scholar]
- 15.Wu Y, Catana C, Farrell R, et al. PET performance evaluation of an MR-compatible PET insert. IEEE Trans Nucl Sci. 2009;56:574–580. doi: 10.1109/TNS.2009.2015448. [DOI] [PMC free article] [PubMed] [Google Scholar]
- 16.Catana C, Procissi D, Wu Y, et al. Simultaneous in vivo positron emission tomography and magnetic resonance imaging. Proc Natl Acad Sci USA. 2008;105:3705–3710. doi: 10.1073/pnas.0711622105. [DOI] [PMC free article] [PubMed] [Google Scholar]
- 17.Qi J, Leahy RM. Resolution and noise properties of MAP reconstruction for fully 3-D PET. IEEE Trans Med Imaging. 2000;19:493–506. doi: 10.1109/42.870259. [DOI] [PubMed] [Google Scholar]
- 18.Clarke P, Mann J, Simpson JF, Rickard-Dickson K, Primus FJ. Mice transgenic for human carcinoembryonic antigen as a model for immunotherapy. Cancer Res. 1998;58:1469–1477. [PubMed] [Google Scholar]
- 19.Knoess C, Siegel S, Smith A, et al. Performance evaluation of the microPET R4 PET scanner for rodents. Eur J Nucl Med Mol Imaging. 2003;30:737–747. doi: 10.1007/s00259-002-1052-6. [DOI] [PubMed] [Google Scholar]
- 20.Ng TSC, Procissi D, Wu Y, Jacobs RE. A robust coregistration method for in vivo studies using a first generation simultaneous PET/MR scanner. Med Phys. 2010;37:1995–2003. doi: 10.1118/1.3369447. [DOI] [PMC free article] [PubMed] [Google Scholar]
- 21.Sampat MP, Zhou W, Gupta S, Bovik AC, Markey MK. Complex wavelet structural similarity: a new image similarity index. IEEE Trans Image Process. 2009;18:2385–2401. doi: 10.1109/TIP.2009.2025923. [DOI] [PubMed] [Google Scholar]
- 22.Laforest R, Longford D, Siegel S, Newport DF, Yap J. Performance evaluation of the microPET Focus-F120. IEEE Trans Nucl Sci. 2007;54:42–49. [Google Scholar]
- 23.Disselhorst JA, Brom M, Laverman P, et al. Image-quality assessment for several positron emitters using the NEMA NU 4-2008 standards in the Siemens Inveon small-animal PET scanner. J Nucl Med. 2010;51:610–617. doi: 10.2967/jnumed.109.068858. [DOI] [PubMed] [Google Scholar]
- 24.Christian N, Lee JA, Bol A, De Bast M, Jordan B, Grégoire V. The limitation of PET imaging for biological adaptive-IMRT assessed in animal models. Radiother Oncol. 2009;91:101–106. doi: 10.1016/j.radonc.2008.11.014. [DOI] [PubMed] [Google Scholar]
- 25.Chow PL, Rannou FR, Chatziioannou AF. Attenuation correction for small animal PET tomographs. Phys Med Biol. 2005;50:1837–1850. doi: 10.1088/0031-9155/50/8/014. [DOI] [PMC free article] [PubMed] [Google Scholar]
- 26.Atuegwu NC, Gore JC, Yankeelov TE. The integration of quantitative multimodality imaging data into mathematical models of tumors. Phys Med Biol. 2010;55:2429–2449. doi: 10.1088/0031-9155/55/9/001. [DOI] [PMC free article] [PubMed] [Google Scholar]
- 27.Christian N, Lee JA, Bol A, De Bast M, Gallez B, Grégoire V. Immobilization device for in vivo and in vitro multimodality image registration of rodent tumors. Radiother Oncol. 2008;87:147–151. doi: 10.1016/j.radonc.2008.02.016. [DOI] [PubMed] [Google Scholar]
- 28.Wu Y, Yang Y, Bec J, Cherry SR. A DOI-capable MR-compatible PET insert for simultaneous PET/MRI imaging [abstract] Mol Imaging Biol. 2010;12:S603. [Google Scholar]
Associated Data
This section collects any data citations, data availability statements, or supplementary materials included in this article.