

Abstract
The aspartic protease pepsin is less specific than other endoproteinases. Because aspartic proteases like pepsin are active at low pH, they are utilized in hydrogen deuterium exchange mass spectrometry (HDX MS) experiments for digestion under hydrogen exchange quench conditions. We investigated the reproducibility, both qualitatively and quantitatively, of online and offline pepsin digestion to understand the compliment of reproducible pepsin fragments that can be expected during a typical pepsin digestion. The collection of reproducible peptides was identified from >30 replicate digestions of the same protein and it was found that the number of reproducible peptides produced during pepsin digestion becomes constant above 5-6 replicate digestions. We also investigated a new aspartic protease from the stomach of the rice field eel (Monopterus albus Zuiew) and compared digestion efficiency and specificity to porcine pepsin and aspergillopepsin. Unique cleavage specificity was found for rice field eel pepsin at arginine, asparagine, and glycine. Different peptides produced by the various proteases can enhance protein sequence coverage and improve the spatial resolution of HDX MS data.
Keywords: Mass spectrometry, aspergillopepsin, factor XIII, hydrogen exchange, rice field eel, Monopterus albus Zuiew, online digestion
Introduction
Enzymatic proteolysis can be an important step prior to liquid chromatography mass spectrometry (LC-MS) studies, including for protein identification, posttranslational modification characterization, and protein structural analysis [1]. Digestion with trypsin (EC 3.4.21.4) is frequently used because trypsin is highly specific and the average size of tryptic peptides is generally within the mass range which mass spectrometers can accurately measure. In addition to trypsin, several other endoproteinases are widely used, including chymotrypsin (EC 3.4.21.1), elastase (EC 3.4.21.36), Lys-C (EC 3.4.21.50), Glu-C (Staph aureus V8, EC 3.4.21.19), Asp-N (EC 3.4.24.33), and Arg-C (Clostripain, EC 3.4.22.8). Different other proteases may be used to modulate the peptides that are produced and/or improve sequence coverage and overlapping peptides[2]. In recent years, the aspartic acid protease pepsin (EC 3.4.23.1), has been used with more frequency in proteomics and protein structure analyses (e.g. see [3]).
Pepsin is commonly found in the stomach of many organisms where it is active in very acid conditions (pH<3.0); pepsin becomes irreversibly inactivated above pH 5-6 [4-7]. Due to its high activity at low pH, pepsin is frequently used in hydrogen deuterium exchange mass spectrometry (HDX MS) experiments where digestion must be performed at pH ~2.5 [8-11] in order to retain as much deuterium as possible during analysis. After deuterium is incorporated into a protein at neutral/physiological pH, the exchange reaction is quenched and the protein digested into fragments by pepsin [12-14] for eventual detection and mass measurement with a mass spectrometer[11, 15]. Online pepsin digestion, in which pepsin is immobilized onto particles and packed into a column, was introduced some years ago [16, 17] and makes the HDX workflow more robust and automatable. It is often found that online digestion can be performed at a temperature higher than quench conditions (e.g., 15-20 °C rather than 0 °C) without increased back-exchange as the sample is exposed to the immobilized enzyme for a relatively short period of time.
The specificity of pepsin is much less than that of trypsin and other proteases (Lys-C, Glu-C, Asp-N, etc). From early experiments, pepsin is known to prefer to cleave after bulky hydrophobic amino acid residues [18, 19]. Pepsin specificity has been studied by statistical analyses using model peptides [20] and by tabulating peptides observed in MS experiments [e.g., Refs. [21-23]]. In general, pepsin prefers to cleave after phenylalanine and leucine whereas it rarely cleaves after histidine and lysine unless they are adjacent to leucine, phenylalanine, and a few others [21-23]. The rest of the amino acid residues exhibit very different cleavage probability, influenced mainly by the amino acids at positions P1 (by standard convention, defined as the residue N-terminal to the cleaved peptide bond) and P1’(the residue C-terminal to the cleaved peptide bond). In addition to amino acids in the P1 and P1’ positions, other residues that approach the active site (such as P4) can play a role in specificity [20]. Factors such as the pH of digestion, amount of exposure time, concentration of pepsin relative to the protein being digested, and importantly the molten globule conformation of proteins in acidic conditions all play a role in what peptides are produced. It is therefore necessary to maintain strict digestion conditions to perform reproducible pepsin digestions.
The first question we wished to address in the current work was: how reproducible are pepsin digestions? If replicated digestions of the same protein were performed, under strictly controlled conditions that were as identical as possible, would the same compliment of peptides be produced? As pepsin digestion produces many different kinds of peptides, many of which are short in length and overlapping with other peptides, it can be challenging to characterize and identify all the peptides produced, especially when digesting large proteins or protein complexes. Generating many overlapping, short peptides can improve the sequence coverage as well as the spatial resolution in HDX MS [24-26] but the identification of the peptides must be correct and reliable or all the HDX data are meaningless. Knowledge of the reproducibility of pepsin proteolysis and the cleavage variability is therefore valuable. To this end, we qualitatively and quantitatively evaluated pepsin proteolysis reproducibility using various subject proteins to learn not only what is produced, but how conditions might be optimized to obtain reproducible peptic peptides.
We addressed a related question in the second part of the work presented here: how reproducible is proteolysis when other acid proteases are used at low pH? It is already known that different acid proteases produce different peptides. In particular, in recent years various other enzymes have been explored for HDX MS experiments, and digestion at low pH. These other enzymes include: aspergillopepsin (protease type XIII, EC 3.4.23.18) [24, 27, 28], rhizopuspepsin (protease type XVIII, EC 3.4.23.6) [24, 28, 29], and plasmepsin (EC 3.4.23.39) [30]. Aspartic proteases from fish have also been investigated, including the Antarctic rock cod [21], North Pacific bluefin tuna [31], shark [32], and freshwater mandarin fish [33]. In the present study, we characterized the peptides produced by aspartic proteases from the rice field eel (Monopterus albus Zuiew) [34] and compared the resulting peptides to those from digestions with pepsin and aspergillopepsin. We discuss the results in light of the first part of the paper concerned with reproducibility and robustness of aspartic protease digestion.
Material and Methods
Materials
Pepsin (porcine gastric mucosa, part #Q64411), aspergillopepsin (Aspergillus Saitoi, protease, part #P2143), phosphorylase b (rabbit muscle, part #P6635), and cytochrome c (equine heart, part #C7752) were purchased from Sigma (St. Louis, MO, USA). Interferon alpha-2b standard was purchased from the European Directorate for the Quality of Medicines (Strasbourg, France). Sequencing grade trypsin (part #V5111) was from Promega (Madison, WI, USA). Ammonium bicarbonate was from Mallinckrodt (Phillipsburg, NJ, USA) and potassium phosphate, formic acid, and all other common lab chemicals were purchased from Sigma.
Rice Eel Pepsinogen Purification
All the procedures were conducted at 0-4 °C as described[34]. Rice field eel stomach (50g) was cut into small pieces and homogenized with 6-fold excess of 50 mM phosphate buffer (pH 7.0) containing 5 mM phenylmethanesulfonyl fluoride (PMSF) and 1 mM E-64 using a homogenizer (Kinematica, PT-2100, Luzern, Switzerland). The homogenate was centrifuged at 18,000g for 90 min and the resulting supernatant was fractionated with ammonium sulfate, from 20 to 60% saturation. After centrifugation, the precipitate was subsequently dissolved in a small amount of 25 mM phosphate buffer (pH 7.0) and dialyzed against the same buffer extensively. The dialysate was then subjected to DEAE-Sephacel column (2.5 × 15 cm), which was previously equilibrated with the dialysis buffer. Proteins in the flow-through fractions were collected by washing the column with starting buffer until the absorbance at 280 nm was below0.05. Binding proteins were eluted with a linear gradient of NaCl from 0 to 0.5 M in a total volume of 600 mL at a flow rate of 1 mL/min. Three peaks of rice field eel pepsinogens (isomers, PG-1, PG-2 and PG-3) were detected after DEAE-Sephacel column separation. These peaks were concentrated respectively by ultrafiltration using a membrane of YM-10 (Millipore, MA, USA). Concentrated samples were individually loaded on Sephacryl S-200 HR (1.5 × 98 cm) gel-filtration column, which was equilibrated with 25 mM phosphate buffer (pH 7.0) containing 0.15 M NaCl and eluted at a flow rate of 0.6 mL/min. All the three PGs were eluted as a single peak and gave a single band on SDS-PAGE. Finally, approximately 100 mg of isomers (PG-1 and PG-2) were obtained and studied for digestion specificity. Each PG was dissolved in 200 μL of 100 mM potassium phosphate (pH 2.54) and the concentration of PG was determined to be 1.25 mg/mL by Commassie blue method.
Digestion methods
For reproducibility experiments, phosphorylase b, cytochrome c, and interferon alpha-2b were prepared in 10 mM potassium phosphate (pH 7.00) and used as stock solutions inoffline and online digestions. For offline pepsin digestion, a stock solution of protein and an enzyme were mixed in a 1:1 (w/w) ratio and digested in solution at pH 2.5 for 60 seconds at room temperature. The digest was immediately injected into a nanoACQUITY UPLC™with HDX technology [35] from Waters (Milford, MA, USA) for chromatographic separation. Online pepsin digestion was performed using a POROS pepsin column (2.1×30 mm) from Life Technologies/Applied Biosystems (Carlsbad, CA, USA) at room temperature (note from above that digestion at low temperatures is not required for most online HDX experiments) in the same LC system. Just prior to digestion, the protein stock solution was adjusted to low pH. Two different digestion solutions were used: for phosphorylase b, the stock phosphorylase b protein solution was mixed with 100 mM potassium phosphate, pH 2.66 in a in 1:1 (v/v) ratio; for cytochrome c and interferon alpha-2b digestions, the protein stock solution was mixed with 100 mM potassium phosphate, containing 1.5 M Guanidine-HCl and 500 mM TCEP, pH 2.66 in 1:1 (v/v) ratio. After adjustment to low pH, each sample was immediately injected for online digestion. Each protein solution passed through the pepsin column at 100 μL/minin 0.2% formic acid, pH 2.50 (the pepsin column was re-equilibrated with the same buffer). The peptic peptides were trapped and desalted online using an ACQUITY UPLC® BEH C18 1.7 μm VanGuard™ Pre-Column (Waters) at 25 °C. The flow was diverted by switching valves, and trapped peptides were eluted into an ACQUITY UPLC BEH C18 1.7μm, 1 mm × 100 mm column (Waters) held at 25 °C. Peptides were separated with a 6 min linear acetonitrile gradient (7-40%) containing0.1% formic acid at 40 μL/min. 1.5 M Guanidine-HCl in 0.1% formic acid was injected to wash the pepsin column and a blank was run between digestion samples to confirm that there was no carryover from either the trapping or the separation steps.
For offline tryptic digestion, standard proteins were mixed with trypsin at a ratio of 50:1 (w/w) and incubated for 4 hours at room temperature.The digest was acidified with 0.1% formic acid at the end of incubation. A POROS trypsin column (2.1×30 mm) was purchased from Life Technologies for online tryptic digestion. Standard proteins werepassed through the columnat 10 μL/min for 30 min in 20 mM ammonium bicarbonate pH 7.9 at room temperature. Both prepared digests were trapped and separated in same manner as pepsin digestions.
The porcine pepsin, aspergillopepsin, and rice field eel pepsins (PG-1 and PG-2) were prepared in 100 mM potassium phosphate (pH 2.54) for offline digestion. The same instrumental setup as described above was used to identify the resulting peptides, except that the chromatographic gradient was 8-42% B in 15 minutes.
Mass spectrometry
The eluent from LC separations was directed into a SYNAPT® MS mass spectrometer (Waters) XEVO G2 Q-TOF mass spectrometer (Waters), which was equipped with electrospray ionization and lock-mass correction using Glu-Fibrinogen peptide. Mass spectra were acquired in MSE mode[36] over the m/z range of 50-2000. The peptides were identified using ProteinLynx Global Server software (Waters) [36]. The identified peptides from replicate digestions (up to N=31) were filtered with a number of parameters to increase the accuracy of identification, particularly for the peptides that were produced by a non-specific proteolysis. Ions that appeared to be adducts, neutral losses, and in-source fragments were removed from consideration. A consistent narrow window of retention time (< 0.5% RSD) in chromatographic separation, and the mass accuracy of precursor (< 6 ppm) and product ions (<16 ppm) in resolution mode were considered. These parameters are important in order to select reproducible peptides and determine their specificity and variability among reproducible species. Each identified peptide must contain at least four product ions, each matched with an accurate mass. A ratio of the number of product ions per amino acid residue was calculated for various length peptides and the average ratio was set below 0.3 to eliminate peptides identified with a smaller number of product ions (see Supplemental Figure S5). For example, for a peptide that consists of 12 amino acid residues, there must be four or more product ions found in order for the identification and selection to be valid. This calculation adds confidence in identification regardless of the peptide length. Finally, the sequence coverage map was plotted using MSTools[37].
RESULTS AND DISCUSSION
How many digestions?
Identifying peptic peptides in one digestion by pepsin can be an easy task; however, determining how reproducible these peptides are in many replicates may not be so easy. Empirically, some peptides are always observed and others are not. We wished to understand what complement of peptides could be found in every digestion, how many times digestion must be performed to cover the entire sequence with reproducible peptic peptides, and then how pepsin digestion is compared with aspergillopepsin and rice field eel pepsin. The strategy was to digest the same protein many times with the same conditions and use fairly stringent MS identification parameters to ensure that detected ions were actually peptic fragments which could be reliably identified/sequenced by MS/MS (see Materials and Methods). Note that in this experimental system, there was no precursor ion selection (data-dependent acquisition) and MSE was used for all fragmentation. As a result, fragmentation was highly reproducible as was the accurate identification of peptic peptides, thereby allowing us to estimate the level of reproducibility and specificity of pepsin digestion. As described below, we utilized online pepsin digestion for the bulk of the reproducibility experiments, and then compared online digestion to offline digestion with both pepsin and trypsin.
Pepsin proteolysis generally produces a very complex mixture of peptides, compared to the other enzymes that cleave more specifically. When pepsin proteolysis is repeated with the same digestion conditions in large replicates, some peptides are always generated whereas some peptides are not found in every digestion. For example, a peptide, YYDRIPEL (residues 730-737) of phosphorylase b produced by online pepsin digestion was identified 31 times in 31 digestions, whereas another peptide, DRIPELRQ (residues 732-739), was only identified three times out of 31 digestions. From the digestion conditions we used for HDX MS, 230-240 peptic peptides of phosphorylase b (~ 97k Da) were accurately identified per digestion. When the digestion was repeated 10 and 31 times, the total number of identified peptides (the sum of all peptides found in all 10 or all 31 digestions) increased to 2010 and 6256 peptides, respectively. However, within the large pool of peptides, not all peptides were “reproducible”. Reproducible peptides are defined here as ones that were found greater than or equal to N/2 times in N digestions. For instance, a peptide identified at least 5 times in 10 digestions, was considered to be a reproducible peptide because the probability of again finding the exact peptide in another digestion was high.
After 10 replicate digestions of phosphorylase b with pepsin, 164 peptic peptides were found at least five times (N/2). These 164 peptides covered 82% of the phosphorylase b sequence (see Supplemental Figure S1). Comparing the coverage map for N=10 digestions to the coverage map constructed for N=5 digestions shows that both maps were quite similar with same reproducible peptides (Supplemental Figure S1). Plotting the number of digestions versus peptides observed (Figure 1) as the number of digestions was expanded to N= 5, 10, 20, and 31, it was found that the number of reproducible peptides was also similar, between 164 and 178 peptides, as shown in Figure 1A. One interesting conclusion from this data is that one does not need to repeat digestion many times in order to determine what the reproducible species are. From the plot in Figure 1A, only 5 to 10 digestions were required to find the reproducible peptides of phosphorylase b.
Figure 1.

Pepsin digestion reproducibility. (A) The number of reproducible peptides identified inreplicate pepsin digestions (N). A reproducible peptide was defined as one that appeared in N/2 digestions. From the plot, a consistent number of reproducible peptides (approximately 170 peptides of phosphorylase b) were produced above approximately 5 replicate digestions. (B) Comparison of the reproducible versus non-reproducible peptides in replicate pepsin digestions(N). An increasing number of non-reproducible peptides (triangle) were observed as the number of digestions increased. Among the non-reproducible peptides, greater than 50% of them were only identified once out of N times of digestions (diamond).
On the other hand, the peptides that were not reproducible (found less than N/2 in N digestions) were found to be more in number, as illustrated in Figure 1B. There were from 213 to 616 different kinds of non-reproducible peptic peptides at N=5 versus N=31, respectively. The degree of non-reproducibility seemed to significantly increase as the number of digestions was increased, meaning that more and more peptides found less than 50% of the time (N/2) were produced the more digestions were performed. Complete sequence coverage can be easily achieved when peptides that are found less than N/2 are included (Supplemental Figure S2). Taken together, these results indicate that a set compliment of peptides is always produced but that this compliment does not cover the entire sequence of phosphorylase b. Multiple pepsin digestions are therefore needed to qualitatively identify the entire compliment of reproducible peptides in a mixture of peptic peptides, however, only a small number of replicated digestions (5-10 replicates) is required to identify the reproducible peptides.
Variability in peptide signal intensity
In addition to what peptides are produced, the question arises as to the signal intensity of each peptide and how reproducible that is. Not all peptic peptides are ionized to the same extent, nor are they found in the same quantity after digestion. Empirically, it is known that some peptide ions produce large signals while others are much less intense. We measured both the intensity of each reproducible peptide and the reproducibility of the intensity signal in replicate online pepsin digestions by determining the peptide peak area. The peptide peak area was determined by taking the sum of MS intensities of all isotopic peaks in all charge states that were detected [36]. From the same data acquired for identifying what ions were produced (above), we analyzed the signals of reproducible peptides that were found five times or more for N=10 digestions. The results are shown in Figure 2A where each vertical bar represents the average peak area of the reproducible peptides. As expected, a wide range of peptide peak intensity was detected and this agrees with empirical observations where some ions are strong, some are weak. Importantly, many peptides in low abundance appeared to be reproducible as well. Figure 2B describes the relative standard deviation (RSD) of the peak area of the same peptides from Figure 2A. The overall %RSD of peak area was well under 10% and the average of all was only5.4%.
Figure 2.

Quantitative reproducibility of peptic peptides generated in 10 replicate digestions. The dynamic range of the signal intensity (A) indicates that there was wide variety in mass spectral intensity of peptide ions. Each signal had relatively small error bars, determined from the variability within the set of 10 digestions. The percent relative standard deviation of the peptide signals (B) was plotted in order of decreasing %RSD. The average %RSD of peak area for the reproducible peptic peptides was 5.4% (dotted line).
The reproducible peptides in these experiments were generated with online pepsin digestion. Since the digestion conditions such as the flow rate and digestion time were fixed, online pepsin digestion provides a more robust digestion environment compared to in-solution pepsin digestion. When phosphorylase b was digested with pepsin in solution and the digestion repeated 10 times, the average %RSD of the peak area was found to be 17.0% (data not shown, see Supplemental Table S1), which was much higher than the 5.4% found for online pepsin digestion. When other proteins such as cytochrome c and interferon were digested online (Table S1), the average %RSD of peak area was 6.4% (N=3) and 4.6% (N=4), respectively. These values were similar to the results for phosphorylase b. A comparison was also made for phosphorylase b digestion with trypsin, both online and offline. The %RSD of the peak areas of the peptides was found to be 3.9% for online trypsin digestion and 12.0% for offline trypsin digestion (Supplemental Table S1).
Beyond pepsin
As was shown above, multiple digestions under the same conditions do not necessarily produce reproducible peptides that cover the entire sequence of a protein. Only 85% of the sequence of phosphorylase b was covered with reproducible peptides after 31 digestions. One well known way to tweak the digestion to produce different kinds of peptides is by altering the digestion conditions by including additives in the digestion, such as denaturant (e.g., [38, 39]). Another option is to change to, or supplement with, another enzyme(s), e.g. [24]. A number of other acid proteases have been investigated, as described above; we have investigated pepsin from the rice field eel (Monopterus albus Zuiew) which is one more options for HDX MS and other applications requiring acidic-pH digestion.
Pepsin from the stomach of rice field eels was recently described [34]. Freshly prepared rice field eel pepsin was acquired and its digestion specificity in offline digestion was compared to that of the more common acid proteases, pepsin and aspergillopepsin. Note that digestion of test proteins for comparison among proteases was done offline (as rice field eel pepsin was not immobilized for online digestion) and a slightly different chromatographic separation gradient used (15 minutes instead of 6 minutes) compared to the analysis of pepsin reproducibility described above. As shown in Figure 3, very different chromatographic profiles were found in peptide separations of phosphorylase b digested by the three enzymes offline. These digestions were conducted under the same conditions: the amount of phosphorylase b, ratio of protein and enzyme in solution digestion, the digestion time, pH, and temperature, as well as the same chromatography conditions. Some identical peptides (with the same retention time and the same MS and MS/MS) were produced by the different enzymes; however, many different kinds of peptides were also observed. In order to illustrate how different these peptides were, a small example of the phosphorylase b map (residues 241-480) produced by rice field eel pepsin, porcine pepsin, and aspergillopepsin is shown in Figure 4 (see Supplemental Figure S3 for full maps). As calculated from the full maps, a total of 145, 221, and 122 overlapping peptides (equating to 88, 97, and 62% sequence coverage of phosphorylase b) were generated upon digestion with rice field eel pepsin, porcine pepsin, and aspergillopepsin, respectively. The most efficient proteolysis was accomplished by porcine pepsin which produced the most peptides and the highest sequence coverage. Rice field eel pepsin performed better than aspergillopepsin under the same digestion conditions. The peptides used to make all these comparisons, again, were reproducible ones that were found at least three times in five repeated digestions in solution.
Figure 3.

Chromatographic separations of the peptides produced during digestion of phosphorylase b with porcine pepsin (top), rice field eel pepsin (middle), and aspergillopepsin (bottom). Comparing the peptide separation profilesshows that each enzyme produced significantly different peptides upon digestion of the same test protein under identical conditions.
Figure 4.

Sequence map comparison of phosphorylase b digested by rice field eel pepsin (cyan), porcinepepsin (yellow), and aspergillopepsin(pink). Only a small portion of the digestion map is shown here (for full map, see Figure S3). Each protease showed different digestion efficiency under the same digestion conditions achieving 88, 97, and 62% coverage (over the entire map, not just the small potion shown here) for rice field eel pepsin, porcinepepsin, and aspergillopepsin, respectively. Digestions were repeated (N=5) and reproducible peptides were selected for ones identified at least 3 times or greater. The red and blue dashed lines are cleavage points discussed in the text. The sequence coverage map was created using MSTools[37].
Given that the sequence of each peptide was determined, from the same data it was also possible to draw some general conclusions about specificity. One must be careful with making precise conclusions about specificity without a large database of thousands of cleavage points. The current dataset is not large enough to make definitive conclusions but some general trends can be observed. In agreement with previously published results [19, 20, 22, 23], pepsin had a high cleavage frequency C-terminal to leucine and phenylalanine. This trend was repeated for rice field eel pepsin and aspergillopepsin, again demonstrating that aspartic proteases prefer bulky hydrophobic residues in the P1 position. For example, all three proteases specifically cleaved between L243 and W244 (-RL|WS- as indicated with the red dashed line in Figure 4). There were other digestion trends between the three proteases that were not so similar. Rice field eel pepsin and aspergillopepsin cleaved between N453 and G454 (-VN|GV- as indicated with the blue dashed line in Figure 4) whereas porcine pepsin did not cleave this sequence at all.
Even though certain preferential cleavage sites were obvious, i.e. bulky hydrophobics, the cleavage specificity for the other residues had more variability and was harder to predict. Figure 5 demonstrates the cleavage frequency per amino acid residue, comparing the % cleavage frequencies of rice field eel pepsin, porcine pepsin, and aspergillopepsin. The cleavage frequency was determined from the ratio of the number of cleavages observed at each amino acid over the total number of cleavages observed, a calculation done for both the P1 and P1’ positions. A few trends can be observed from these data. Rice field eel pepsin showed the highest cleavage frequency at leucine followed by phenylalanine at P1. This trend was repeated for porcine pepsin, however aspergillopepsin did not cleave as frequently with phenylalanine in P1. Instead, aspergillopepsin was able to accommodate arginine, asparagine, and histidine in the P1 position much better than the other enzymes. These results are in good agreement with those reported previously [24, 28]. Second, Figure 5A suggests that cysteine, glycine, isoleucine, lysine, proline, serine, valine, and tryptophan at P1 were generally unfavorable for cleavage (although not impossible, see note above about broad specificity conclusions from small digestion datasets), with cleavage frequencies less than 5% for these residues in P1 all three enzymes. Third, the amino acid preference for position P1’ was more similar for all enzymes, with a few notable exceptions. Rice field eel pepsin showed relatively high cleavage frequencies for residues such as lysine, arginine,and glycine at P1’ compared to the other two enzymes. Forth, the average length of the peptides produced by rice field eel pepsin, porcine pepsin, and aspergillopepsin were similar, as shown in Figure 6. Most of the reproducible peptides were between 5-22 residues long. Each enzyme produced peptides with an average length of 14 residues. The final trend we wish to point out is that rice field eel pepsin isomers showed quite similar digestion specificity but one of the isomers, PG-1, showed better digestion efficiency than the other two, PG-2 and PG-3. Phosphorylase b sequence coverage was 88% and 64% for PG-1 and PG-2, respectively (see Supplemental Figure S4; data for PG-3 not shown). As aspartic proteases often have isoforms (e.g., human pepsin A has three isoforms, A1, A2, A3[40], Antarctic rock cod has two isoforms [21]), perhaps such differences as observed for rice field eel pepsin exist for other species in terms of variation in activity and specificity between isoforms.
Figure 5.

Cleavage frequency during phosphorylase b digestion. Percent cleavage frequencywas plotted for each amino acid located at P1 and P1’ (where P1 and P1’ indicatethe residue N-terminal or C-terminal to the cleaved peptide bond, respectively, as shown at the top right for the example sequence GFRT). Asterisks (*) indicate some interesting differences discussed in the text.
Figure 6.
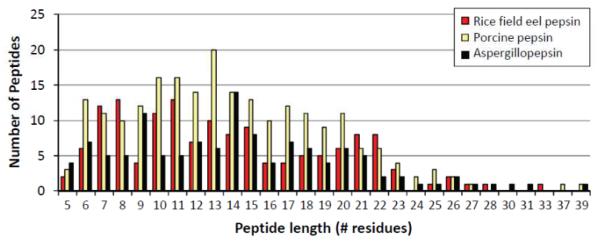
Digested peptide length after cleavage by rice field eel pepsin (red), porcine pepsin (yellow), and aspergillopepsin (black). The average peptide length was 14residues for all three enzymes. Because the digestion efficiency of porcine pepsin was higher than the other enzymes under same digestion conditions, the total number of reproducible peptides that were produced appears larger.
CONCLUSIONS
We have evaluated the reproducibility of pepsin digestions to determine how many digestions are required to obtain reproducible peptic peptides. The collection of reproducible peptides can be determined from repeated digestions and we reported that the number of reproducible peptides in pepsin digestions becomes constant even as the number of pepsin digestions is increased. Non-reproducible peptides are generated in large numbers of digestions and they contribute to the complexity of pepsin digestion. For our example large protein from the cytoplasm, phosphorylase b, highly reproducible peptides that cover greater than 85% of the amino acid sequence can be achieved, with many of the peptides overlapping. Peptic peptides are quantitatively reproducible, as shown by measuring the intensity of each peptide signal, and the average percent relative standard deviation of the intensity was 5.4%. We investigated aspartic acid proteases besides pepsin, namely, rice field eel pepsin and aspergillopepsin and compared digestion efficiency and specificity to porcine pepsin. Despite relatively low specificityin both the P1 and P1’ positions, we found generally better cleavage specificity for rice field eel pepsin at arginine, asparagine, and glycine, as compared to the other enzymes. Similar to porcine pepsin and aspergillopepsin, rice field eel pepsin showed the ability to tolerate the acidic quench conditions needed for HDX experiments. Different kinds of peptides produced by the various proteases can enhance protein coverage and consequently these aspartic proteases improve the spatial resolution of HDX MS data due to many different overlapping peptides.
Supplementary Material
Highlights.
Reproducible peptides (found >N/2 times in N digestions) were identified from a large number of replicate digestions.
The number of unique peptic peptides identified continues to increase with more digestions whereas the number of reproducible peptides plateaus above 5-6 replicate digestions.
The reproducibility of the MS signal for all reproducible peptides was quantified and the average error of peptide intensity was 5.4% RSD.
Pepsin from the rice field eel was characterized and its specificity was compared to porcine pepsin and aspergillopepsin.
ACKNOWLEDGEMENTS
We are pleased to thank Dr. Thomas Wales and Dr. Keith Fadgen for helpful discussions. This work was supported in part bythe Waters Corporation and the National Institutes of Health (GM 086507).
Abbreviations
- HDX MS
hydrogen deuterium exchange mass spectrometry
Footnotes
Publisher's Disclaimer: This is a PDF file of an unedited manuscript that has been accepted for publication. As a service to our customers we are providing this early version of the manuscript. The manuscript will undergo copyediting, typesetting, and review of the resulting proof before it is published in its final citable form. Please note that during the production process errors may be discovered which could affect the content, and all legal disclaimers that apply to the journal pertain.
REFERENCES
- [1].Wang R, Chait BT. High-accuracy mass measurement as a tool for studying proteins. Curr Opin Biotechnol. 1994;5:77–84. doi: 10.1016/s0958-1669(05)80074-6. [DOI] [PubMed] [Google Scholar]
- [2].Gundry RL, White MY, Murray CI, Kane LA, Fu Q, Stanley BA, Van Eyk JE. Preparation of proteins and peptides for mass spectrometry analysis in a bottom-up proteomics workflow. Curr Protoc Mol Biol. 2009 doi: 10.1002/0471142727.mb1025s88. Chapter 10. Unit10 25. [DOI] [PMC free article] [PubMed] [Google Scholar]
- [3].Lopez-Ferrer D, Petritis K, Robinson EW, Hixson KK, Tian Z, Lee JH, Lee SW, Tolic N, Weitz KK, Belov ME, Smith RD, Pasa-Tolic L. Pressurized pepsin digestion in proteomics: an automatable alternative to trypsin for integrated top-down bottom-up proteomics. Mol Cell Proteomics. 2011;10:M110. doi: 10.1074/mcp.M110.001479. 001479. [DOI] [PMC free article] [PubMed] [Google Scholar]
- [4].Wang JL, Edelman GM. Fluorescent probes for conformational states of proteins. IV. The pepsinogen-pepsin conversion. The Journal of biological chemistry. 1971;246:1185–1191. [PubMed] [Google Scholar]
- [5].Jin KS, Rho Y, Kim J, Kim H, Kim IJ, Ree M. Synchrotron small-angle X-ray scattering studies of the structure of porcine pepsin under various pH conditions. J Phys Chem B. 2008;112:15821–15827. doi: 10.1021/jp805940d. [DOI] [PubMed] [Google Scholar]
- [6].Dee DR, Filonowicz S, Horimoto Y, Yada RY. Recombinant prosegment peptide acts as a folding catalyst and inhibitor of native pepsin. Biochimica et biophysica acta. 2009;1794:1795–1801. doi: 10.1016/j.bbapap.2009.08.017. [DOI] [PubMed] [Google Scholar]
- [7].Fruton JS. A history of pepsin and related enzymes. Q Rev Biol. 2002;77:127–147. doi: 10.1086/340729. [DOI] [PubMed] [Google Scholar]
- [8].Hvidt A, Nielsen SO. Hydrogen exchange in proteins. Adv Protein Chem. 1966;21:287–386. doi: 10.1016/s0065-3233(08)60129-1. [DOI] [PubMed] [Google Scholar]
- [9].Englander SW, Downer NW, Teitelbaum H. Hydrogen exchange. Annu Rev Biochem. 1972;41:903–924. doi: 10.1146/annurev.bi.41.070172.004351. [DOI] [PubMed] [Google Scholar]
- [10].Zhang Z, Smith DL. Determination of amide hydrogen exchange by mass spectrometry: a new tool for protein structure elucidation. Protein Science. 1993;2:522–531. doi: 10.1002/pro.5560020404. [DOI] [PMC free article] [PubMed] [Google Scholar]
- [11].Wales TE, Engen JR. Hydrogen exchange mass spectrometry for the analysis of protein dynamics. Mass Spectrom Rev. 2006;25:158–170. doi: 10.1002/mas.20064. [DOI] [PubMed] [Google Scholar]
- [12].Rosa JJ, Richards FM. An experimental procedure for increasing the structural resolution of chemical hydrogen-exchange measurements on proteins: application to ribonuclease S peptide. J Mol Biol. 1979;133:399–416. doi: 10.1016/0022-2836(79)90400-5. [DOI] [PubMed] [Google Scholar]
- [13].Englander SW, Kallenbach NR. Hydrogen exchange and structural dynamics of proteins and nucleic acids. Q Rev Biophys. 1983;16:521–655. doi: 10.1017/s0033583500005217. [DOI] [PubMed] [Google Scholar]
- [14].Englander JJ, Rogero JR, Englander SW. Protein hydrogen exchange studied by the fragment separation method. Anal Biochem. 1985;147:234–244. doi: 10.1016/0003-2697(85)90033-8. [DOI] [PMC free article] [PubMed] [Google Scholar]
- [15].Zhang Z, Smith DL. Determination of amide hydrogen exchange by mass spectrometry: a new tool for protein structure elucidation. Protein Sci. 1993;2:522–531. doi: 10.1002/pro.5560020404. [DOI] [PMC free article] [PubMed] [Google Scholar]
- [16].Ehring H. Hydrogen exchange/electrospray ionization mass spectrometry studies of structural features of proteins and protein/protein interactions. Anal Biochem. 1999;267:252–259. doi: 10.1006/abio.1998.3000. [DOI] [PubMed] [Google Scholar]
- [17].Wang L, Pan H, Smith DL. Hydrogen exchange-mass spectrometry: optimization of digestion conditions. Mol Cell Proteomics. 2002;1:132–138. doi: 10.1074/mcp.m100009-mcp200. [DOI] [PubMed] [Google Scholar]
- [18].Sachdev GP, Fruton JS. Secondary enzyme-substrate interactions and the specificity of pepsin. Biochemistry. 1970;9:4465–4470. doi: 10.1021/bi00825a001. [DOI] [PubMed] [Google Scholar]
- [19].Fruton JS. The specificity and mechanism of pepsin action. Adv Enzymol Relat Areas Mol Biol. 1970;33:401–443. doi: 10.1002/9780470122785.ch9. [DOI] [PubMed] [Google Scholar]
- [20].Powers JC, Harley AD, Myers DV. Subsite specificity of porcine pepsin. Adv Exp Med Biol. 1977;95:141–157. doi: 10.1007/978-1-4757-0719-9_9. [DOI] [PubMed] [Google Scholar]
- [21].Brier S, Maria G, Carginale V, Capasso A, Wu Y, Taylor RM, Borotto NB, Capasso C, Engen JR. Purification and characterization of pepsins A1 and A2 from the Antarctic rock cod Trematomus bernacchii. The FEBS journal. 2007;274:6152–6166. doi: 10.1111/j.1742-4658.2007.06136.x. [DOI] [PMC free article] [PubMed] [Google Scholar]
- [22].Palashoff MH. Department of Chemistry and Chemical Biology, vol. MS thesis. Northeastern University; Boston: 2008. Determining the specificity of pepsin for proteolytic degestion; p. 78. [Google Scholar]
- [23].Hamuro Y, Coales SJ, Molnar KS, Tuske SJ, Morrow JA. Specificity of immobilized porcine pepsin in H/D exchange compatible conditions. Rapid Commun Mass Spectrom. 2008;22:1041–1046. doi: 10.1002/rcm.3467. [DOI] [PubMed] [Google Scholar]
- [24].Cravello L, Lascoux D, Forest E. Use of different proteases working in acidic conditions to improve sequence coverage and resolution in hydrogen/deuterium exchange of large proteins. Rapid Commun. Mass Spectrom. 2003;17:2387–2393. doi: 10.1002/rcm.1207. [DOI] [PubMed] [Google Scholar]
- [25].Hoofnagle AN, Resing KA, Ahn NG. Protein analysis by hydrogen exchange mass spectrometry. Annu Rev Biophys Biomol Struct. 2003;32:1–25. doi: 10.1146/annurev.biophys.32.110601.142417. [DOI] [PubMed] [Google Scholar]
- [26].Engen JR, Wales TE, Shi X. Hydrogen Exchange Mass Spectrometry for Conformational Analysis of Proteins. In: Meyers RA, editor. Encyclopedia of Analytical Chemistry. Wiley; 2011. DOI: 10.1002/9780470027318.a9780470029201. [Google Scholar]
- [27].Man P, Montagner C, Vernier G, Dublet B, Chenal A, Forest E, Forge V. Defining the interacting regions between apomyoglobin and lipid membrane by hydrogen/deuterium exchange coupled to mass spectrometry. Journal of Molecular Biology. 2007;368:464–472. doi: 10.1016/j.jmb.2007.02.014. [DOI] [PubMed] [Google Scholar]
- [28].Zhang HM, Kazazic S, Schaub TM, Tipton JD, Emmett MR, Marshall AG. Enhanced Digestion Efficiency, Peptide Ionization Efficiency, and Sequence Resolution for Protein Hydrogen/Deuterium Exchange Monitored by Fourier Transform Ion Cyclotron Resonance Mass Spectrometry. Anal Chem. 2008;80:9034–9041. doi: 10.1021/ac801417d. [DOI] [PMC free article] [PubMed] [Google Scholar]
- [29].Rey M, Man P, Brandolin G, Forest E, Pelosi L. Recombinant immobilized rhizopuspepsin as a new tool for protein digestion in hydrogen/deuterium exchange mass spectrometry. Rapid Commun Mass Spectrom. 2009;23:3431–3438. doi: 10.1002/rcm.4260. [DOI] [PubMed] [Google Scholar]
- [30].Marcoux J, Thierry E, Vives C, Signor L, Fieschi F, Forest E. Investigating alternative acidic proteases for H/D exchange coupled to mass spectrometry: plasmepsin 2 but not plasmepsin 4 is active under quenching conditions. J Am Soc Mass Spectrom. 2010;21:76–79. doi: 10.1016/j.jasms.2009.09.005. [DOI] [PubMed] [Google Scholar]
- [31].Tanji M, Kageyama T, Takahashi K. Tuna pepsinogens and pepsins. Purification, characterization and amino-terminal sequences. Eur J Biochem. 1988;177:251–259. doi: 10.1111/j.1432-1033.1988.tb14369.x. [DOI] [PubMed] [Google Scholar]
- [32].Nguyen AD, Nungaray J, Martel A, Le Goffic F, Molle D, Leonil J. Purification and characterization of the main pepsinogen from the shark, Centroscymnus coelolepis. J Biochem. 1998;124:287–293. doi: 10.1093/oxfordjournals.jbchem.a022109. [DOI] [PubMed] [Google Scholar]
- [33].Zhou Q, Liu GM, Huang YY, Weng L, Hara K, Su WJ, Cao MJ. Pepsinogens and pepsins from mandarin fish (Siniperca chuatsi) J Agric Food Chem. 2008;56:5401–5406. doi: 10.1021/jf800458n. [DOI] [PubMed] [Google Scholar]
- [34].Weng WY, Wu T, Chen WQ, Liu GM, Osatomi K, Su WJ, Cao MJ. Purification and characterization of pepsinogens and pepsins from the stomach of rice field eel (Monopterus albus Zuiew) Fish Physiol Biochem. 2011;37:543–552. doi: 10.1007/s10695-010-9456-x. [DOI] [PubMed] [Google Scholar]
- [35].Wales TE, Fadgen KE, Gerhardt GC, Engen JR. High-speed and high-resolution UPLC separation at zero degrees Celsius. Anal Chem. 2008;80:6815–6820. doi: 10.1021/ac8008862. [DOI] [PMC free article] [PubMed] [Google Scholar]
- [36].Silva JC, Denny R, Dorschel C, Gorenstein MV, Li GZ, Richardson K, Wall D, Geromanos SJ. Simultaneous qualitative and quantitative analysis of the Escherichia coli proteome: a sweet tale. Mol Cell Proteomics. 2006;5:589–607. doi: 10.1074/mcp.M500321-MCP200. [DOI] [PubMed] [Google Scholar]
- [37].Kavan D, Man P. MSTools--Web based application for visualization and presentation of HXMS data. Int J Mass Spectrom. 2011;302:53–58. [Google Scholar]
- [38].Busby SA, Chalmers MJ, Griffin PR. Improving digestion efficiency under H/D exchange conditions with activated pepsinogen coupled columns. Int J Mass Spectrom. 2006;259:130–139. [Google Scholar]
- [39].Zhang HM, McLoughlin SM, Frausto SD, Tang H, Emmett MR, Marshall AG. Simultaneous reduction and digestion of proteins with disulfide bonds for hydrogen/deuterium exchange monitored by mass spectrometry. Anal Chem. 2010;82:1450–1454. doi: 10.1021/ac902550n. [DOI] [PMC free article] [PubMed] [Google Scholar]
- [40].Tarasova N, Denslow ND, Parten BF, Tran N, Nhuyen HP, Jones A, Roberts NB, Dunn BM. A comparative study on amino acid sequences of three major isoforms of human pepsin A. Adv Exp Med Biol. 1995;362:77–81. doi: 10.1007/978-1-4615-1871-6_8. [DOI] [PubMed] [Google Scholar]
Associated Data
This section collects any data citations, data availability statements, or supplementary materials included in this article.