

Abstract
Single crystals of solvated β-hematin were grown from a DMSO solution containing the antimalarial drug chloroquine, a known inhibitor of β-hematin formation. In addition, a kinetics study employing biomimetic lipid-water emulsion conditions was undertaken to further investigate the effect of chloroquine and quinidine on the formation of β-hematin. Scanning electron microscopy shows that the external morphology of the β-hematin DMSO solvate crystals is almost indistinguishable from that of malaria pigment (hemozoin) and single crystal X-ray diffraction confirms the presence of μ-propionato coordination dimers of iron(III) protoporphyrin IX. The free propionic acid functional groups of adjacent dimers hydrogen bond to included DMSO molecules, rather than forming carboxylic acid dimers. The observed exponential kinetics were modeled using the Avrami equation, with an Avrami constant equal to 1. The decreased rate of β-hematin formation observed at low concentrations of both drugs could be accounted for by assuming a mechanism of drug adsorption to sites on the fastest growing face of β-hematin. This behavior was modeled using the Langmuir isotherm. Higher concentrations of drug resulted in decreased final yields of β-hematin, and an irreversible drug-induced precipitation of iron(III) protoporphyrin IX was postulated to account for this. The model permits determination of the equilibrium adsorption constant (Kads). The values for chloroquine (log Kads = 5.55 ± 0.03) and quinidine (log Kads = 4.92 ± 0.01) suggest that the approach may be useful as a relative probe of the mechanism of action of novel antimalarial compounds.
1. Introduction
The malaria parasite (genus Plasmodium) is pathogenic during the erythrocytic stage of its lifecycle inside a human host. Actively growing trophozoites digest 60–80% of the available hemoglobin, releasing free iron(II)protoporphyrin IX (Fe(II)PPIX, heme) into the acidic aqueous environment of the digestive vacuole, which is later oxidized to Fe(III)PPIX. With the capacity to initiate membrane rupture,1 at least 95% of the free Fe(III)PPIX is efficiently sequestered as a micro-crystalline solid material known as hemozoin (Hz).2 The structure of synthetic Hz, referred to as β-hematin,3 has been determined by powder X-ray diffraction (PXRD) using Rietveld refinement.4 The authors showed that the repeating unit is a centrosymmetric μ-propionato coordination dimer of Fe(III)PPIX, and that adjacent dimers hydrogen bond directly to one another through the free propionic acid substituents on each porphyrin. Although the conversion of Fe(III)PPIX to Hz is not disputed, the mechanism by which the biomineralization process takes place is still unresolved. While much attention has been given to certain parasite-specific proteins,5–7 recent studies point to a lipid-mediated mechanism.8–10 Indeed, kinetic studies performed in model lipid-water mixtures have returned biologically relevant half-life values in the order of minutes for the formation of β-hematin.11–13 Further investigations have shown that rather than forming a lipid-water interface, the delivery of the lipid in a methanol-acetone solution is followed by diffusional mixing of the organic solvents with water, which results in the formation of an emulsion consisting of lipid droplets clustered in two populations with average diameters of 100 nm and 5μm.12
Quinoline antimalarial drugs, of which chloroquine (CQ), amodiaquine (AQ), quinine (QN), quinidine (QD) and mefloquine (MQ) have all been used clinically, are known to inhibit the formation of β-hematin.14–17 However, the mechanisms by which this inhibition occurs remain poorly understood. One hypothesis is that the drugs adsorb onto the fastest growing face of β-hematin crystals in order to impede their further growth.17,18 Alternatively, it is thought that the drugs may form complexes with free Fe(III)PPIX in solution,19,20 either through π-stacking or coordination.21 Single crystal X-ray diffraction (SCD) has confirmed that aryl methanol antimalarial compounds, in addition to π-stacking, are capable of direct coordination to the iron center through their benzylic alcohol functional group. This was first observed in the coordination complex between Fe(III)PPIX and halofantrine.22 More recently, the structures of the coordination complexes formed between Fe(III)PPIX and both QN and QD have been solved.23 In comparison, the lack of solid-state structures of Fe(III)PPIX complexes with the 4-aminoquinoline compounds (e.g. CQ and AQ) has precluded our understanding of the mode of action of this class of compound. However, structure-activity studies performed on a series of CQ analogues are consistent with these compounds being able to accumulate in the digestive vacuole and form π-stacked complexes with Fe(III)PPIX.24 Two independent kinetic investigations have also shown that quinoline antimalarial drugs (both 4-aminoquinolines and quinoline methanols) act by decreasing the rate at which β-hematin is formed, rather than inhibiting its formation altogether.25,26 In the assays used, β-hematin formation was brought about in the presence of acidic acetate buffers, either at long incubation times or at high incubation temperatures.
On the back of our recent success in obtaining single crystals of the complexes of halofantrine, QN and QD with Fe(III)PPIX, we attempted to grow crystals of the analogous 4-aminoquinoline complexes. Surprisingly, our crystallizations yielded β-hematin, albeit as a solvate. This result provided the impetus to further probe the possible role of the inhibitor in promoting the formation of the β-hematin solvate crystals. We carried out a kinetic study on the formation of β-hematin, and specifically focused on the activities of CQ and QD. Furthermore, given the attention that lipids have received with regards to mediating β-hematin formation, we made use of biomimetic conditions (lipid-water emulsions). Finally, we have rationalized the observed kinetics based on the Avrami kinetic model together with the Langmuir isotherm model.
2. Materials and methods
2.1 Materials
All materials used were of the highest purity available commercially. N-[2-hydroxyethyl]piperazine-N′-[2-ethanesulfonic acid] (HEPES), hematin (porcine), hemin (bovine), citric acid monohydrate, chloroquine diphosphate, amodiaquine dihydrochloride, quinidine sulfate dihydrate, quinine hemisulfate hydrate, mefloquine hydrochloride, rac-1-monopalmitoylglycerol (MPG), pyridine, and sodium hydroxide (NaOH) were purchased from Sigma-Aldrich South Africa. Acetone and methanol were purchased from Kimix chemicals South Africa. Where water was used to prepare solutions, this was glass distilled.
2.2 Single crystals of the β-hematin DMSO solvate
A 0.76 mM stock solution of Fe(III)PPIX was prepared by dissolving hemin (5.0 mg, 7.6 μmol) in 10.0 ml DMSO. A 1.56 mM stock solution of CQ (as its free base) was prepared by dissolving 5.0 mg (15.6 μmol) in 10.0 ml DMSO. The crystallization medium was prepared by adding 1.0 ml of the Fe(III)PPIX stock solution to 1.0 ml of the CQ stock solution in a small 5 ml glass vial. Hence the solution contained approximately two mol equivalents of CQ relative to Fe(III)PPIX. The mixture was stirred at 100 °C for 30 minutes, after which it was allowed to stand in a water bath at 37 °C for a further 24 hours. The solution was then filtered through a PTFE disc (0.45 μm pore size) into a clean vial, which was subsequently covered with parafilm and allowed to stand at room temperature. The parafilm was punctured with one needle-sized hole to allow slow evaporation of solvent. Small needle-shaped crystals were observed on the bottom of the vial after 2 days. A single crystal of dimensions 0.15 × 0.05 × 0.01 mm was selected for X-ray diffraction. Details of the data collection, and solution and refinement of the crystal structure are provided in the supporting information.
2.3 Modified Phiβ assay for measuring inhibition of β-hematin formation
The pyridine hemichrome inhibition of β-hematin (Phiβ) assay exploits the ability of 5% (v/v) aqueous pyridine (pH 7.5) to selectively form a soluble low-spin bis-pyridyl complex with unreacted Fe(III)PPIX and not β-hematin.27 The resultant Fe(III)PPIX-pyridine complex is orange-pink in color, making it possible for the concentration of free Fe(III)PPIX to be determined spectrophotometrically from the absorbance of the Soret band (405 nm). The principles of the Phiβ assay were applied in the current work, however with minor modification where necessary owing to different experimental conditions. Briefly, a stock solution of citrate buffer (50 mM) containing the antimalarial drug to be investigated was prepared in water, and the pH adjusted to 4.8 using a saturated solution of NaOH. This approach is suitable for compounds that are soluble in aqueous solution, and was used in this study to prepare solutions containing CQ, AQ, QD and QN. Reactions were carried out in 15 mL Falcon tubes (16 mm diameter) which were prepared in the following manner. A 50 mM solution of citrate buffer (pH 4.8) was used to dilute the citrate/drug stock solution to a series of different concentrations as required. Each tube contained a total volume of 5 mL of drug-containing buffer and was allowed to equilibrate at 37 °C for at least 30 minutes prior to the start of an experiment. A 3.2 mM stock solution of Fe(III)PPIX was prepared by dissolving 10 mg of hematin in 2.0 mL 0.1 M NaOH followed by the addition of 3.0 mL of a 1:9 (v/v) acetone-methanol solvent mixture. A 3.3 mM MPG lipid solution was prepared in the same 1:9 acetone-methanol solvent mixture. For each reaction, 200 μL of the lipid solution were premixed with an aliquot of the Fe(III)PPIX stock solution. Based on earlier unpublished work, we used a 5 μL aliquot (3.1 μM in 5.2 mL) for the IC50 determinations, however following the publication of the kinetic studies of β-hematin formation,12 a 2 μL aliquot (1.2 μM in 5.2 mL) was chosen for the kinetic studies of β-hematin inhibition. The premixed solution was delivered carefully to the surface of the citrate buffer by means of an ultra-thin (23 gauge) syringe, and the system was allowed to incubate for a pre-established length of time. Reactions were quenched by the addition of 1.0 mL of an aqueous solution containing 30 % pyridine, 10% HEPES buffer (2.0 M, pH 7.5) and 40% acetone (v/v). This resulted in a solution which contained 5% (v/v) pyridine overall. Solutions were subsequently vortexed to ensure complete interaction of pyridine with all free Fe(III)PPIX after which they were centrifuged for 10 minutes at 6000 rpm. At this point there was often the need to allow visible lipid precipitate to settle before transferring a 2.0 mL fraction of the supernatant to a quartz cuvette. Colorimetric measurements at 405 nm allowed determination of the amount of unreacted Fe(III)PPIX in each experiment. Data were analyzed by nonlinear least squares fitting using GraphPad Prism 5 software.28
2.4 Kinetic studies of β-hematin inhibition
The kinetic effects of CQ and QD, examples of a 4-aminoquinoline and quinoline methanol antimalarial respectively, were investigated in detail. Following the procedures described above in 2.3, kinetic studies of β-hematin formation in the presence of various concentrations (between 0 and 0.1 mM) of CQ and QD were performed. In contrast to a previous study in which drug concentrations were prepared as equivalents relative to Fe(III)PPIX,26 the current study made use of molar concentrations. A series of nine tubes, each containing the same drug concentration, were incubated for different lengths of time (up to 20 hours) in order to generate the data points for a single experiment. Such measurements are typically carried out in triplicate, however owing to the relatively large errors produced in the lipid emulsion system, measurements were performed up to nine times in order to increase confidence in the recorded values. The extent of reaction was monitored using the Phiβ assay. The data were best fitted to an exponential equation, the theoretical basis of which is discussed in detail below.
2.5 Determination of drug IC50 values
Following the procedures described above in 2.3, a series of nine different concentrations, from 0 to that required for complete inhibition, were used as data points for a single experiment. Sets of tubes were then incubated for the same length of time, which was varied in turn between 30 and 1200 min. Measurements at each time point were performed up to nine times in order to improve the confidence in the recorded values. The extent of reaction was monitored using the Phiβ assay. The data were fitted to either a simple hyperbolic or a sigmoidal dose-response profile, which allowed the drug concentration required to inhibit the formation of β-hematin by 50% (IC50) to be determined.
3. Results
3.1 Single crystals of the β-hematin DMSO solvate
As part of an ongoing effort to obtain single crystals of quinoline antimalarial drug- Fe(III)PPIX complexes that are of a suitable size to be analyzed by X-ray diffraction, we attempted to prepare crystals of the Fe(III)PPIX-CQ complex from a DMSO solution of Fe(III)PPIX and approximately 2 mol equivalents of free base CQ. This yielded small rod-shaped crystals, which when removed from the mother liquor, proved to be unstable, collapsing into a tarry amorphous material. As discussed below, it was found that the material was a DMSO solvate, and the instability probably arises from rapid desolvation or absorption of water. For the purposes of collecting diffraction data, a single crystal (0.15 × 0.05 × 0.01 mm) was therefore mounted in paratone oil on the goniometer head and immediately exposed to a cold stream (100K) on the diffractometer. Much to our surprise, analysis of the diffraction data revealed that the species that had in fact crystallized was a DMSO solvate of β-hematin. The repeating unit in the crystal structure is a centrosymmetric μ-propionato coordination dimer of Fe(III)PPIX (Figure 1a), which is almost identical to that reported for β-hematin and Hz from powder diffraction data.4,29 An infrared spectrum of the material confirmed that this result was representative of the bulk sample (Supporting information, Figure S1). The characteristic peaks attributed to coordination of the propionate groups occur at 1651 and 1205 cm−1, similar to β-hematin and Hz but slightly shifted to lower wavenumbers.30 The peak at 1703 cm−1, which corresponds to the carbonyl stretch of the free carboxylic acid groups, also appears at a slightly lower wavenumber compared to β-hematin.31 The frequency of carbonyl stretches in hydrogen-bonded carboxylic acid moieties has been shown to be sensitive to both hydrogen bond strength and dielectric constant of the environment.32 Given the presence of the DMSO in the structure of the β-hematin DMSO solvate, and its involvement in hydrogen bonding as discussed below, it is possible that such factors may account for the observed differences reported above. Attempts were also made to use X-ray powder diffraction to confirm that the bulk sample has the same structure as the single crystal selected for analysis. However, owing to the instability noted above, these were unsuccessful. In every case, the powder rapidly collapsed into a sticky, amorphous oil.
Figure 1.

(a) The μ-propionato dimer of Fe(III)PPIX observed in the β-hematin DMSO solvate structure determined by SCD. The hydrogen bond (O3—H3····O6) between the propionic acid group of Fe(III)PPIX and an included DMSO molecule is indicated as a dashed red line. Ellipsoids have been drawn at 50% probability. In the vinyl and methyl substituents where disorder was displayed, the position with the highest site occupancy factor has been selected. Atom colors are: grey – C; white – H; blue – N; red – O; cyan – Fe and yellow – S. All other hydrogen atoms, as well as the included DMSO molecules that do not participate in hydrogen bonding, have been removed for clarity. (b) SEM micrograph of crystals of the β-hematin DMSO solvate grown in the presence of free base CQ. The scale bar (bottom left) represents 20 μm.
An overlay of the porphyrin cores of the β-hematin DMSO solvate and β-hematin further confirm the close agreement between the structure of the repeating units (Supporting information, Figure S2). In the DMSO solvate, three molecules of solvent are included in the crystal packing per molecule of Fe(III)PPIX. One DMSO molecule is hydrogen-bonded to the free propionic acid group of each Fe(III)PPIX molecule (Supporting information, Table S1), while the other two molecules are not involved in hydrogen bonding and simply occupy the free space between adjacent columns of stacked μ-propionato dimers. Owing to the presence of the solvent, the unit cell parameters obtained for the β-hematin DMSO solvate are different when compared to those reported for β-hematin, which was determined to be void of solvent.4 Comparative values are provided in Table S2. Despite the inclusion of solvent molecules, scanning electron microscopy confirms that the external morphology of the crystals of the β-hematin DMSO solvate is visually similar to the observed growth form of β-hematin (Figure 1b).33,34 Interestingly, there do not appear to be any signs of the crystals having tapered ends, as has been observed in the presence of 10% CQ (mol/mol Fe(III)PPIX) in DMSO-MeOH and CHCl3 solutions.34
While the external crystal morphology and the repeating μ-propionato dimer appear to be almost indistinguishable in the β-hematin DMSO solvate and β-hematin structures, examination of the crystal packing reveals interesting differences. The unit cell in each structure contains two molecules of Fe(III)PPIX which are related to one another through a center of inversion. In the structure of the β-hematin DMSO solvate, the unit cell contains two molecules of Fe(III)PPIX in which the unligated faces are directed towards each other (Figure 2a). The metal centers are offset relative to one another, and there is considerable lateral overlap of the porphyrin cores (Figure 2b). These Fe(III)PPIX pairs interact with one another through μ-propionato-Fe coordination along the a-axis, resulting in μ-propionato dimers in which the intra-dimer Fe-Fe distance is 8.982 Å (Figure S3). The distance between Fe centers of adjacent μ-propionato dimers (the inter-dimer distance) is 5.380 Å. In contrast, the unit cell in the β-hematin structure contains a μ-propionato dimer in which the intra-dimer Fe-Fe distance is 9.047 Å. These dimers align along the b-axis, although given the larger offset between porphyrin planes, there is much less lateral overlap between the porphyrin cores (Figure 2c). We measured inter-dimer Fe-Fe distances of between 7.859 and 8.040 Å from the structure of the crystal which was built in Xseed35 using the coordinates available through the Cambridge Structural Database (CSD).36
Figure 2.

(a) A section of the crystal lattice of the β-hematin DMSO solvate viewed down the b-axis. The unit cell, which is outlined in grey, contains a pair of Fe(III)PPIX molecules in which the two Fe atoms are separated by a inter-dimer distance of 5.380 Å (i). Packing of the crystal along the a-axis is brought about by μ-propionato-Fe coordination, resulting in the formation of centrosymmetric μ-propionato dimers in which the two Fe atoms are separated by an intra-dimer distance of 8.982 Å (ii). (b) A view down the Fe—O bonds of two adjacent μ-propionato dimers in the β-hematin DMSO solvate. The two porphyrin cores are laterally shifted relative to one another, with an observed inter-dimer Fe-Fe distance of 5.380 Å. (c) The corresponding view in β-hematin.4 In this case, the inter-dimer Fe-Fe distances vary between 7.859 and 8.040 Å. In (b) and (c) the porphyrin molecule at the back has been shaded green for clarity. Atom color coding in (a) and the front porphyrin in (b) and (c): C – grey; H – white; N – blue; O – red and Fe – cyan.
The vinyl and methyl substituents on pyrrole rings B and C (Figure 3) are disordered. This disorder has been modeled over two sites, labeled as α and β for the upper molecule of the μ-propionato dimer, and γ and δ for the lower molecule. The α and γ positions are shown in green, while the β and δ positions are shown in orange. In this model, the site occupancies of the two vinyl groups at each position (i.e. the two α, the two β, the two γ and the two δ vinyl groups) were set equal to each other, and the sum of the site occupancies of the α and β vinyl groups and of the γ and δ vinyl groups was set equal to 1.0. The site occupancies of the vinyl substituents refined to 0.66 at the α and γ positions, and 0.34 at the β and δ positions.
Figure 3.

Illustration of the vinyl disorder in the single crystal of the β-hematin DMSO solvate. The site occupancies of the α and γ positions (shown in green) refined to 0.66 while the site occupancies of the β and δ positions (shown in orange) refined to 0.34.
3.2 Theoretical model for kinetic behavior
In order to better understand why a β-hematin DMSO solvate crystal might form in the presence of CQ, and indeed why β-hematin itself can form in the presence of CQ,25,26 we undertook a detailed kinetic investigation of the inhibition of lipid-mediated β-hematin formation. It has previously been shown that the kinetics of β-hematin formation in lipid-water mixtures conform to an apparent first-order process.11,12
The effect of a drug on the rate of β-hematin formation could be accounted for by considering an equilibrium in which the drug associates with free Fe(III)PPIX (hematin) in solution, thereby reducing its concentration (Scheme 1). This implies that the rate determining step for β-hematin formation is a solution reaction, the rate of which is determined by the concentration of dissolved hematin species. Furthermore, if formation of the μ-propionato dimer of hematin (the precursor to β-hematin) in solution is rate determining, the reaction would be expected to be second-order with respect to hematin. It must be recognized however, that alternative rate-limiting steps, for example dissociation of the axial ligand, would result in a process that is first order in hematin. In addition to the precipitation of hematin as crystalline β-hematin, the presence of an inhibiting drug may also be expected to promote a competing process that results in the irreversible precipitation of hematin, possibly as a drug complex.
Scheme 1.

Possible model to explain the effect of a drug on the rate of β-hematin formation. (i) H(aq) – hematin; β(s) -β-hematin; k1 – rate constant for the formation of β(s). (ii) D(aq) – drug; DH(aq) – drug-hematin complex; K – association equilibrium constant. (iii) DH(s) – precipitated drug-hematin complex; k2 – rate constant for the formation of DH(s).
However, if β-hematin crystal growth is rate determining, then the rate would be expected to depend on the rates of crystal nucleation and growth and not on the dissolved hematin concentration. While kinetics cannot definitively distinguish between this mechanism and the solution mechanism presented above, it does seem the more likely scenario. Such a process must then be described using a crystal growth kinetic model rather than first-order kinetics. Indeed, in previous studies in acetate medium, kinetics of β-hematin formation were found to exhibit a sigmoidal time-dependence, which was fitted to the Avrami equation (eq. 1).31 This crystallization kinetics equation models the transformation of one phase to another during crystallization.37,38
| (1) |
In the above equation, mR is the mass of the reactant remaining at time t, relative to the initial mass, m0; z is the rate constant and n is the Avrami constant, which is typically an integer between 1 and 4. In acetate medium, with a value of 4,31 the Avrami constant indicates that nucleation is sporadic (i.e. is a continuous process) and that crystal growth takes place in three dimensions. However, with the Avrami constant equal to 1, eq. 1 becomes mathematically indistinguishable from that for first-order kinetics, and therefore is able to account for the exponential shape of the observed kinetic profile for the formation of β-hematin in lipid-water mixtures. The implication of a value of 1 for n is that the lipid provides a fixed number of preformed nuclei (corresponding to so-called random nucleation) and that the β-hematin crystals grow in approximately one dimension. The latter is consistent with the observed morphology of β-hematin, with crystals appearing as long needles.33,34 This is the more likely origin of the observed exponential time dependence seen in the kinetics of β-hematin formation.
In the presence of quinoline antimalarial drugs, Leiserowitz and co-workers have postulated that the inhibition of β-hematin formation is brought about by the adsorption of drug molecules to favorable binding sites on the fastest growing face of β-hematin crystals.18 Based on this hypothesis, a more realistic mechanistic explanation of the effect of drug on the rate of β-hematin formation can be envisaged (Scheme 2). In this model, the process of adsorption of the drug onto the growing face of the β-hematin crystal is reminiscent of the Langmuir isotherm, where the extent of monolayer coverage of a solid surface by an adsorbent gas molecule is proportional to the partial pressure of the adsorbent.39 However, in this case the extent of adsorption, θ, would rather be dependent on the concentration of the inhibiting drug, [D(aq)] (simplified as [D] in the equations below), in solution. At equilibrium, when the rates of adsorption and desorption are equal, the relationship is given by eq. 2:
| (2) |
where Kads is the adsorption equilibrium constant. It is reasonable to propose that any continued growth of β-hematin would be dependent on the number of free sites (1 – θ). Therefore, the rate constant for the formation of β-hematin in the presence of an inhibiting drug, zobs, is given by eq. 3:
| (3) |
where z is the rate constant for the formation of β-hematin in the absence of drug. From eq. 3, the rate constant is predicted to decrease with increasing drug concentration. Although this model is mathematically indistinguishable to that presented in Scheme 1, we consider it to be the more physically realistic interpretation.
Scheme 2.

(a) Proposed model to explain the effect of a drug on the rate of β-hematin formation. (i) S – surface-binding site on the growing face of β-hematin; H(aq) – hematin; β(s) - β-hematin; zobs – rate constant for the formation of β(s). (ii) D(aq) – drug; DS – drug-surface adsorption complex; Kads – adsorption equilibrium constant. (iii) DH(s) – precipitated drug-hematin complex; k2 – rate constant for the formation of DH(s). (b) A schematic illustration of the formation of a drug monolayer on the surface of a β-hematin crystal by adsorption to binding sites on the growth face. Readers are directed to figures 11 and 12 in a review by Weissbuch and Leiserowitz for a detailed model showing how quinoline antimalarial compounds can dock into grooves on the fastest growing (001) face of β-hematin.40
As before, in addition to the precipitation of hematin as crystalline β-hematin, the presence of an inhibiting drug may also promote a competing process that results in the irreversible precipitation of hematin, possibly as its drug complex. Indeed, the experimental kinetics show that such a process is required to fully account for the observations. While the details of this process have not been studied, we have found that a satisfactory agreement with experiment was achieved using the simple mechanistic model included in Scheme 2. According to this mechanism, the rate of precipitation of hematin is given by eq. 4:
| (4) |
where DH(s) is the drug-hematin precipitate, k2 is is the rate constant for the irreversible precipitation of hematin brought about by interaction with the drug, [D] and [H(aq)] are the respective concentrations of drug and hematin in solution, and m ≥ 0. Empirically, the best-fit of the data was found when m = 2, and this value is used in all of the remaining discussion. Ignoring the adsorption of drug to β-hematin, and assuming [D] ≫ [H(aq)], leads to an equation describing the percentage yield of β-hematin, % β(s), as a function of time, which is dependent on the rates of both competing reactions (eq. 5):
| (5) |
Combining eq. 3 and eq. 5, to take account of both kinetic inhibition through drug adsorption on the crystal surface and competing drug-induced precipitation of hematin, affords eq. 6:
| (6) |
Based on this model, it is possible to predict the kinetics of β-hematin formation in the absence and presence of an inhibiting drug. As shown in Figure 4a, the model predicts adherence to an exponential kinetic equation. Furthermore, it is notable that at low drug concentrations, the final yield of β-hematin remains almost constant, however as the dose is increased further, the final yield is shown to decrease. According to the adsorption model based on the Langmuir isotherm, a plot of the inverse of the observed rate constant as a function of drug concentration is predicted to be linear at low concentrations of drug (Figure 4b). Linear regression in this region should allow the adsorption equilibrium constant, Kads, as well as the rate constant in the absence of an inhibitor, z, to be determined. It is also possible to predict the dose-response behavior from the kinetic profiles by examining expected yields at single time points as a function of drug concentration. As shown in Figure 4c, the model gives rise to a sigmoidal dose-response curve, although this is more evident at longer incubation times. At short incubation times on the other hand, the dose-response profile tends towards a hyperbolic function. The model predicts a strong dependence of IC50 on incubation time at short times. However, at long incubation times, the individual dose-response curves are predicted to converge, with very little change in the expected IC50 value with further increase in incubation time, leading to a hyperbolic dependence of IC50 on time (Figure 4d). This behavior would not occur in the absence of the drug-induced irreversible precipitation of hematin.
Figure 4.
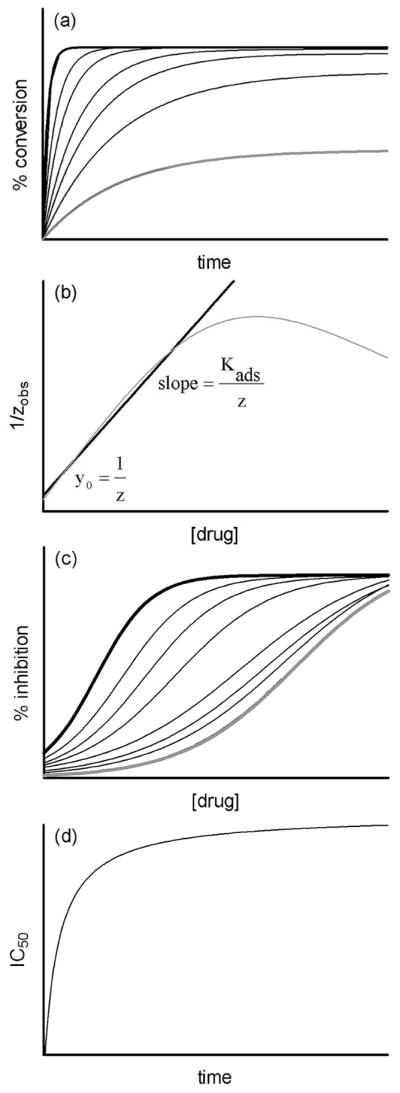
(a) The kinetics of β-hematin formation as predicted by eq. 6. Curves are for drug concentrations ranging from 0 (black line) through increasing doses, to a relatively high final value (grey line). (b) The predicted behavior of the observed rate constant, plotted as its inverse (grey line), as function of drug concentration. Linear regression at relatively low concentrations of drug (black line) permits determination of the rate constant in the absence of drug (z) from the intercept and the adsorption equilibrium constant (Kads) from the slope. (c) The best-fit of the numerical output generated at different times from the theoretical model (eq. 6) yields sigmoidal dose-response curves. At long incubation times, the curves converge on a single IC50 value (grey line). (d) A numerical prediction of the change in IC50 value as a function of time based on the treatment of theoretical outputs in (c). The behavior conforms to a hyperbolic function.
3.3 Observed kinetic behavior in the presence of chloroquine and quinidine
The rapid rate at which β-hematin forms in lipid-water mixtures compared to 4.5 M acetate has made it possible to investigate the kinetics of this process in detail in the presence of different antimalarial drugs. As representatives of the 4-aminoquinoline and quinoline methanol classes of antimalarials, we chose to study the kinetic effects of CQ and QD, respectively. The data obtained for CQ were initially fitted to a simple exponential kinetic equation in order to determine the observed rate constants. The linear regression shown in Figure 5a confirms that the rate constants obtained for concentrations of CQ ≤ 0.03 × 10⁻³ M conform to the proposed model based on the Langmuir isotherm. Based on this plot, the observed rate constant in the absence of CQ, z, is 0.19 ± 0.02 min−1, while Kads is 3.55 ± 0.06 × 10⁵ M−1. Interestingly, the log Kads value of 5.55 ± 0.03 for the association of CQ with the surface of β-hematin is comparable to the association constant of CQ with free hematin in 40% (v/v) aqueous DMSO (log K = 5.52 ± 0.03).41 The kinetics data were subsequently fitted to a slightly modified version of eq. 6 in which an adjustable term, Y, was introduced on the right hand side of the equation to account for the fact that a 100% yield of β-hematin is never observed with MPG, even in the absence of drug.12 Y thus represents the fraction of the total theoretical yield that is actually attained at any given drug concentration. It has previously been shown that in the absence of an inhibitor, MPG is capable of mediating β-hematin with approximately 70% efficiency.12 However, obtaining identical lipid emulsion conditions is difficult in practice, and therefore this value exhibits a considerable degree of random variability. In the absence of drug, we found the value of Y to be 0.71 ± 0.03, and therefore we allowed this parameter to refine freely within three standard deviations of this value for all other experiments (i.e. between values of 0.62 and 0.80). For the purposes of fitting, the values of Kads and z were constrained to the values obtained from the linear regression analysis, while the values for [D] were defined by each individual experiment. Since the competition reaction that results in the precipitation of hematin rather than β-hematin is poorly understood, an accurate value of k2 could not be determined independently. However, the values of k2 and Y are correlated. Since experiment permitted us to select a sensible range of values for Y, we could in turn determine a range of values for k2. The best fit value for k2 fell in the range between 0.3 and 0.6 and a value of 0.45 was used to generate the best fits of the experimental kinetic data shown in Figure 5b. The resultant r2 values range between 0.74 and 0.96 and indicate good agreement between experiment and the proposed kinetic model in view of the size of the data scatter. In the case where the drug concentration is 0.1 × 10⁻³ M, there is considerably more noise in the data compared to lower concentrations, possibly due to interactions of the drug with the lipid, and the best fit r2 value is just 0.45. In practice, owing to fairly large scatter in the experimental data and non-identical incubation times for different CQ concentrations, extracting the dose-response profiles from the kinetic experiments was not feasible. However, as an example, a sufficient set of data was available for analysis at 30 min and a reasonable fit was observed. This demonstrates that the experimental kinetics do in fact generate a sigmoidal dose-response curve (Figure 5c). The resultant IC50 value (0.019 ± 0.005 × 10⁻³ M) is within one standard deviation of the value determined in an independent dose response experiment (0.017 ± 0.001 × 10⁻³ M). In order to investigate the dependency of the IC50 value on time, we proceeded to measure the IC50 values independently for a series of incubation times. The IC50 value increases markedly over relatively short incubation times, and eventually converges on a value of approximately 0.045 × 10⁻³ M at incubation times greater than 500 minutes as predicted by the model. Indeed, the IC50 data can be fitted to a simple hyperbola, in accordance with the theoretical model (Figure 5d).
Figure 5.
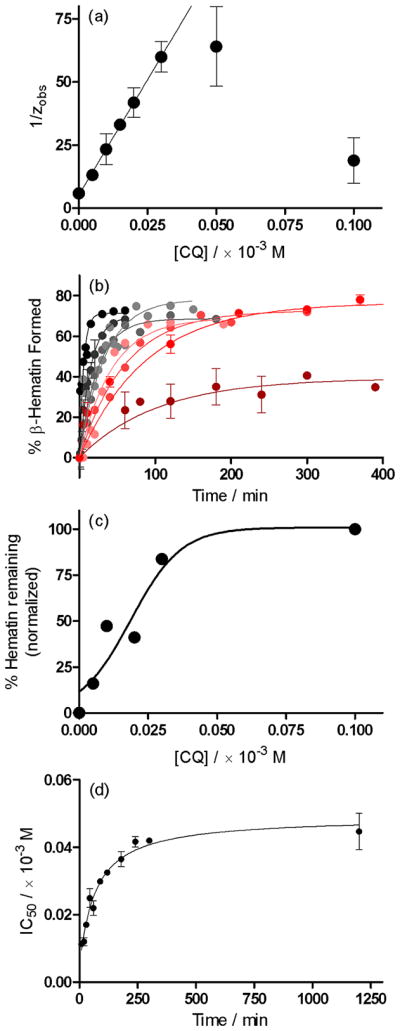
The kinetics of β-hematin formation in the presence of chloroquine, CQ. (a) In accordance with a model based on the Langmuir isotherm, a plot of 1/zobs as a function of increasing drug concentration yields a linear correlation up to a concentration of 0.03 × 10⁻³ M. Linear regression in this region yields an intercept value of 5.15 ± 0.51 min and a slope value of 1829 ± 31 × 103 minM−1. From these values, the parameters z and Kads were calculated to be 0.19 ± 0.02 min−1 and 3.55 ± 0.06 × 10⁵ M−1, respectively. (b) Reaction kinetics fitted to the theoretical model (eq. 6) in the absence (●) and presence of (
 ) 0.005, (
 ) 0.01, (
 ) 0.015, (
 ) 0.02, (
 ) 0.03, (
 ) 0.05 and (
 ) 0.1 × 10⁻³ M CQ. (c) A slice through the kinetics traces at incubation time of 30 minutes yields a dose-response profile. The data have been fitted to a sigmoidal function (r2 = 0.90). (d) The dependence of IC50 for the inhibition of β-hematin formation by CQ on incubation time follows a hyperbolic function.
The effects of QD on the kinetics of β-hematin formation were found to be similar to those of CQ. Linear regression shows that the observed rate constants change with increasing drug concentration in accordance with the model based on the Langmuir isotherm, albeit only up to concentrations of approximately 0.05 × 10⁻³ M (Figure 6a). The value for z of 0.17 ± 0.01 min−1 is identical to that observed for CQ, as indeed it should be given that it is independent of drug. However, compared to CQ, a significantly smaller value for Kads was determined (8.36 ± 0.06 × 10⁴ M−1; log Kads = 4.92 ± 0.01). In the subsequent fitting of the kinetics data to the theoretical model, the same considerations for Y as discussed above were taken into account. Consequently, k2 was found to lie between 0.2 and 0.9, a slightly wider range compared to CQ. A mid-range value of 0.55 was used for the best fits of the experimental kinetic data shown in Figure 6b. A slice through of the kinetics traces at 30 minutes yields the dose response curve in Figure 6c, which could be fitted to a sigmoidal function (r2 = 0.97). As predicted by the model, the experimental IC50 values do not increase linearly with time. Instead, as seen for CQ, they increase markedly over relatively short periods of time and eventually converge on a value of approximately 0.15 × 10⁻³ M at incubation times greater than approximately 300 minutes (Figure 6d).
Figure 6.
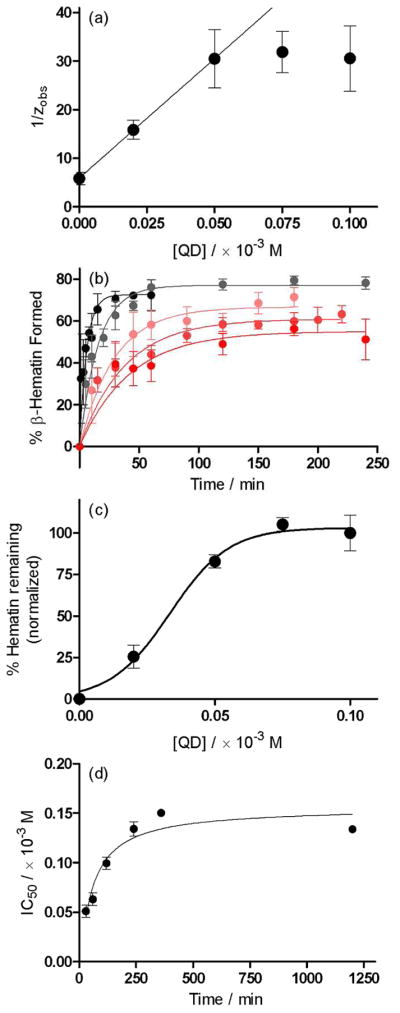
The kinetics of β-hematin formation in the presence of quinidine, QD. (a) In accordance with the model based on the Langmuir isotherm, a plot of 1/zobs as a function of increasing drug concentration yields a linear correlation up to a concentration of 0.05 × 10⁻³ M. Linear regression in this region yields an intercept value of 5.92 ± 0.12 min and a slope value of 492 ± 4 × 10³ minM−1. From these values, the parameters z and Kads were determined to be 0.17 ± 0.01 min−1 and 8.36 ± 0.06 × 10⁴ M−1, respectively. (b) Reaction kinetics fitted to the theoretical model (eq. 6) in the absence (●) and presence of (
) 0.02, (
) 0.05, (
) 0.075 and (
) 0.1 × 10⁻³ M QD. (c) A slice through the kinetics traces at incubation time of 30 minutes yields a dose-response profile, which was fitted to a sigmoidal function (dashed line, r2 = 0.99). (d) The dependence of IC50 for the inhibition of β-hematin formation by QD on incubation time follows a hyperbolic function.
3.4 Correlation of IC50 values for β-hematin inhibition and biological activity
The dose-response curves for the inhibition of β-hematin formation by CQ, amodiaquine (AQ), QD and quinine (QN) in the lipid emulsion model system after 30 min incubation were determined in independent experiments. The IC50 values show linear correlations with in vitro IC50 determinations reported against CQ-sensitive (3D7 and HB3) and CQ-resistant (K1 and PH3) strains of P. falciparum (Figure 7).42 In the correlation against CQ-resistant strains, the data point for CQ has been excluded since there is no means in the model system to account for the CQ-resistance mechanism, namely selective and specific extrusion of CQ from the digestive vacuole by the P. falciparum CQ resistance transporter (PfCRT). The statistical significance of the correlations is good, with r2 values of 0.92 and 0.96 respectively, against the CQ-sensitive and CQ-resistant strains. An interesting observation is the differing slopes obtained for the two correlations. The deviation from zero in each case is significant as indicated by a P value < 0.05, however the slope is steeper in the case of the CQ-resistant correlation (slope = 0.92 ± 0.10) compared to the CQ-sensitive correlation (slope = 0.37 ± 0.04).
Figure 7.

Inhibition of β-hematin formation by antimalarial drugs in lipid-water (LW) emulsions. Correlation of the IC50 values obtained after 30 min incubation with biological activity against CQ-sensitive strains (3D7 (●) and HB3 (
 ), solid line) and CQ-resistant strains (PH3 (○) and K1 (□), dashed line). The r2 values are 0.92 and 0.97, respectively, for the CQ-sensitive and - resistant strains. The data points indicating the very poor activity of CQ against the CQ-resistant strains are shown, however they have not been included in the linear regression analyses. The slope value for the CQ-resistant strains (0.92 ± 0.10) is different to that for the CQ-sensitive strains (0.37 ± 0.04).
4. Discussion
The publication of the structure of β-hematin in 2000 unequivocally dispelled the long-standing belief that the crystalline material was simply a coordination polymer of Fe(III)PPIX molecules. However, the authors admit to the limitations of the PXRD technique when applied to such a large organic molecule (43 non-hydrogen atoms).4 On the other hand, despite having been crystallized as its DMSO solvate, the SCD structure of β-hematin determined in the current work provides conclusive insight into the molecular structure of this crystalline material. First and foremost, the μ-propionato coordination dimer of Fe(III)PPIX is confirmed as the repeating unit in the crystal structure. The porphyrin planes are laterally shifted in two dimensions relative to one another, resulting in an intra-dimer Fe-Fe distance of 8.982 Å. This compares favorably to an intra-dimer distance of 9.047 Å reported for β-hematin.4 We have been able to demonstrate that the geometries of the porphyrin cores within the dimer determined by SCD and PXRD are in very good agreement. In each of the five-coordinate species, the metal center resides 0.42 and 0.47 Å, respectively, out of the mean porphyrin plane, while the Fe(III)-O bond lengths in the two structures are 1.891(2) and 1.886(2) Å, respectively. The remainder of the bond and torsion angles around each of the Fe(III) centers are consistent with other high-spin five-coordinate species. Interestingly, in the absence of a SCD structure of β-hematin, various analogues have been investigated as model compounds. Most recently, the SCD structure of the gallium(III) protoporphyrin IX analogue of β-hematin was determined.43 While the repeating unit was shown to be a μ-propionato dimer, this compound exhibits numerous differences when compared to the DMSO solvate of β-hematin determined in the current work. In the first instance, the diamagnetic Ga(III) center is six-coordinate, which results in the metal center residing only 0.031 Å out of the mean porphyrin plane. The metal-O coordination bond is also considerably longer at 2.010(2) Å. Within each dimer, the two porphyrin cores show a lateral shift in essentially one direction only, with very little offset (0.63 Å) in the second direction. This is a direct consequence of an intramolecular hydrogen bond which is present between the free propionic acid and the coordinated propionate group of each porphyrin.
The molecule of Fe(III)PPIX has enantio-facial symmetry and consequently, isomers of the μ-propionato dimer can form. In a previous study on β-hematin, four isomers have been proposed to be of relevance.44 These consist of two achiral centrosymmetric dimers, which have been termed cd1̄1 and cd1̄2, and two chiral non-centrosymmetric enantiomers termed cd2(+) and cd2(−) (Supporting information, Figure S4). In these four isomers, the vinyl substituents are located at the α/γ, β/δ, α/δ and β/γ positions, respectively. It has been proposed that β-hematin consists of two phases, with the cd1̄1 isomer constituting the major phase and the cd1̄2 isomer constituting the minor phase, with a small component of the cd2(−) and cd2(+) isomers included in each phase and giving rise to disorder. An alternative hypothesis has also been proposed in which there is a single phase with disorder arising from the presence of all four isomers.45 In the β-hematin DMSO solvate, which is not necessarily directly comparable to β-hematin, there does not appear to be a single major phase. Rather, the single crystal selected for analysis displays a disordered structure. The observed α, β, γ, δ site occupancies of 0.66, 0.34, 0.66 and 0.34 respectively, can be accounted for by a model consisting of various ratios of the four isomers ranging from 0.67 cd1̄1 and 0.33 cd1̄2 (with no contribution from either cd2(−) or cd2(+)) to 0.33 cd1̄1 and 0.33 each of cd2(−) and cd2(+). Whatever ratio is considered, the contributions from each of cd2(−) and cd2(+) must be equal in order to ensure that the overall structure remains centrosymmetric.
In the SCD structure of the β-hematin DMSO solvate, the free propionic acid group of each molecule of Fe(III)PPIX forms an intermolecular hydrogen bond to an included molecule of DMSO. Bohle and co-workers have reported this same interaction in the PXRD structure of the Fe(III) mesoporphyrin IX analogue of β-hematin, prepared from a DMSO solution containing 2,6-lutidine.46 An interesting observation is that the structures of β-hematin4 and Hz,29 both of which were solved from PXRD data by means of Rietveld refinement (and maximum-entropy based fitting in the case of Hz), do not contain included solvent molecules. Rather in these structures, the carboxylic acid moieties of adjacent dimers hydrogen bond directly to one another to form the carboxylic acid dimer, a common supramolecular homosynthon.47 Following an extensive survey of the CSD, Zaworotko and co-workers have reported that this particular homosynthon is present in as many as 93% of structures in which no other hydrogen bonding partner (donor or acceptor) is present. However, the carboxylic acid dimer is present in only 31% of all structures that contain at least one carboxylic acid functional group, indicating that heterosynthons are more favorable. Complimentary hydrogen bonding moieties include alcohols, primary amides and carbonyl and sulfoxide groups. The heterosynthon present in the DMSO solvate of β-hematin determined in the current work is an example of the latter. It has previously been shown that dehydrated β-hematin is able to absorb up to 14% (m/m) water, corresponding to a mol ratio of 4.78 water molecules per molecule of Fe(III)PPIX.48 The process occurs readily at room temperature, with more crystalline samples having a greater capacity for uptake compared to more amorphous samples. PXRD demonstrated that samples become more ordered following hydration, which strongly suggests that water molecules may be present in Hz/β-hematin. An intriguing possibility therefore arose that DMSO might be able to be exchanged for water. However, all attempts to exchange the DMSO for either water or methanol have not been successful to date.
Non-coordinating bases such as 2,6-lutidine have been used in the synthesis of β-hematin49,50 and related analogues.46 Their role is to deprotonate one of the porphyrin propionic acid groups in order to yield a propionate ligand which subsequently coordinates to the iron(III) center of a second Fe(III)PPIX molecule. Samples resulting from these studies, while crystalline, have not been suitable for SCD, and have rather been investigated by PXRD. In the current study, it is at first sight difficult to imagine how the inclusion of CQ, a known inhibitor of β-hematin formation,15 would have led to the formation of single crystals of the β-hematin DMSO solvate. Rather, it would at first seem reasonable to infer that in the absence of any other base, the CQ free base that was included in the crystallization medium acted simply as a base. However, the kinetic effect of CQ on the rate of β-hematin formation which has been previously demonstrated in aqueous acetate medium,25,26 and further explored in a biomimetic lipid-water emulsion system in this study, suggests that CQ, in addition to acting as a base, may have also acted kinetically in the crystallization experiment to slow the rate of formation of product, thereby affording single crystals of the β-hematin DMSO solvate.
With the increased attention that lipids have received in the last five years for their suspected role in mediating Hz and β-hematin formation,8,11 we elected to investigate the effects of quinoline antimalarial drugs on the process of β-hematin formation in lipid-water emulsions. Studies using synthetic neutral lipid droplets have demonstrated that Fe(III)PPIX readily accumulates inside these droplets.51 We have been able to confirm that low concentrations of CQ and QD do indeed decrease the rate of β-hematin formation under biomimetic (lipid) conditions. However, at higher drug concentrations a decreased final yield of β-hematin was observed. Antimalarial drugs are known to interact with Fe(III)PPIX in solution41 and in the solid state,22,23 and therefore a competing process that results in the irreversible precipitation of Fe(III)PPIX, probably as its drug complex, was postulated in this study to account for the observations at high drug concentration. We have developed a simple model to explain these phenomena, as well as the exponential shape of the kinetics in the presence of lipid. The best-fit to the experimental data was achieved by considering the process to be second order with respect to drug, however this does not necessarily imply that the drug-Fe(III)PIX complex has a 2:1 stoichiometry. We have not investigated the nature of the quinoline-Fe(III)PPIX complexes in any detail since it is reasonable to propose that the kinetic effect of the drugs, both at lower concentrations and shorter incubation times, is of greater biological relevance. In the presence of low concentrations of drug, the decreased rates of β-hematin formation were attributed to the non-covalent adsorption of drug molecules to the fastest-growing face of the crystals and modeled using the Langmuir isotherm. Under the experimental conditions of the lipid-water emulsions used, the model predicts an adsorption equilibrium constant, Kads, for CQ that is approximately 4 times greater than that of QD. Interestingly, Leiserowitz and co-workers have previously shown that shorter porphyrin-drug contact distances in binding sites on the (001) face of β-hematin are theoretically possible for singly-protonated CQ compared to QD.18 They suggest that that the longer, more flexible side chain in CQ permits a stronger charge-assisted association between the tertiary ammonium group of the drug and the free carboxylate group of β-hematin. This would account for the observations in the current study, and suggests that the kinetic approach herein may provide a basis for furthering our understanding of the β-hematin inhibition process. Certainly, the linear correlations observed between the biological activities of CQ, AQ, QN and QD against CQ-sensitive strains of P. falciparum and the IC50 values determined at 30 min would indicate that the lipid emulsions provide a valid system in which to investigate drug activity.
5. Conclusion
With no counterpart in the human host, Hz crystals and the process by which they are formed remain valid targets for antimalarial drug development. The β-hematin DMSO solvate reported herein is the first Fe(III)PPIX model of Hz to have been studied by SCD, and therefore provides the most accurate structural insight to date. Taken together with the kinetics results which show that quinoline antimalarial drugs decrease the rate of β-hematin formation in lipid-water emulsions, the data strongly support a mechanism of antimalarial drug action by adsorption to the growing face of Hz. It is imperative that we test this theory by investigating the kinetic effects of other quinoline compounds, and this is currently underway in our laboratories. In the meantime, independent measurement of the drug adsorption process should be possible, and remains an important objective for future investigations, since kinetics alone cannot conclusively elucidate the mechanism of a chemical process. On the other hand, since it has been possible to predict the face of β-hematin that would most likely support drug adsorption,18 it should also be possible to compute the attachment energies for the different faces of the DMSO solvate crystals, and hence use their structure as a model in the rational design of novel probes for controlling the crystallization process. Finally, the speciation of Fe(III)PPIX in solution prior to crystallization remains of interest. Determining the nucleating species of Hz may yet present an alternative drug target, or least a means for further probing the influence, kinetic or otherwise, of novel antimalarial compounds.
Supplementary Material
Acknowledgments
This material is based upon work supported by the National Research Foundation (NRF) Thuthuka Programme (KdV, Grant no. 76320 and TlR, Grant no. 69103), Stellenbosch University (KdV and TlR) and the National Institutes of Health (TJE, Grant 5R01AI083145). JG also acknowledges the NRF for bursary support.
Footnotes
Supporting Information Available: 1. Experimental details for crystallography work. Table S1 provides hydrogen bond geometry, while Table S2 provides a comparison of crystal data, experimental and refinement parameters between the β-hematin DMSO solvate and β-hematin. Figure S1 shows an infra-red spectrum of the bulk material; Figure S2 and S3 provide additional views of structural comparisons between the β-hematin DMSO solvate and β-hematin; Figure 4 shows the four β-hematin isomers in schematic form. 2. A detailed description of the kinetic model and its derivation. This material is available free of charge via the Internet at http://pubs.acs.org.
References
- 1.Fitch CD, Chevli R, Banyal HS, Phillips G, Pfaller MA, Krogstad DJ. Antimicrob Agents Chemother. 1982;21:819–822. doi: 10.1128/aac.21.5.819. [DOI] [PMC free article] [PubMed] [Google Scholar]
- 2.Egan TJ, Combrink JM, Egan J, Hearne GR, Marques HM, Ntenteni S, Sewell BT, Smith PJ, Taylor D, van Schalkwyk DA, Walden JC. Biochem J. 2002;365:343–347. doi: 10.1042/BJ20020793. [DOI] [PMC free article] [PubMed] [Google Scholar]
- 3.The authors in Bellemare MJ, Bohle DS, Brosseau CN, Georges E, Godbout M, Kelly J, Leimanis ML, Leonelli R, Olivier M, Smilkstein MJ. J Phys Chem B. 2009;113:8391–8401. doi: 10.1021/jp8104375. have suggested the term “hematin anhydride” as an alternative to β-hematin
- 4.Pagola S, Stephens PW, Bohle DS, Kosar AD, Madsen SK. Nature. 2000;404:307–310. doi: 10.1038/35005132. [DOI] [PubMed] [Google Scholar]
- 5.Sullivan DJJ, Gluzman IY, Goldberg DE. Science. 1996;271:219–222. doi: 10.1126/science.271.5246.219. [DOI] [PubMed] [Google Scholar]
- 6.Papalexis V, Siomos MA, Campanale N, Guo XG, Kocak G, Foley M, Tilley L. Mol Biochem Parasitol. 2001;115:77–86. doi: 10.1016/s0166-6851(01)00271-7. [DOI] [PubMed] [Google Scholar]
- 7.Jani D, Nagarkatti R, Beatty W, Angel R, Slebodnick C, Andersen J, Kumar S, Rathore D. PLoS Pathog. 2008;4:e1000053. doi: 10.1371/journal.ppat.1000053. [DOI] [PMC free article] [PubMed] [Google Scholar]
- 8.Pisciotta JM, Coppens I, Tripathi AK, Scholl PF, Shuman J, Bajad S, Shulaev V, Sullivan DJJ. Biochem J. 2007;402:197–204. doi: 10.1042/BJ20060986. [DOI] [PMC free article] [PubMed] [Google Scholar]
- 9.Kapishnikov S, Berthing T, Hviid L, Dierolf M, Menzel A, Pfeiffer F, Als-Nielsen J, Leiserowitz L. Proc Natl Acad Sci. 2012;109:11184–11187. doi: 10.1073/pnas.1118134109. [DOI] [PMC free article] [PubMed] [Google Scholar]
- 10.Kapishnikov S, Weiner A, Shimoni E, Guttmann P, Schneider G, Dahan-Pasternak N, Dzikowski R, Leiserowitz L, Elbaum M. Proc Natl Acad Sci. 2012;109:11188–11193. doi: 10.1073/pnas.1118120109. [DOI] [PMC free article] [PubMed] [Google Scholar]
- 11.Egan TJ, Chen JYJ, de Villiers KA, Mabotha TE, Naidoo KJ, Ncokazi KK, Langford SJ, McNaughton D, Pandiancherri S, Wood BR. FEBS Lett. 2006;580:5105–5110. doi: 10.1016/j.febslet.2006.08.043. [DOI] [PubMed] [Google Scholar]
- 12.Hoang AN, Ncokazi KK, De Villiers KA, Wright DW, Egan TJ. Dalton Trans. 2010;39:1235–1244. doi: 10.1039/b914359a. [DOI] [PMC free article] [PubMed] [Google Scholar]
- 13.Pasternack RF, Munda B, Bickford A, Gibbs EJ, Scolaro LM. J Inorg Biochem. 2010;104:1119–1124. doi: 10.1016/j.jinorgbio.2010.07.001. [DOI] [PubMed] [Google Scholar]
- 14.Slater AFG, Cerami A. Nature. 1992;355:167–169. doi: 10.1038/355167a0. [DOI] [PubMed] [Google Scholar]
- 15.Egan TJ, Ross DC, Adams PA. FEBS Lett. 1994;352:54–57. doi: 10.1016/0014-5793(94)00921-x. [DOI] [PubMed] [Google Scholar]
- 16.Dorn A, Vippagunta SR, Matile H, Jaquet C, Vennerstrom JL, Ridley RG. Biochem Pharmacol. 1998;55:727–736. doi: 10.1016/s0006-2952(97)00510-8. [DOI] [PubMed] [Google Scholar]
- 17.Sullivan DJJ, Gluzman IY, Russel DG, Goldberg DE. Proc Natl Acad Sci USA. 1996;93:11865–11870. doi: 10.1073/pnas.93.21.11865. [DOI] [PMC free article] [PubMed] [Google Scholar]
- 18.Buller R, Peterson ML, Almarsson Ö, Leiserowitz L. Cryst Growth Des. 2002;2:553–562. [Google Scholar]
- 19.Cohen SN, Phifer KO, Yielding KL. Nature. 1964;202:805–806. doi: 10.1038/202805a0. [DOI] [PubMed] [Google Scholar]
- 20.Chou AC, Chevli R, Fitch CD. Biochemistry. 1980;19:1543–1549. doi: 10.1021/bi00549a600. [DOI] [PubMed] [Google Scholar]
- 21.Egan TJ. J Inorg Biochem. 2006;100:916–926. doi: 10.1016/j.jinorgbio.2005.11.005. [DOI] [PubMed] [Google Scholar]
- 22.de Villiers KA, Marques HM, Egan TJ. J Inorg Biochem. 2008;102:1660–1667. doi: 10.1016/j.jinorgbio.2008.04.001. [DOI] [PubMed] [Google Scholar]
- 23.de Villiers KA, Gildenhuys J, le Roex T. ACS Chem Biol. 2012;7:666–671. doi: 10.1021/cb200528z. [DOI] [PubMed] [Google Scholar]
- 24.Kaschula CH, Egan TJ, Hunter R, Basilico N, Parapini S, Taramelli D, Pasini E, Monti D. J Med Chem. 2002;45:3531–3539. doi: 10.1021/jm020858u. [DOI] [PubMed] [Google Scholar]
- 25.Chong CR, Sullivan DJJ. Biochem Pharmacol. 2003;66:2201–2212. doi: 10.1016/j.bcp.2003.08.009. [DOI] [PubMed] [Google Scholar]
- 26.Egan TJ, Ncokazi KK. J Inorg Biochem. 2005;99:1532–1539. doi: 10.1016/j.jinorgbio.2005.04.013. [DOI] [PubMed] [Google Scholar]
- 27.Ncokazi KK, Egan TJ. Anal Biochem. 2005;338:306–319. doi: 10.1016/j.ab.2004.11.022. [DOI] [PubMed] [Google Scholar]
- 28.GraphPad Prism 5. 5.0.2. GraphPad Software, Inc; San Diego, CA: 2008. [Google Scholar]
- 29.Klonis N, Dilanian R, Hanssen E, Darmanin C, Streltsov V, Deed S, Quiney H, Tilley L. Biochemistry. 2010;49:6804–6811. doi: 10.1021/bi100567j. [DOI] [PubMed] [Google Scholar]
- 30.Slater AFG, Swiggard WJ, Orton BR, Flitter WD, Goldberg DE, Cerami A, Henderson GB. Proc Natl Acad Sci USA. 1991;88:325–329. doi: 10.1073/pnas.88.2.325. [DOI] [PMC free article] [PubMed] [Google Scholar]
- 31.Egan TJ, Mavuso WW, Ncokazi KK. Biochemistry. 2001;40:204–213. doi: 10.1021/bi0013501. [DOI] [PubMed] [Google Scholar]
- 32.Nie B, Stutzman J, Xie A. Biophys J. 2005;88:2833–2847. doi: 10.1529/biophysj.104.047639. [DOI] [PMC free article] [PubMed] [Google Scholar]
- 33.Bohle DS, Kosar AD, Stephens PW. Acta Cryst. 2002;D58:1752–1756. doi: 10.1107/s0907444902014294. [DOI] [PubMed] [Google Scholar]
- 34.Solomonov I, Osipova M, Feldman Y, Baehtz C, Kjaer K, Robinson IK, Webster GT, McNaughton D, Wood BR, Weissbuch I, Leiserowitz L. J Am Chem Soc. 2007;129:2615–2627. doi: 10.1021/ja0674183. [DOI] [PubMed] [Google Scholar]
- 35.Barbour LJ. J Supramol Chem. 2001;1:189–191. [Google Scholar]
- 36.V S26. Cambridge Crystallographic Data Centre; Cambridge: 2004. [Google Scholar]
- 37.Avrami M. J Chem Phys. 1939;7:1103–1112. [Google Scholar]
- 38.Avrami M. J Chem Phys. 1940;8:212–224. [Google Scholar]
- 39.Langmuir I. J Am Chem Soc. 1916;38:2221–2295. [Google Scholar]
- 40.Weissbuch I, Leiserowitz L. Chem Rev. 2008;108:4899–4914. doi: 10.1021/cr078274t. [DOI] [PubMed] [Google Scholar]
- 41.Egan TJ, Mavuso WW, Ross DC, Marques HM. J Inorg Biochem. 1997;68:137–145. doi: 10.1016/s0162-0134(97)00086-x. [DOI] [PubMed] [Google Scholar]
- 42.Hawley SR, Bray PG, Mungthin M, Atkinson JD, O’Neill PM, Ward SA. Antimicrob Agents Chemother. 1998;42:682–686. doi: 10.1128/aac.42.3.682. [DOI] [PMC free article] [PubMed] [Google Scholar]
- 43.Bohle DS, Dodd EL. Inorg Chem. 2012;51:4411–4413. doi: 10.1021/ic2027303. [DOI] [PubMed] [Google Scholar]
- 44.Straasø T, Kapishnikov S, Kato K, Takata M, Als-Nielsen J, Leiserowitz L. Cryst Growth Des. 2011;11:3342–3350. [Google Scholar]
- 45.Bohle DS, Dodd EL, Stephens PW. Chem Biodivers. 2012;9:1891–1902. doi: 10.1002/cbdv.201200033. [DOI] [PubMed] [Google Scholar]
- 46.Bohle DS, Dodd EL, Kosar AJ, Sharma L, Stephens PW, Suarez L, Tazoo D. Angew Chem Int Ed. 2011;50:6151–6154. doi: 10.1002/anie.201100910. [DOI] [PubMed] [Google Scholar]
- 47.Shattock TR, Arora KK, Vishweshwar P, Zaworotko MJ. Cryst Growth Des. 2008;8:4533–4545. [Google Scholar]
- 48.Bohle DS, Kosar AJ, Stephens PW. Can J Chem. 2003;81:1285–1291. [Google Scholar]
- 49.Bohle DS, Helms JB. Biochem Biophys Res Commun. 1993;193:504–508. doi: 10.1006/bbrc.1993.1652. [DOI] [PubMed] [Google Scholar]
- 50.Bohle DS, Conklin BJ, Cox D, Madsen SK, Paulsen S, Stephens PW, Yee GT. Am Chem Soc Symp Ser. 1994;572:495–515. [Google Scholar]
- 51.Hoang AN, Sandlin RD, Omar A, Egan TJ, Wright DW. Biochemistry. 2010;49:10107–10116. doi: 10.1021/bi101397u. [DOI] [PMC free article] [PubMed] [Google Scholar]
Associated Data
This section collects any data citations, data availability statements, or supplementary materials included in this article.