Abstract
Statistical approach is a valuable way to describe texture primitives. The aim of this study is to design and implement a classifier framework to automatically identify the thyroid nodules from ultrasound images. Using rigorous mathematical foundations, this article focuses on developing a discriminative texture analysis method based on texture variations corresponding to four biological areas (normal thyroid, thyroid nodule, subcutaneous tissues, and trachea). Our research follows three steps: automatic extraction of the most discriminative first-order statistical texture features, building a classifier that automatically optimizes and selects the valuable features, and correlating significant texture parameters with the four biological areas of interest based on pixel classification and location characteristics. Twenty ultrasound images of normal thyroid and 20 that present thyroid nodules were used. The analysis involves both the whole thyroid ultrasound images and the region of interests (ROIs). The proposed system and the classification results are validated using the receiver operating characteristics which give a better overall view of the classification performance of methods. It is found that the proposed approach is capable of identifying thyroid nodules with a correct classification rate of 83 % when whole image is analyzed and with a percent of 91 % when the ROIs are analyzed.
Keywords: Thyroid ultrasound images, First-order statistical features, T test, CADi software, Pixel classification
Introduction
Today, mathematical models are the routine and essential base for biomedical computing and they are tools in delivering the medical scientific progress. The ultimate goal of the research in the field of biomedical engineering is to develop software methods and computer applications able to be implemented into therapeutic systems.
The thyroid gland is component of the endocrine system and it controls the metabolic process in an organism. The thyroid nodules are a common endocrine disease [1]. Statistical studies show that the incidence of this disease increases with age, extending to more than 50 % of the world's population. However, it has an estimated prevalence of only 4–7 % by palpation [2–6] because the detection of a nodule by palpation depends on its location in the thyroid gland, the patient's neck anatomy, and the experience of the examiner. Moreover, more than 50 % of people with solitary nodules detected by experienced physicians have additional nodules detected by instrumentality of ultrasonography [1, 2, 7, 8].
As Whiest et al. [9] presented only 6.4 % of nodules with less than 0.5 cm in diameter which have been detected by ultrasonography were also detected by physical examination. Improved physical examination detection has been reached for increasingly bigger nodules but still only 48.2 % for nodules larger than 2 cm could be detected.
Currently, various methods for automatic detection and investigation of the thyroid nodules in the ultrasound (US) images were proposed [10–13]. All methods are based on the analysis of an optimal region of interest (ROI) cropped from the US image. Maroulis et al. [14] presented a computer-aided approach for nodule delineation in thyroid ultrasound images based on a novel active contour model, named variable background active contour. This model incorporates the advantages of the level set region-based active contour without edges model, offering noise robustness and the ability to delineate multiple nodules. Keramida et al. [15] proposed a computer-aided diagnosis system prototype, for the detection of nodular tissue in ultrasound thyroid images and videos acquired during thyroid US examinations.
In this study, we propose a novel algorithm for automatic detection of nodules in both the whole thyroid echography images and ROIs containing four biological areas (normal thyroid area, thyroid nodule, subcutaneous areas, and trachea area) based on first-order gray-level statistical features. In a CADi system, the biological object segmentation, feature extraction, and classification are usually followed in this sequence. The main goal of our study is to analyze the effectiveness of investigation when the additional operations as de-noising and segmentation (which is stronger related to manual delineation) are avoided. To reach this goal, our investigation was carried out in two stages:
First, a preliminary analysis using the first-order gray-level statistical features is accomplished for the four biological areas. T test has been used to assess the significance of feature variables and to identify their usefulness to a given predictor. Also, it allows to establish scale values based on the gray intensity of the pixels to differentiate the biological tissues of the thyroid US images.
Application of a novel algorithm for automatic detection and classification of normal and nodular thyroid disease; the textural characteristics of the thyroid tissue and the surrounding tissues are encoded by the mean values of the gray-level intensity as texture features. The advantage of this novel algorithm consists of a very good accuracy in nodule detection through analytical separation between the nodule areas and tissues belonging to normal thyroid tissue, trachea areas, and subcutaneous areas. The interface with adjacent tissues should always be studied.
We considered that the proposed algorithm is simple and it is efficient in terms of running-time. In order to analyze the efficiency of the proposed CADi software, the sensitivity, the specificity, the correct classification rate, and the receiver operating characteristic (ROC) analysis have been utilized. The present paper is organized as follows: “Introduction”; “Materials and Methods”; “Experimental Results and Discussions”; and finally, the concluding remarks are presented.
Materials and Methods
Materials
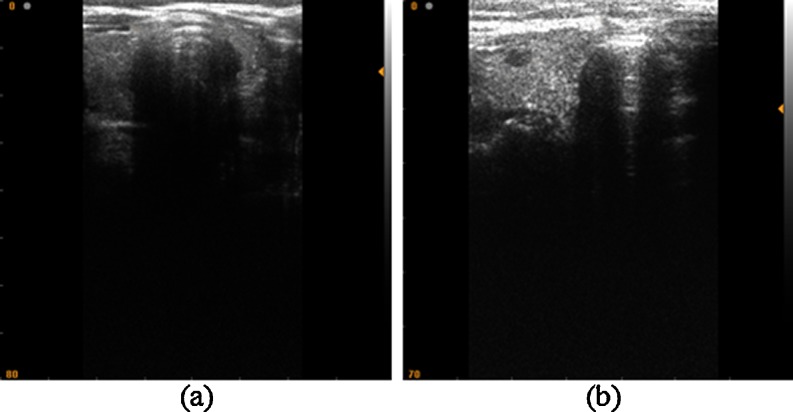
The study comprised 40 patients; each of them has undergone high-resolution US examination of the thyroid gland. Twenty patients presented a normal thyroid and 20 were diagnosed with thyroid nodules through biopsy. Figure 1a, b presents two examples of the acquired images. The images were acquired using an SLE 401 echography medical device and a linear probe with a frequency of 6.5–9 MHz. The US image parameters are bitmap images (size 524 × 512 pixels, 8 bit/pixel). The processing of the experimental US images and developing of CADi application were made using the Matlab software ver. 9a and an Intel Core I3 CPU, 4-GB RAM as hardware platform. The statistical analysis is accomplished using the SPSS ver. 17 software.
Fig. 1.
US image of thyroid gland. a Normal thyroid. b Thyroid nodules
First-Order Statistical Features
First-order statistics are very straightforward but relevant. In this context, the first-order statistical features describe the pixel intensity distribution in digital images. The mean, standard deviation, skewness, kurtosis, energy, and entropy are the most usual first-order statistical features [16–18].
Let M be the image resolution, L the number of gray levels (in our case L = 256), i the current gray level, and h(i) the number of image pixels having the gray intensity value corresponding to the “i” level. The mean parameter μ is a measure of the median intensity of the gray levels of the image:
 |
1 |
A dark image has a small mean value and a light image has a height mean value. The standard deviation of the gray levels σ describes the image contrast by the degree of scattering of gray levels to the mean value:
 |
2 |
A height standard deviation value is specific to height contrast in the image paragraph. The skewness μ1 describes the histogram asymmetry:
 |
3 |
The kurtosis μ2 represents the “sharpness” of the image histogram:
 |
4 |
The energy indicates how the gray levels are distributed:
 |
5 |
The entropy is a measure of the randomness of gray-level distribution.
 |
6 |
Feature Selection and Classification
In the medical research domain, statistical analysis is an important tool to evaluate the medical significance of the outcome of various processing techniques [19]. Theoretically, a complete study of feature selection should be imposed to examine all 2N different combinations of characteristic features (here N is the number of characteristic features). But, this is a huge drawback because a kind of exhaustive study has high computational cost even in case of small number N of features. While a classifier overcomes this drawback by using only certain features as main tool for its final discriminatory performance, the challenge is to find the minimum optimal combination that allows identifying, discriminating, or classifying the malignancy or diseases. Due to the considerable overlap in ultrasonic features between biological objects (as tumors, cyst, nodules, or calcifications) and surrounding tissues, the computer-based classification methods are developed to increase the classification accuracy and stability.
We started our research focused on six first-order statistical features but, as our analysis has shown, a number of them are irrelevant due to their mutual correlations. T test was used to assess the significance of features. In order to maximize the performance of the classifier, it is compulsory to choose the best feature or feature combination. We consider that this type of validation can be proposed as a standard tool when a CADi system is designed as a classifier.
Z and t statistical tests are successfully used to determine differences between two groups [20]. Z test is usually used for large groups with more than 30 subjects. T test is used when the number of subjects is less than 30. During the last years, there was a tendency to replace the Z tests with T tests.
The t value of the T test for independent samples is defined by relation (7), where m1 and m2 represent the mean values of the two independent samples and  (8) is the standard error of the mean difference.
 |
7 |
 |
8 |
where s1 and s2 are the standard deviations of the two samples and n1 and n2 are the number of samples.
The number of degrees of freedom is:
 |
9 |
The decision task consists of comparison of the calculated t value with the values summarized in t tables. More statistical textbooks [20, 21] list the values for t distributions corresponding to an alpha bilateral threshold of significance (commonly set as 0.05), to a specific number of freedom degrees, and to “one-tailed” or “two-tailed” standard normal distributions. Two-tailed corresponds to the salient difference between the means of sample hypothesis without specifying their direction. The one-tailed case specifies the mean direction. If the calculated t value is higher than the value displayed in t table, the null hypothesis (no significant difference between the means of samples) is rejected. So, it is a statistical significant difference between the means of the two groups.
P value is another way to test the statistical hypothesis but under the assumption that the sample comes from an approximately normal distribution. The probability that a random variable X takes a value less than x [22] is defined as:
 |
10 |
where μ and σ are the mean and the standard deviation, respectively. If the associated p value is smaller (p < 0.05 is often used as the threshold), there is evidence that the mean is different from the hypothesized value. If the p value is higher (p > 0.05) then the null hypothesis is not rejected and the mean is not different from the hypothesized value.
CADi Application and Efficiency Analysis
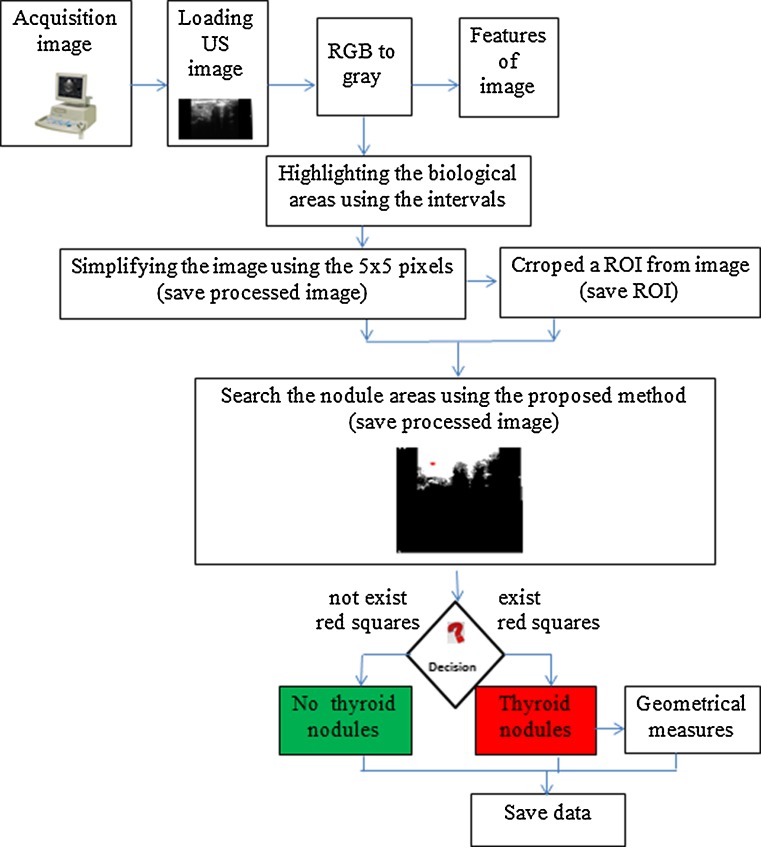
The overall performance of the radiologists' diagnostic in US images is subjective and it is influenced by many factors [23]. In the research literature, many CADi systems are developed to automatically investigate the US images [10–13, 24, 25]. However, most of them require either a training processing that is time-consuming or need supervision from experienced physicians. Based on the proposed algorithm, we developed a new unsupervised, stable, and accurate CADi software application. The flowchart of the proposed method is presented in Fig. 2.
Fig. 2.
Flowchart explaining the steps involved in the CADi algorithm
The characteristic of an effective classification system is its higher diagnosis efficiency. In a binary classification (or two class prediction) problem, the real outcomes can be labeled either as positive (P) or negative (N). In the CADi application, four results are possible: true positive (TP), if the CADi result and the real outcomes are positive; false positive (FP), if the CADi result is positive and the real outcome is negative; true negative (TN), if the CADi result and the real outcomes are negative; and false negative (FN), if the CADi result is negative and the real outcome is positive.
The sensitivity (true positive rate or no false negative rate) of the CADi is defined as the ratio between the number of true positive cases and sum of true positive and false negative cases [26]. The specificity is defined as the ratio between the number of true negative cases and sum of true negative and false positive cases [26].
 |
11 |
 |
12 |
The correct classification rate or accuracy (CCR) is defined as the ratio between the number of correct classified results and the total number of the results [26].
 |
13 |
An ROC is a graphical plot of sensitivity (true positive rate) versus 1-specificity (false positive rate) at different possible cutoff (thresholds) values of the diagnostic test [10, 26]. The points on the ROC curve which are the closest to the left upper coin of ROC space correspond to maximum CADi accuracy. The accuracy is measured by the area under ROC curve: the areas' values from 1 to 0.9 attest an excellent test; 0.9 to 0.8 a good test; 0.8 to 0.7 a fair test; 0.7 to 0.6 a poor test; and 0.6 to 0.5 certify the fail test. It is known that area under ROC curve has a value from 0.5 to 1.0 (where 1.0 represents perfect discrimination task and 0.5 is complete failure).
Experimental Results and Discussions
In order to determine the values of the first-order statistical texture parameters of the chosen areas into the thyroid US images, 20 ROIs from each biological area (normal thyroid tissue, thyroid nodule tissue, subcutaneous tissues, and trachea tissue) were cropped. The values of six first-order statistical features were calculated. Tables 1, 2, 3, and 4 provide some results of textural analysis for each feature set.
Table 1.
Some results of the first-order statistical features corresponding to the subcutaneous areas
| ROIs | Mean | Standard deviation | Skewness | Kurtosis | Energy | Entropy |
|---|---|---|---|---|---|---|
| 1 | 203.40 | 40.04 | −0.63 | −0.51 | 23.61 | 6.96 |
| 2 | 198.80 | 47.77 | −0.52 | −0.91 | 14.59 | 6.93 |
| 3 | 223.30 | 35.78 | −1.15 | 0.36 | 23.26 | 6.03 |
| 4 | 220.70 | 32.44 | −1.03 | 0.55 | 19.14 | 6.29 |
| 5 | 124.00 | 23.28 | −0.08 | −0.35 | 14.76 | 6.50 |
| 6 | 209.10 | 37.80 | −0.77 | −0.13 | 7.20 | 6.63 |
| 7 | 203.60 | 44.87 | −0.80 | −0.44 | 11.01 | 6.91 |
| 8 | 233.20 | 27.52 | −1.57 | 1.64 | 21.00 | 5.54 |
| 9 | 216.10 | 36.49 | −1.00 | 0.06 | 8.55 | 6.36 |
| 10 | 193.60 | 41.02 | −0.38 | −0.95 | 11.61 | 7.10 |
Table 2.
Some results of the first-order statistical features corresponding to the normal thyroid
| ROIs | Mean | Standard deviation | Skewness | Kurtosis | Energy | Entropy |
|---|---|---|---|---|---|---|
| 1 | 108.85 | 23.46 | 0.75 | 0.50 | 31.13 | 6.46 |
| 2 | 98.93 | 29.82 | 1.08 | 1.24 | 25.54 | 6.72 |
| 3 | 96.00 | 24.98 | 0.44 | −0.17 | 35.00 | 6.61 |
| 4 | 109.72 | 21.75 | 0.40 | 0.71 | 33.67 | 6.40 |
| 5 | 96.64 | 29.24 | 1.93 | 5.13 | 22.28 | 6.46 |
| 6 | 95.03 | 25.60 | 0.46 | 0.59 | 39.72 | 6.65 |
| 7 | 102.92 | 24.71 | 0.71 | 0.53 | 34.67 | 6.55 |
| 8 | 97.20 | 23.98 | 0.18 | 0.05 | 27.63 | 6.57 |
| 9 | 76.48 | 19.90 | 0.12 | 0.01 | 33.16 | 6.28 |
| 10 | 87.80 | 21.71 | 0.97 | 2.76 | 24.47 | 6.33 |
Table 3.
Some results of the first-order statistical features corresponding to the thyroid nodules areas
| ROIs | Mean | Standard deviation | Skewness | Kurtosis | Energy | Entropy |
|---|---|---|---|---|---|---|
| 1 | 33.57 | 9.95 | 0.77 | 0.54 | 39.61 | 5.24 |
| 2 | 41.42 | 10.95 | 0.26 | 0.03 | 54.83 | 5.47 |
| 3 | 40.25 | 10.91 | 0.14 | −0.18 | 36.54 | 5.45 |
| 4 | 44.88 | 12.68 | 0.51 | −0.07 | 29.29 | 5.63 |
| 5 | 39.36 | 12.46 | 0.50 | 0.37 | 165.01 | 5.64 |
| 6 | 55.72 | 13.15 | 0.58 | 0.08 | 21.57 | 5.66 |
| 7 | 56.90 | 12.38 | 0.24 | −0.23 | 21.18 | 5.58 |
| 8 | 69.93 | 16.93 | 0.48 | −0.57 | 24.23 | 5.99 |
| 9 | 53.06 | 14.74 | 1.05 | 1.77 | 21.89 | 5.71 |
| 10 | 57.05 | 13.89 | 0.46 | 0.50 | 84.40 | 5.80 |
Table 4.
Some results of the first-order statistical features corresponding to the trachea areas
| ROIs | Mean | Standard deviation | Skewness | Kurtosis | Energy | Entropy |
|---|---|---|---|---|---|---|
| 1 | 5.80 | 1.08 | 0.29 | 0.41 | 324.44 | 2.14 |
| 2 | 4.88 | 0.84 | 0.48 | 1.20 | 748.76 | 1.74 |
| 3 | 6.96 | 0.78 | 0.11 | 1.01 | 1,681.64 | 1.65 |
| 4 | 7.13 | 0.85 | 1.48 | 9.79 | 1,387.05 | 1.66 |
| 5 | 7.20 | 0.74 | 0.10 | −0.28 | 1,037.17 | 1.61 |
| 6 | 3.00 | 0.34 | 0.15 | 8.38 | 1,690.00 | 0.61 |
| 7 | 14.45 | 6.89 | 0.86 | 0.36 | 58.42 | 4.59 |
| 8 | 7.87 | 0.99 | 0.65 | 1.87 | 1,590.77 | 1.99 |
| 9 | 18.59 | 7.17 | 0.62 | 0.12 | 132.62 | 4.77 |
| 10 | 37.71 | 13.59 | 0.90 | 1.55 | 56.96 | 5.66 |
Significant differences of the feature values corresponding to the chosen areas can be observed. The results are in concordance with our expectations and are the key elements for our study.
Due to the correlation between the above six features, an effective feature subset should be selected in order to avoid “dimension disasters” and the features' contribution to tissue class separability in feature space should be investigated [27, 28]. To identify the optimal parameters capable to differentiate between the biological classes, we began by analyzing the vector of the first-order statistical parameters V = [μ, σ, μ1, μ2, Energy, Entropy]. Based on the statistical analysis and according with their ability to discriminate among various tissues, the features were eliminated one by one starting with those having higher p values.
The statistical parameters were labeled as “test variables” and the classes “subcutaneous-normal,” “normal-nodule,” and “nodule-trachea” areas as “grouping variables.” Table 5 presents the p values for each class. The T test results indicate the mean and standard deviation as reliable parameters because they present the significant differences (p < 0.05) of values corresponding to the four classes. As a consequence, the feature vector dimension is reduced to V = [μ, σ].
Table 5.
P values and the first-order statistical parameters corresponding to biological areas
| Subcutaneous-normal thyroid | Normal thyroid-thyroid nodule area | Thyroid nodule area-tracheal tissue | ||||
|---|---|---|---|---|---|---|
| t value | p value | t value | p value | t value | p value | |
| Mean | 10.53 | <0.001 | 11.61 | <0.001 | 8.41 | <0.001 |
| Standard deviation | 4.40 | <0.001 | 11.08 | <0.001 | 6.09 | <0.001 |
| Skewness | −6.95 | <0.001 | 1.27 | 0.223 | −0.63 | 0.536 |
| Kurtosis | −2.1 | 0.056 | 1.61 | 0.133 | −1.91 | 0.086 |
| Energy | −5.9 | <0.001 | −1.39 | 0.197 | −3.73 | 0.006 |
| Entropy | 0.137 | 0.894 | 13.79 | <0.001 | 5.43 | <0.001 |
The next step of this optimization method is to choose the best parameter of the two selected parameters. The maximal t value is used because a large t value indicates a significant capacity to discriminate between the biological classes. In this respect, the standard deviation features are eliminated and the meaningful feature vector is reduced to a unique component V = [μ]. Thus, the mean value has been indicated as an optimal feature for four analyzed biological areas. Further, this statistical feature is used as a criterion to discriminate between healthy and nodular thyroid.
Taking into account all the results, in order to distinguish between the biological tissues of the thyroid, we proposed four intervals based on the mean value of the gray intensity of the pixels (see Fig. 3). Our proposal is to deal with the difficulty created by the choice of boundary values using a feasible and advisable approach: in the case of two neighboring biological areas, the “i” area and the “j” area, the boundary values have been calculated as an arithmetic means of the maximum mean value belonging to i area and the minimum mean value of j area.
Fig. 3.

The proposed discriminative gray intensity interval between thyroid biological areas, based on the mean values
We also found that the thyroid nodule areas have a similar gray-level interval value to the “pre-tracheal” areas. This finding can be a drawback in the automatic diagnosis process of the thyroid nodule areas, but we design a solution to overcome it. Thus, a method based on pixel classification capable of automatically diagnosing the presence or absence of the thyroid nodules in thyroid US images is proposed. The flowchart has already been presented in Fig. 2 and the procedural steps are as follows:
Acquisition of the US thyroid images and importing the experimental images in CADi application; converting the RGB image in gray scale image.
Based on proposed intervals of the mean values of gray intensity, the biological areas are highlighted using a customized mask that allows detecting the real margins (Fig. 4). This preprocessing step is helpful for the complete automation. In this concern, a 5 × 5 mask is used to acquire information of the analyzed tissues and the mean gray intensity inside the mask has been associated to the pixel values belonging to the proposed intervals. Thus, if the resulted gray level of the pixel image value is higher than 77, then the pixel masks are set to 255 (normal thyroid sets to white); the pixel mask, belonging to the nodule areas with mean intensity values between 36 and 77, are set to 125 (nodule area/pre-tracheal areas set to gray); and rest of the pixels corresponding to the trachea area having mean intensity pixel mask less than 36 are set to 0 (black color).
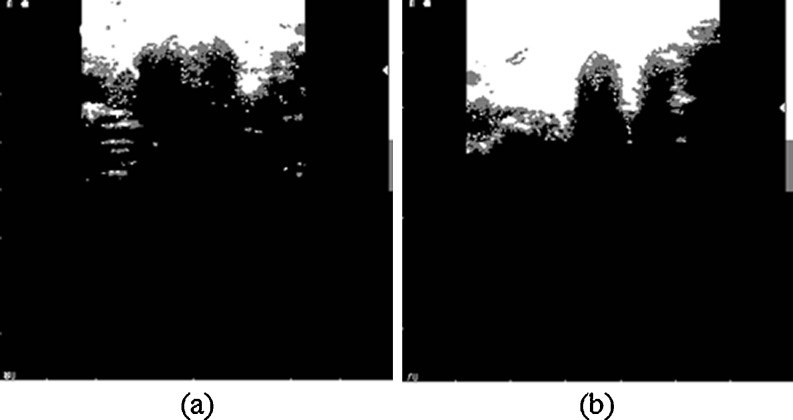
Due the influence of the speckle noise, there are some isolated points in the binary image after pixel classification. A 5 × 5-pixel mask is used to remove isolated dots (Fig. 5). The center pixel mask (located at the intersection of line 3 and column 3) scans all the gray pixels inside the mask and compare their values with the gray level intensity value of 125 assigned to nodule area. If the percentage of the gray pixels inside the mask is less than 40 %, the center pixel mask identifies these pixels as being isolated and they were set to 255 (namely, white pixel). Here, the value of threshold of 40 % was empirically selected.
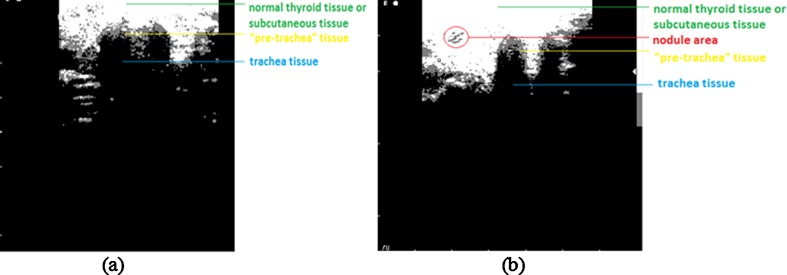
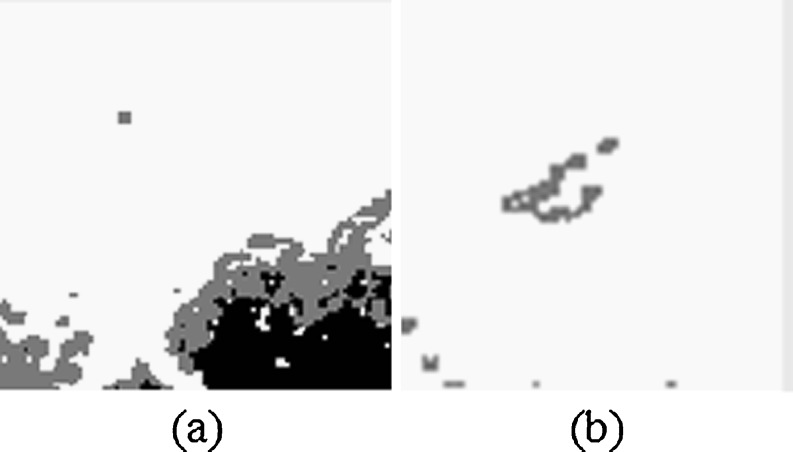
The diagnosis process was run for both the entire US image (Fig. 5) and for ROIs cropped from US image (Fig. 6).
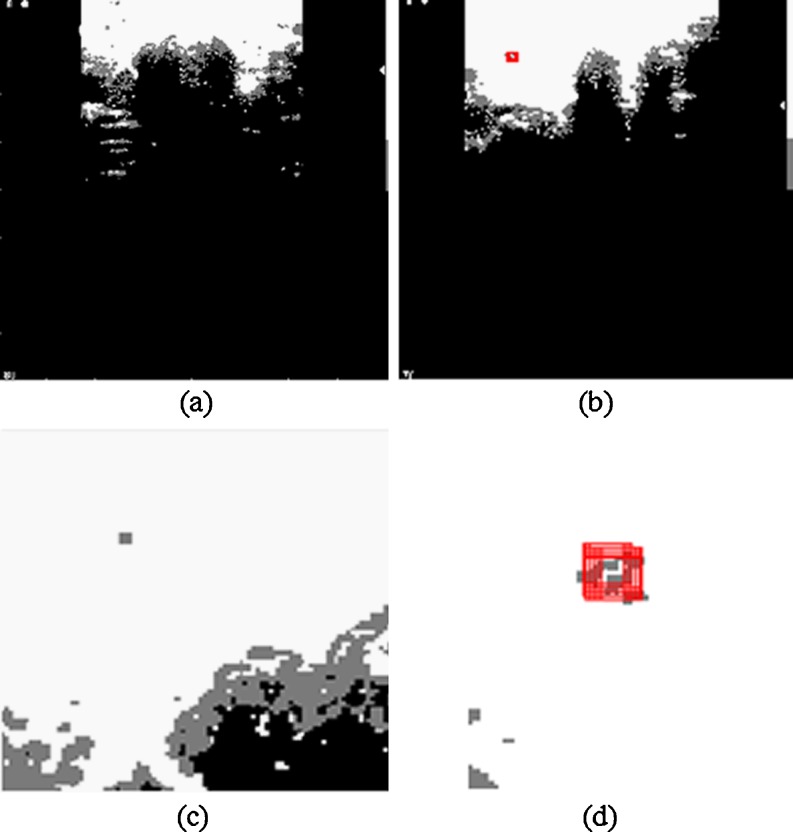
The hypoechoic area comprises trachea region and the hyperechoic area comprises the pre-trachea, and it is recommended to remove their undesirable impact on nodules detection process (which are also hyperechoic). The nodule areas are analyzed using a customized mask by 11 × 11 pixel size. The center mask pixel (located at the intersection of line 6 and column 6) scans the all the gray pixels inside the mask. If the percentage of the pixels having the gray intensity level value of 125 is higher than 50 %, we presumed that the mask analyzes either a nodule area or a pre-tracheal area. In order to distinguish between the two areas, the following method has been used: the 11 × 11 mask was recursively translated to the left, right, and down until one of the next three cases was found: (a) the percentage of white pixels (assigned to 255) in the mobile mask is higher than 95 %; (b) the percentage of black pixels (assigned to 0) in the mobile mask is greater than 30 %, or (c) the mobile mask reaches the edge of the image. If the results of the translations in the three analyzed directions belong to the first case, the analyzed area is classified as nodule and the mask area is highlighted in red. If at least one result is in the second or third case, the analyzed mask belongs to the pre-tracheal area. In terms of diagnostic needs, the absence of the red squares indicates normal thyroid pathology and their presence indicate thyroid nodule pathology. This method is proven to be beneficial to remove the adjacent tissue areas that are viewed as artifacts but which share similar features as the real nodule area. Figure 7a–d presents the processed images shown in Figs. 5 and 6 using the proposed algorithm.
Save the data.
Fig. 4.
Highlighting the biological areas. a For image in Fig. 1a. b For image in Fig. 1b
Fig. 5.
Eliminating the isolated gray pixels using the 5 × 5-pixel mask. a For image in Fig. 4a. b For image in Fig. 4b
Fig. 6.
Cropped images. a ROI cropped from Fig. 5a. b ROI cropped from Fig. 5b
Fig. 7.
Processed images using the proposed algorithm. a Image presented in Fig. 5a. b Image presented in Fig. 5b. c Image presented in Fig. 6a. d Image presented in Fig. 6b
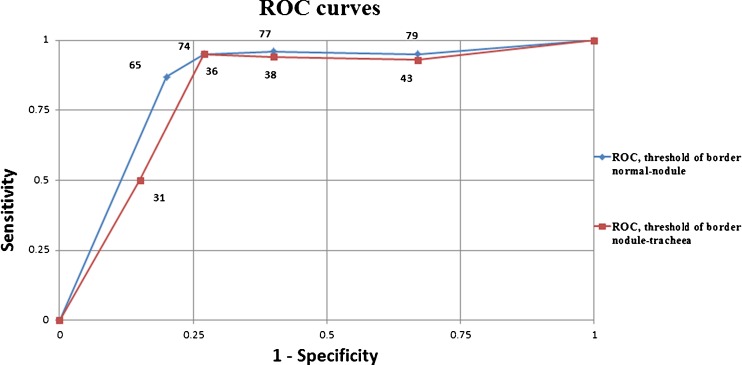
To validate the proposed intervals in Fig. 3, five decrease/increase units in the interval limits of tracheal area-nodule area and nodule area-normal thyroid tissue have been realized. The ROC curves presented in Fig. 8 allow establishing the optimal ranges for maximal diagnostic accuracy. The calculated areas under the curves are 0.82 and 0.84, respectively, and indicate a good accuracy of the proposed method. Following this finding, the limits of the initial proposed intervals are changed according to those points on the ROC curves that are closer to the point of best possible prediction (the left upper point from ROC space). The new proposed limits for normal thyroid area-nodule area is 74 and for nodule area-tracheal area is 36 (Fig. 9). Similarly, the limit values used in the highlighting step of the algorithm were replaced.
Fig. 8.
The ROC curves of normal thyroid area-nodule area and nodule area-tracheal area limits
Fig. 9.

The new optimized intervals used in CADi application
In these maximum accuracy conditions, Table 6 shows the marks as true negative, true positive, specificity, sensitivity, and accuracy values of the CADi application software, corresponding to 20 US entire images of normal thyroid and 20 entire US images of thyroid nodule.
Table 6.
The CADi efficiency for entire thyroid US images
| TN (correct labeled as normal thyroid) | 15 |
| TP (correct labeled as thyroid nodule) | 18 |
| Specificity | 75 % |
| Sensitivity | 90 % |
| CCR | 83 % |
Table 7 shows the same marks of the CADi application software, corresponding to 40 ROIs of normal thyroid US and 40 ROIs of thyroid nodules. Looking at the results presented in Tables 6 and 7, we concluded that a good diagnostic efficiency of the CADi application is achieved.
Table 7.
The CADi efficiency for ROI images
| TN (correct labeled as normal thyroid) | 36 |
| TP (correct labeled as thyroid nodule) | 37 |
| Specificity | 90 % |
| Sensitivity | 93 % |
| CCR | 91 % |
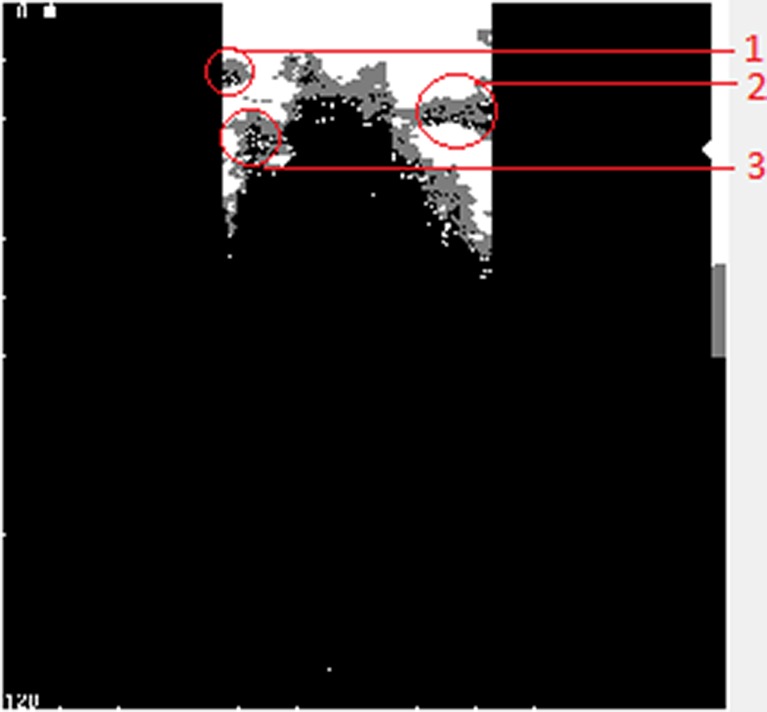
The proposed method has some limitations. First, the ultrasound images with good brightness and contrast are demanded. Then, the diagnostic errors can occur as a result of the mask size and the threshold values used in the algorithm (if the percentage values of gray pixels having the intensity of 125 inside the mask is less than 50 %, the center mask pixel does not recognize a possible thyroid nodule). Finally, most of the errors appear when the nodule area is located close to the pre-trachea, trachea, left side, or right side areas of the image (Fig. 10). In these cases, the algorithm fails to recognize the thyroid nodules.
Fig. 10.
Limitations of the method appear when the nodule is closer: to the left boundary of the image (1); to the right boundary of the image (2); and to the pre-trachea or trachea areas of the image (3)
Conclusions
The first-order statistical features, statistical test, and a new software application are successfully used to characterize and classify the thyroid nodules in the thyroid US images. Based on the mean feature values, we proposed the following mean value of gray intensity intervals as classifier for biological areas in thyroid US images: 0 to 36 corresponding to trachea tissues; 37 to 74 corresponding to nodule areas; 75 to 117 corresponding to normal thyroid tissues; and 118 to 255 corresponding to subcutaneous areas. Based on these intervals, we developed a CADi software application able to discern between the two pathologies. The diagnostic efficiency of the CADi system is good. However, the final diagnosis belongs to the specialist physicians. In the future, we intend to improve the CADi efficiency and to include the present application in a complex system CADi capable to assist the physicians in medical image interpretation.
Acknowledgments
The authors would like to thank the Project SOP HRD-TOP ACADEMIC-107/1.5/S id 76822 of Dunarea de Jos University of Galati, Romania.
References
- 1.Frates MC, Benson CB, Charboneau JW, Cibas ES, Clark OH, Coleman BG, Cronan JJ, Doubilet PM, Evans DB, Goellner JR, Hay ID, Hertzberg BS, Intenzo CM, Jeffrey RB, Langer JE, Larsen PR, Mandel SJ, Middleton WD, Reading CC, Sherman SI, Tessler FN. Management of thyroid nodules detected at US. Radiology. 2005;237:794–800. doi: 10.1148/radiol.2373050220. [DOI] [PubMed] [Google Scholar]
- 2.Hegedus L. The thyroid nodule. N Engl J Med. 2004;351:1764–1771. doi: 10.1056/NEJMcp031436. [DOI] [PubMed] [Google Scholar]
- 3.Bomeli SR, LeBeau SO, Ferris RL. Evaluation of a thyroid nodule. Otolaryngol Clin North Am. 2010;43:229–238. doi: 10.1016/j.otc.2010.01.002. [DOI] [PMC free article] [PubMed] [Google Scholar]
- 4.Tonacchera M, Pinchera A, Vitti P. Assessment of nodular goitre. Best Pract Res Clin Endocrinol Metab. 2010;24:51–61. doi: 10.1016/j.beem.2009.08.008. [DOI] [PubMed] [Google Scholar]
- 5.Gharib H, Papini E, Paschke R, Duick DS, Valcavi R, Hegedüs L, Vitti P. Medical guidelines for clinical practice for the diagnosis and management of thyroid nodules: executive summary of recommendations. Endocrinol Pract. 2010;16:468–475. doi: 10.4158/EP.16.3.468. [DOI] [PubMed] [Google Scholar]
- 6.Cooper DS, Doherty GM, Haugen BR, Kloos RT, Lee SL, Mandel SJ, Mazzaferri EL, McIver B, Pacini F, Schlumberger M, Sherman SI, Steward DL, Tuttle RM. Revised American Thyroid Association management guidelines for patients with thyroid nodules and differentiated thyroid cancer. Thyroid. 2009;19:1167–1214. doi: 10.1089/thy.2009.0110. [DOI] [PubMed] [Google Scholar]
- 7.Mihmanli I, Kantarci F. Concurrent routine breast and thyroid sonography for detection of thyroid tumors. Am J Roentgenol. 2006;187:448–450. doi: 10.2214/AJR.06.5075. [DOI] [PubMed] [Google Scholar]
- 8.Frates MC, Benson CB, Doubilet PM, Kunreuther E, Contreras M, Cibas ES, Orcutt J, Moore FD, Jr, Larsen PR, Marqusee E, Alexander EK. Prevalence and distribution of carcinoma in patients with solitary and multiple thyroid nodules on sonography. J Clin Endocrinol Metab. 2006;91:3411–3417. doi: 10.1210/jc.2006-0690. [DOI] [PubMed] [Google Scholar]
- 9.Wiest PW, Hartshorne MF, Inskip PD, Crooks LA, Vela BS, Telepak RJ, Williamson MR, Blumhardt R, Bauman JM, Tekkel M. Thyroid palpation versus high-resolution thyroid ultrasonography in the detection of nodules. J Ultrasound Med. 1998;17:487–496. doi: 10.7863/jum.1998.17.8.487. [DOI] [PubMed] [Google Scholar]
- 10.Savelonas M, Maroulis D, Sangriotis M. A computer-aided system for malignancy risk assessment of nodules in thyroid US images based on boundary features. Comput Method Programs Biomed. 2009;96:25–32. doi: 10.1016/j.cmpb.2009.04.001. [DOI] [PubMed] [Google Scholar]
- 11.Keramidas EG, Iakovidis DK, Maroulis D, Karkanis S. Lecture Notes in Computer Science, ICIAR, Berlin. Heidelberg: Springer; 2007. [Google Scholar]
- 12.Tsantis S, Dimitropoulos N, Cavouras D, Nikiforidis G. Morphological and wavelet features towards sonographic thyroid nodules evaluation. Comput Med Imaging Graph. 2009;33:91–99. doi: 10.1016/j.compmedimag.2008.10.010. [DOI] [PubMed] [Google Scholar]
- 13.Basarab A, Liebgott H, Morestin F, Lyshchik A, Higashi T, Asato R, Delachartre P. A method for vector displacement estimation with ultrasound imaging and its application for thyroid nodular disease. Med Image Anal. 2008;12:259–274. doi: 10.1016/j.media.2007.10.007. [DOI] [PubMed] [Google Scholar]
- 14.Maroulis DE, Savelonas MA, Iakovidis DK, Karkanis SA, Dimitropoulos N. Variable background active contour model for computer-aided delineation of nodules in thyroid ultrasound images. IEEE Trans Inf Technol Biomed. 2007;11:537–543. doi: 10.1109/TITB.2006.890018. [DOI] [PubMed] [Google Scholar]
- 15.Keramidas EG, Maroulis D, Iakovidis DK: ΤND: a thyroid nodule detection system for analysis of ultrasound images and videos. J Med Syst, 2010. doi:10.1007/s10916-010-9588-7 [DOI] [PubMed]
- 16.Bevk M, Kononenko I: A statistical approach to texture description of medical images: a preliminary study. Proceedings of 15th IEEE Symposium on Computer-Based Medical Systems (CBMS 2002), 2002, pp. 239–244
- 17.Joshi MA. Digital image processing: an algorithmic approach. New Delhi: Prentice-Hall of India Private Ltd; 2006. [Google Scholar]
- 18.Moldovanu S, Moraru L, Bibicu D. Characterization of myocardium muscle biostructure using first order features. Dig J Nanomater Bios. 2011;6:1357–1365. [Google Scholar]
- 19.Yim KH, Nahm FS, Ah Han K, Park SY. Analysis of statistical methods and errors in the articles. Korean J Pain. 2010;23:35–4. doi: 10.3344/kjp.2010.23.1.35. [DOI] [PMC free article] [PubMed] [Google Scholar]
- 20.Blaikie N. Analyzing quantitative data. London: Sage Publications; 2003. [Google Scholar]
- 21.De Varkevisser CM, Pathmanathan I, Brownlee AT. Designing and conducting health systems research projects. Amsterdam: Kit Publisher; 2003. [Google Scholar]
- 22.Karris ST. Mathematics for business, science, and technology. Fremont: Orchard Publications; 2003. [Google Scholar]
- 23.Krupinski EA, Berbaum KS, Caldwell RT, Schartz KM, Kim J. Long radiology workdays reduce detection and accommodation accuracy. J Am Coll Radiol. 2010;7:698–704. doi: 10.1016/j.jacr.2010.03.004. [DOI] [PMC free article] [PubMed] [Google Scholar]
- 24.Zheng B. Computer-aided diagnosis in mammography using content-based image retrieval approaches: current status and future perspectives. Algorithms. 2009;2:828–849. doi: 10.3390/a2020828. [DOI] [PMC free article] [PubMed] [Google Scholar]
- 25.Lu HHS, Chen CM, Huanga YM, Wu JS. Computer-aided diagnosis of liver cirrhosis by simultaneous comparisons of the ultrasound images of liver and spleen. J Data Sci. 2008;6:429–448. [Google Scholar]
- 26.Fawcett T. An introduction to ROC analysis. Pattern Recognit Lett. 2006;27:861–874. doi: 10.1016/j.patrec.2005.10.010. [DOI] [Google Scholar]
- 27.Liu Q, Zhao Z, Wang Y. Recent advances in computer science and information engineering, lecture notes in electrical engineering. Los Angeles: Springer; 2012. [Google Scholar]
- 28.Su Y, Wang Y, Jiao J, Guo Y. Automatic detection and classification of breast tumors in ultrasonic images using texture and morphological features. Open Med Informat J. 2011;5:26–37. doi: 10.2174/1874431101105010026. [DOI] [PMC free article] [PubMed] [Google Scholar]


