Abstract
Cystic fibrosis (CF) is a life-limiting genetic disease that affects approximately 30,000 Americans. When compared to those of normal children, airways of infants and young children with CF have thicker walls and are more dilated in high-resolution computed tomographic (CT) imaging. In this study, we develop computer-assisted methods for assessment of airway and vessel dimensions from axial, limited scan CT lung images acquired at low pediatric radiation doses. Two methods (threshold- and model-based) were developed to automatically measure airway and vessel sizes for pairs identified by a user. These methods were evaluated on chest CT images from 16 pediatric patients (eight infants and eight children) with different stages of mild CF related lung disease. Results of threshold-based, corrected with regression analysis, and model-based approaches correlated well with both electronic caliper measurements made by experienced observers and spirometric measurements of lung function. While the model-based approach results correlated slightly better with the human measurements than those of the threshold method, a hybrid method, combining these two methods, resulted in the best results.
Keywords: Cystic fibrosis, Computed tomography, Image analysis, Semi-automated measurement
Introduction
Cystic fibrosis is the most common lethal genetic disorder in the Caucasian population, affecting about 30,000 people in the USA (Cystic Fibrosis Foundation, http://www.cff.org/AboutCF/). In people with this disease, normal regulation of the movement of chloride ions is disrupted due to a defective transmembrane protein called cystic fibrosis conductance transmembrane regulator. In the airways, this results in the accumulation of thick, immobile mucus, leading to obstruction and infection. The result of these pathological changes is chronic progressive lung disease and eventual death [1].
Lung inflammation begins early in life [2, 3] and produces both structural and functional changes in the airways of infants and young children with this disease [4–7]. Because this damage can be present in patients who are relatively asymptomatic, lung disease can progress insidiously [4, 5, 8]. Identifying and treating early disease in children with CF is vital to prevent progressive and irreversible disease. Multiple potentially curative therapies await clinical trials. However, clinical trials have been hindered in children with CF by a lack of sensitive, reproducible surrogate endpoints. Thus, there is an urgent need for better outcome surrogates in this age group. In this regard, quantitative high-resolution computed tomographic (HRCT) lung imaging shows great promise due to its high sensitivity in detecting early airway pathology and its widespread availability. In 2004, Long et al. used HRCT lung imaging to show that the airways of asymptomatic infants and young children with CF have thicker walls and are more dilated than those of normal children [4]. Before HRCT can be clinically applied, computerized analysis tools need to be developed that result in rapid, reproducible, and accurate assessments of airway structure. The use of expert readers is not feasible as visual assessment is too subjective, tedious, and labor intensive [9].
The purpose of this study was to develop objective computerized methods, which would allow for rapid, reproducible, and accurate assessment of CT airway and vessel dimensions in infants and young children from axial (2D) CT lung images. For this population, full volumetric 3D imaging of the lungs would not be feasible for clinical trials due to radiation safety concerns. However, performing a limited number of 2D axial slices to selectively survey the lungs can lower the radiation dose considerably and provide comparable information [10]. Working only with selected 2D slices is challenging because we cannot take advantage of information such as airway tree structure and orientation and utilize currently available automatic 3D airway tree extraction methods [11–13]. Therefore, currently available methods cannot be directly used for these low-dose, limited scan (i.e., only selected regions in the lung are imaged) CT images of pediatric patients.
Many lung CT image analysis studies and tools have been reported in the literature [11–31]. The 2D and 3D airway wall estimation problem has also been investigated extensively. Some methods have been tested for very small and thin airway walls. Among the methods developed, the most well-known approaches are threshold-based methods [13, 21–23], full-width-half-maximum (FWHM)-based methods [24, 25], score-guided erosion [21], gradient-based (first and second derivative) methods [19, 26, 27], model-based methods [11, 28, 29], gradient vector flow snakes [14], graph-cut methods [12, 15], and phase congruency [16]. The FWHM method has been widely used to investigate airway changes in obstructive lung diseases [25, 30, 31]. However, this method systematically overestimates wall area and underestimates lumen area [29, 30]. Although performance of the threshold and gradient-based methods are often satisfactory, optimal parameters depend on the size of the structure being imaged. Algorithms taking into account the point-spread function of the scanner were shown to significantly improve the robustness of measurements for all sizes of airways [11, 28, 29].
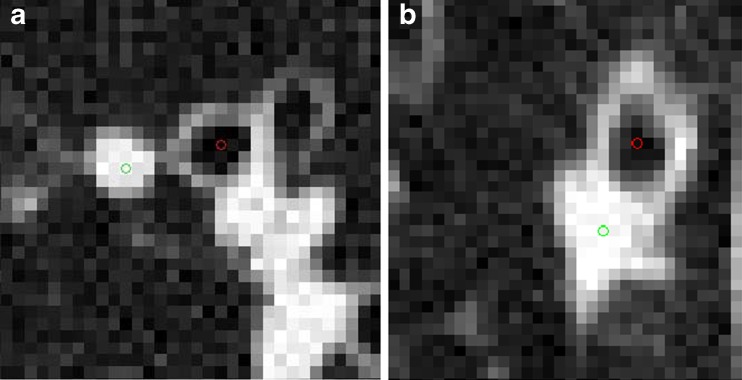
One of the main challenges in airway wall and vessel estimation is the fact that airway wall thickness of infants and young children is close to CT resolution limits. Additionally, any surrounding high-intensity tissue such as vessel structures or lung parenchymal pathology can create distortions in the algorithm especially on a limited 2D dataset. To address these challenges, we are proposing two new computer-assisted tools for airway and vessel dimension estimation: (a) modification of a previously described threshold-based method we presented [32] and (b) a model-based method. A hybrid method, which is a simple combination of these two methods, has also been investigated. The only user input required by these methods is designation of the approximate centers of the airway and vessel, which can be easily marked by two mouse clicks on the displayed CT image (Fig. 1). Our threshold method has similarities to earlier methods [24, 25, 32]; however, it includes a regression-based correction to improve its performance. Likewise, our model-based approach is different from previously published approaches [11, 28, 29] in that (a) a 2D model is integrated into the cost function (instead of 1D profile matching for rays originating from the center), (b) it incorporates airway and vessel estimation in the same model (to better estimate airway–vessel pairs in close proximity), and (c) nearby high-intensity regions (other airways/vessels) are automatically eliminated from the model, instead of rejecting whole rays, and hence less information is lost. All these novel approaches result in much improved performance for this particularly difficult infant and child dataset with limited CT slices.
Fig. 1.
Representative HR CT lung images of two different airway and vessel pairs. Short-axis lumen diameters for a = 2.6 mm, b = 2.87 mm. Red and green dots show the centers of airway and vessel, respectively
Material and Methods
Dataset
HRCT images from 16 patients (eight infants, eight children, ten females, six males, age 6.3 ± 4.5 years, range 0.8–13.1 years) with varying degrees of early CF related lung disease were selected for evaluation. These patients were selected to span the range of disease severity levels seen in these age groups. HRCT scans were performed using either a General Electric Hi Speed Advantage or Volume CT scanner (General Electric Medical Systems, Milwaukee, WI, USA) with 1.0–1.25 mm slice thickness, 400–1,000 ms scan time, 80–120 kVp, 60–80 mA, 512 × 512 matrix (pixel size is ∼0.5 mm), and the smallest possible field of view (15–25 cm). Images were acquired near full inspiration without respiratory motion artifacts using a controlled-ventilation or volume monitored technique according to age [33–35]. Images of the lung were obtained at four anatomical levels: (a) at the top of the aortic arch, (b) 1 cm below the carina, (c) at the lower edge of the left hilum, and (d) 1 to 2 cm above the top of the diaphragm. The study was approved by the human subjects internal review board of the Research Institute at Nationwide Children’s Hospital.
Airway and Vessel Dimension Measurement by Human Expert Observers
From the HRCT images of the 16 patients, all clearly visible segmental and sub-segmental airway/vessel pairs (bronchus and accompanying pulmonary artery within 1 mm of each other) that had a rounded cross-sectional circumference (ratio of long-axis to short-axis diameter <1.5) were measured manually by three observers working independently using electronic callipers available in the General Electric Medical Systems Advantage Windows 3.1 workstation. Three observers were a radiologist, a medical student, and an experienced laboratory technician with 12 years of experience working in research labs. The medical student and the technician were trained by the radiologist in how to measure vessels and airways using the electronic calipers, but they made their measurements independently.
We used a window width and window level of −1,450 and −500 HU, respectively [36]. For each airway/vessel pair, the shortest axis of the airway outer diameter (AOD), airway inner or lumen diameter (AID), and adjacent pulmonary artery or vessel diameter (VD) were measured [4]. Airway and vessel pairs with AIDs that measured less than 0.5 mm were considered too near the limits of line pair resolution of the scanner to be measured accurately and were thus excluded. All human observers chose airway vessel pairs independently as per methods above. Then only pairs picked by all three observers were used in the analyses yielding a final total of 155 airway–vessel pairs measured. The combined expert manual measurements were used in the creation of the “gold standard” for the experiment evaluation.
From these manual measurements, the airway wall thickness (AWT) was derived as (AWT = [AOD − AID]/2). Next, the key radiology rule of thumb ratios (AWT/VD and AID/VD) were computed [37] from the measurements made by each observer. These rule of thumb ratios represent assessments of disease severity using the accompanying vessel as an internal reference standard.
Clinical Measurements
Spirometric measures of pulmonary function tests including forced vital capacity (FVC) and forced expiratory flows between 25 and 75 % of FVC (FEF25-75) were measured using standard methods [38, 39]. All results were expressed as percentages of predicted values calculated from the normative data [40, 41].
Threshold-Based Computerized Airway and Vessel Short-Axis Diameter Measurement Method
We previously developed a threshold-based airway and vessel short-axis diameter measurement method [32]. Although the results presented were promising, the method had some drawbacks: (a) It had a few parameters determined in an ad hoc fashion, and no formal methodology was proposed regarding how to generalize the method for another image reconstruction setting and/or CT scanner; (b) there was some overestimation in the lower ranges of AWT/VD ratio. In this section, firstly, our previous method [32] is briefly summarized, and then the modifications to the previous method to address these issues are explained.
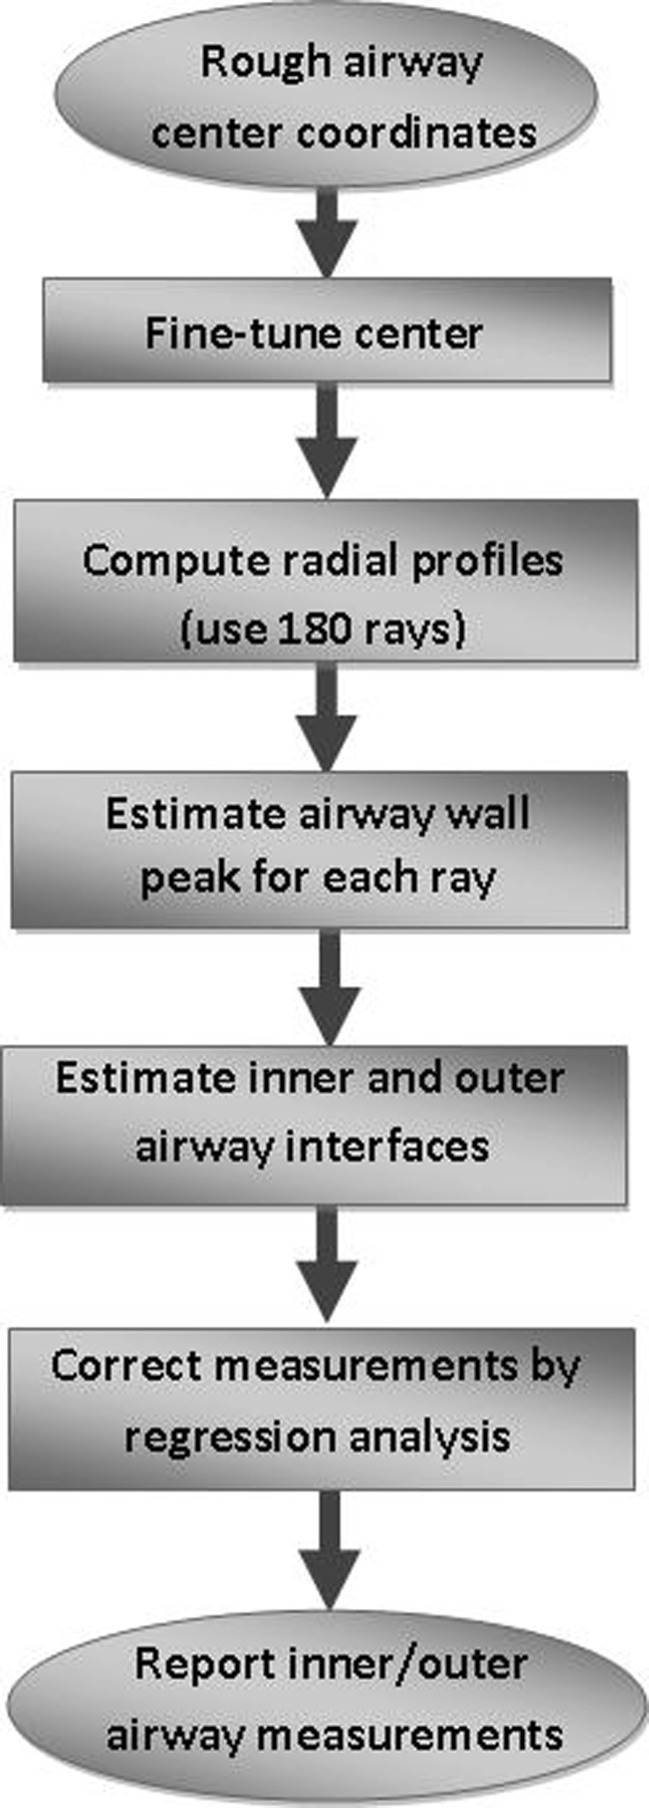
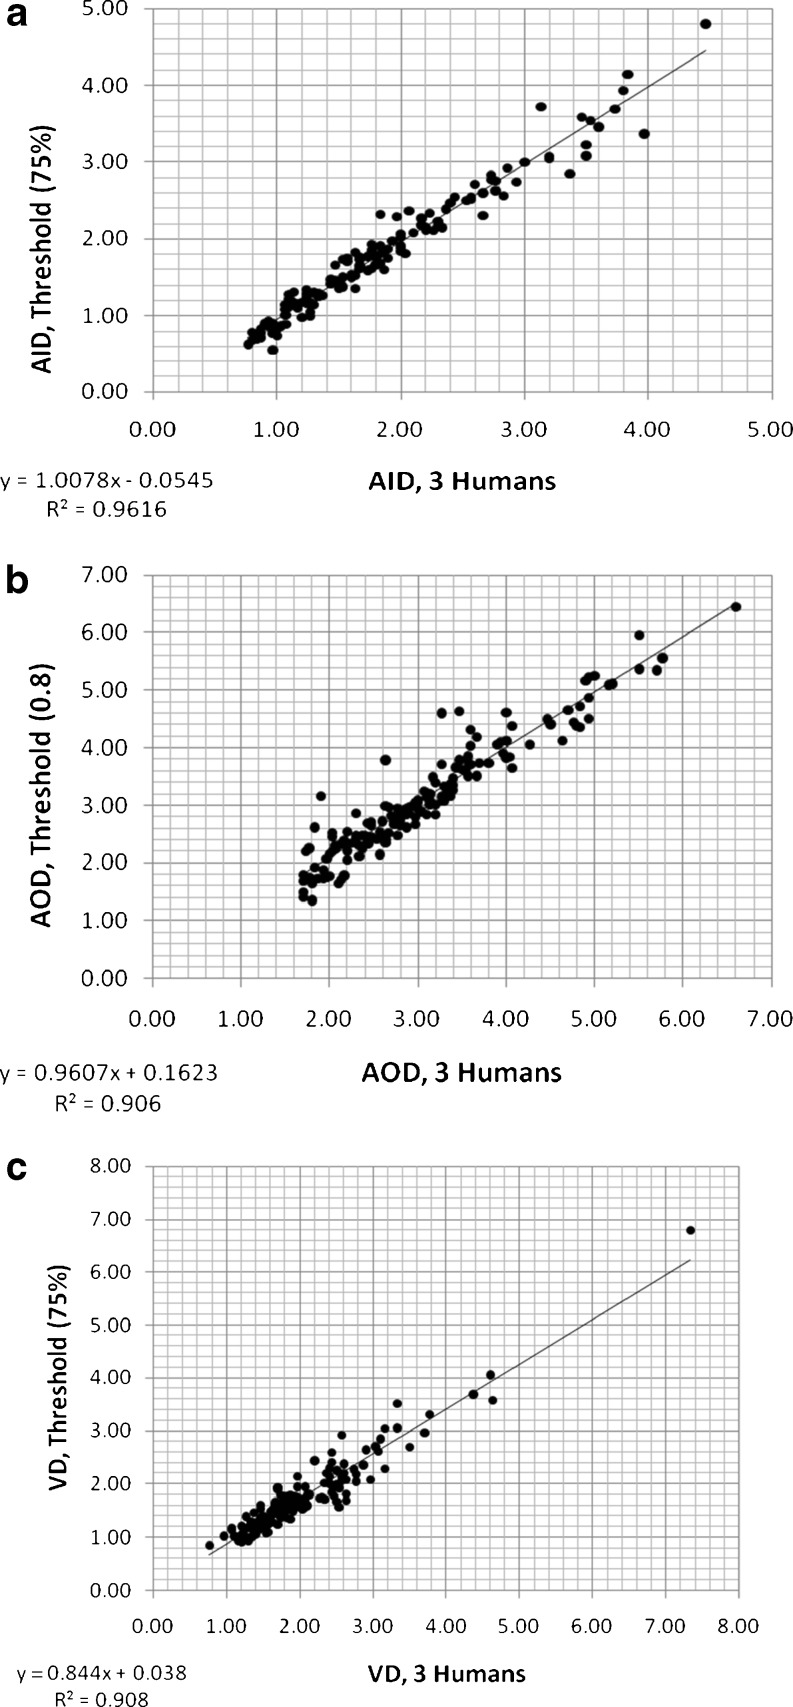
Our earlier threshold-based airway short-axis diameter measurement method [32] had four main steps (the first four blocks of Fig. 2): (1) fine-tuning the center coordinates of the airway to correct any small human mistakes by local minima search, (2) computing radial intensity profiles covering all angles from the center, (3) angular smoothing (to minimize the sampling problem [11]) and estimating the airway wall peak on each radial profile (with a special correction method for vessels or other high-intensity structures nearby), and (4) estimating the inner (lumen) and outer airway interfaces. For very small and thin airways, FWHM method (50 % intensity level) is not accurate to determine airway lumen, as reported in the literature [13, 25, 30, 31]. In our experiments, a 75 % level between airway wall peak intensity and air intensity was found to provide good estimate of the lumen radius [32]. For determining the outer airway boundary, the threshold method was not helpful since there are often other vessels and/or high-intensity structures nearby. Therefore, the measurement in the inward direction (between peak and lumen) was used as an estimate for the outward direction measurement. However, the central differencing method that we used in peak detection together with a relatively lower slope of the outer edge when compared with that of the inner slope resulted in a slight overestimation of airway wall peak position [32]. Therefore, we found it to be more accurate to estimate the outer boundary at a location 0.8 times the distance between lumen and peak (i.e., further away from the detected peak) [32]. For vessel diameter estimation, a 75 % level (rather than 50 %) of peak intensity was observed to be a good estimate of the vessel boundary [32]. Using the extended data set of this study, our previous method [32] is evaluated again, and results are shown in Fig. 3. These results indicate that airway lumen and outer boundary estimates are acceptable (Fig. 3a, b), but vessel diameter is underestimated for large vessels (Fig. 3c) and the slope is less than “1.0.”
Fig. 2.
Flowchart of the threshold-based airway short-axis measurement algorithm
Fig. 3.
Measurements of primary variables (AID, AOD, VD) using the previous threshold-based computerized method [32] versus three human observers: a AID measured for threshold value of 75 %; b AOD measured for 0.8 fraction (of the inner thickness); c VD measured for threshold value of 75 %
As reported in the literature [11, 25], optimum threshold settings depend on (a) size/thickness of the airways and (b) image reconstruction filter settings of the CT scanner. For the range of airway size/thickness of CF patients and for the CT scanner settings of our data, the selected threshold settings showed a linear relationship (Fig. 3a–c). However, for other CT scanners and/or image reconstruction settings, the issue of how to determine the optimum threshold settings and how to correct remaining systematic error is not known and needs to be researched further. In this paper, we propose a regression-based measurement correction (the last block of Fig. 2), keeping all the other steps the same as in our previous work [32]. This requires a training step using a phantom or manual measurements together with a regression analysis that provides a model of systematic measurement bias. After obtaining the regression coefficients (b1 and b2 in the relationship y = b1 + b2x), the measurements (y) can be simply corrected by the inverse relationship x = (y − b1)/b2 where x represents the regression corrected value. To test the performance of this regression correction approach, a separate data set is typically utilized. This training and correction approach makes the method generalizable to other image reconstruction settings and/or CT scanners. In this study, phantom measurements were not available and dataset was limited. Therefore, the leave one out training/testing method was applied.
Model-Based Computerized Airway and Vessel Segmentation Method
Our second approach for the airway and vessel segmentation is model-based. In this approach, a model image is created and parameters of this model image are estimated to match the original image. The estimation step is usually in the form of automatic optimization of a cost function with respect to model parameters, which penalizes the difference between the actual image and model image pixel intensities. This approach also models the effect of the CT scanner in the form of a low-pass filter [42, 43].
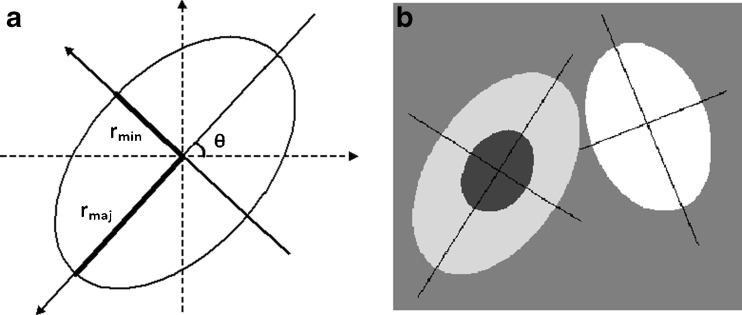
A representative model is shown in Fig. 4b where airway/vessel cross-sectional images are modeled using ellipse shaped boundaries. This model includes four uniform intensity regions: airway wall intensity, parenchymal intensity, airway air intensity (center of airway), and vessel intensity. The last two are preset as −996 HU [13] and 0 HU, respectively. Since airway wall and parenchymal intensities are quite variable, they are estimated for each airway–vessel pair.
Fig. 4.
a Ellipse parametrization used to model airway and vessel boundaries; b model of an airway–vessel pair. Note that airway (left) is modeled by two ellipses, which are concentric and having same orientation and the vessel is shown to the right
There were previous efforts to use model-based approaches for airway measurements. For instance, Saba et al. [28], Reinhardt et al. [29], and Weinheimer et al. [11] have shown that the absolute airway measurement errors when using a model-based approach were statistically smaller than those when using the FWHM-based method. Our model-based approach is different from the previous approaches [11, 28, 29] in that (a) a 2D model is integrated into the cost function (instead of 1D profile matching for rays originating from the center), (b) it incorporates airway and vessel estimation in the same model (to better estimate airway–vessel pairs in close proximity), and (c) nearby high-intensity regions (other airways/vessels) are automatically eliminated from the model, instead of rejecting whole rays originating from the center, and hence, less information is lost.
Due to the partial volume effect introduced by the X-ray beam collimation and the sampling process in the CT scanner, to which the thinner airway walls are more sensitive, airway wall intensity is variable between different airway generations [19, 44]. For this reason, we initially set the airway wall intensity value to the median intensity of the airway wall. Using the inner and outer boundary estimates (of the threshold method), airway wall intensity at mid-wall position is measured for all radial angles, and the median intensity is calculated. To determine a more accurate value for each airway, the wall intensity is included among the parameter set of the optimization algorithm.
Image resolution, hence the point-spread function (PSF), is an important component of the model-based technique. Since the images used in this study are 2D, we approximate the PSF as a symmetric 2D Gaussian function of unit area. Before assessing the similarity of the model image to the CT image, the model image has to be filtered with the PSF of the CT scanner. Although 2D CT resolution can be quantified using point-source measurements [28], the spatially varying nature of the spiral CT [45] makes the measurement approach not feasible. Our experiments demonstrated that spatially invariant sigma setting works quite well and the results are not very sensitive to changes within some reasonable range. We set this parameter experimentally such that CT image and model-generated images look visually similar.
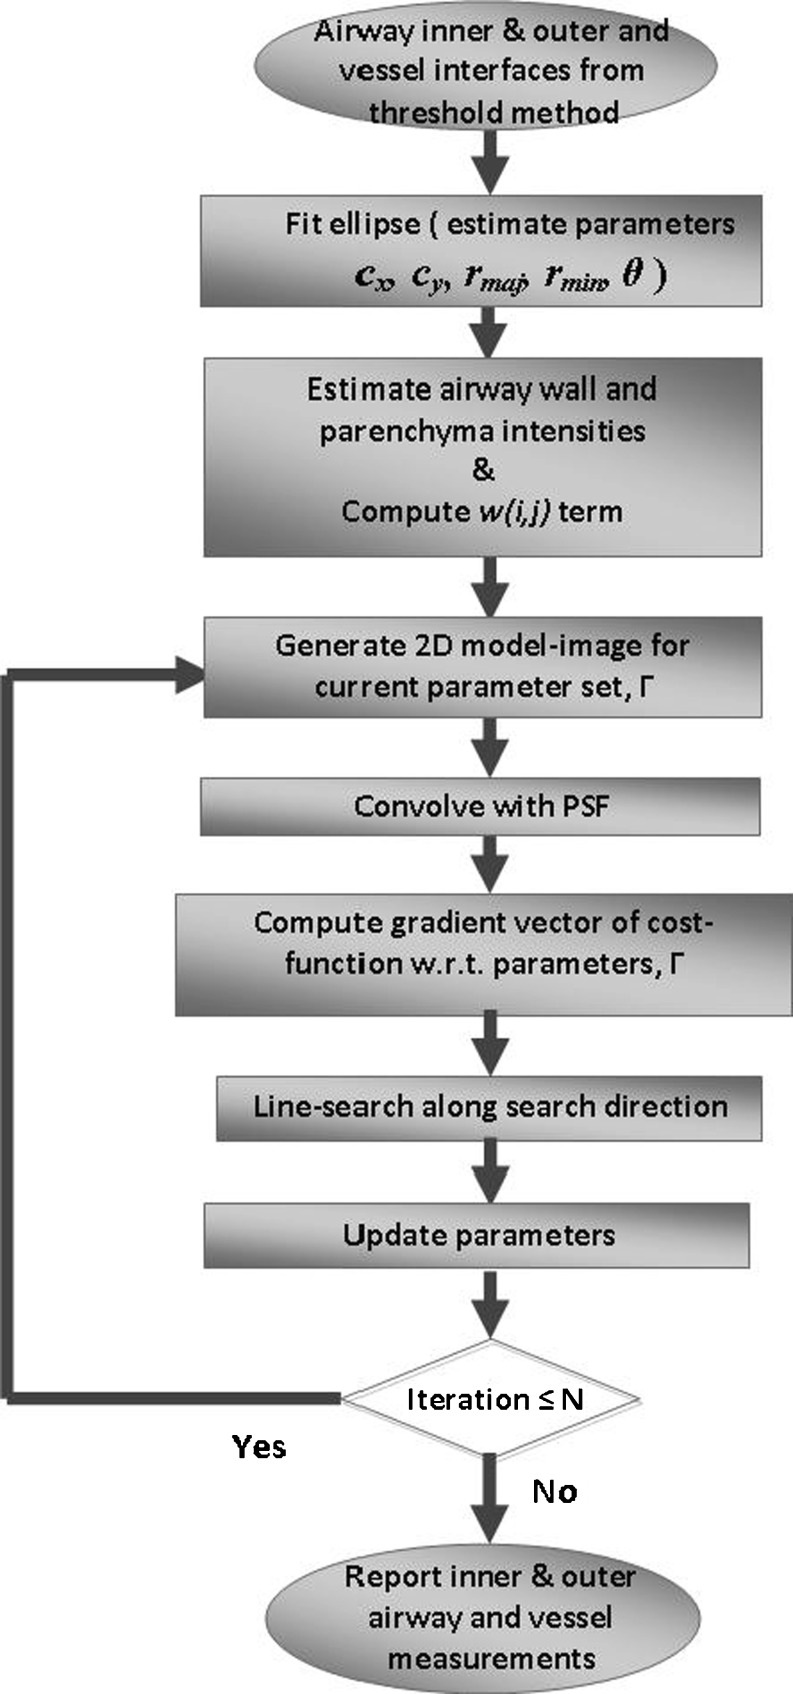
Figure 5 shows flowchart of our model-based algorithm. The algorithm starts by fitting three ellipses to the boundary points of the inner airway, outer airway and vessel obtained from the threshold-based method. Each ellipse is represented by the following set of parameters: center coordinates (cx, cy), major (long) and minor (short) axis radii (rmaj, rmin), and orientation (angle, θ) of major axis (Fig. 4a). Since inner and outer ellipses may be slightly off in their center coordinates and angle of orientation, cx, cy, and θ are averaged. In addition, if rmaj/rmin ratio is estimated more than 1.5, rmaj is set to 1.5rmin because the ratio of long-axis to short-axis diameter is limited by 1.5 in airway/vessel pairs selected for evaluation. This constitutes the initial model parameters to represent the airway–vessel model (Fig. 4b) for the following iterative model-fitting steps.
Fig. 5.
Flowchart of the model-based airway–vessel wall estimation algorithm
The cost function for model fitting is defined in Eq. 1:
 |
1 |
Here, u and v are CT and model intensity values at location (i,j) and ∂ is the image domain of pixels. The w(i,j) term, a number between 0.0 and 1.0, adjusts the contribution of the pixel at location (i,j) to the cost function, hence referred to as weighting term (described in detail below).
For oblique airways, airway wall, parenchymal, and air (inside airway) region intensities are not uniform on a cross section due to partial volume averaging along axial direction (slice thickness). This creates deviation between our model and the CT image. However, by using the square root of the absolute differences in Eq. 1, the deviation of our 2D model image from CT image is minimized. The square root function provides a decreasing rate of penalty for increasing difference magnitudes.
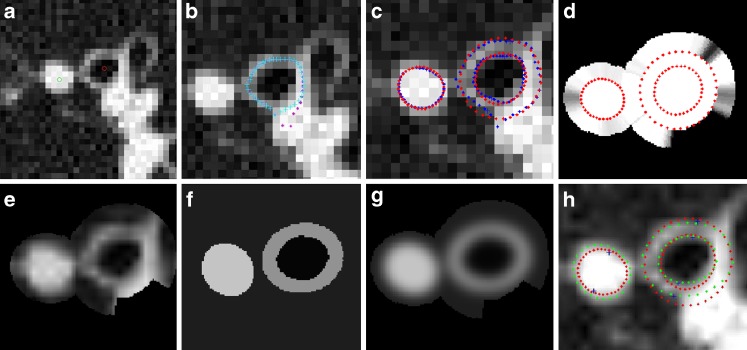
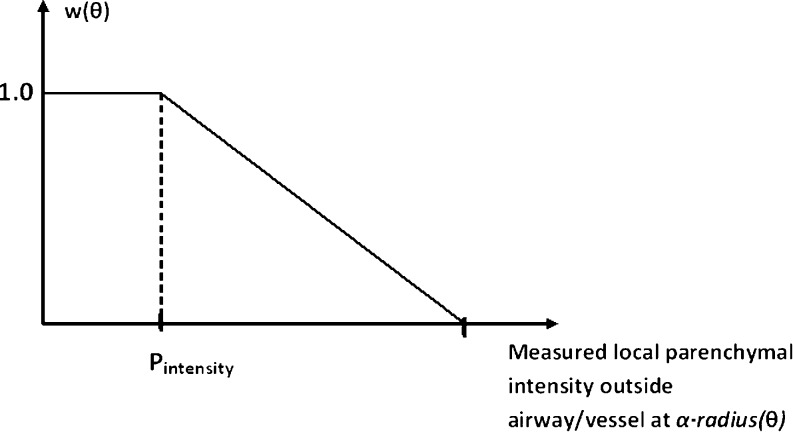
The w(i,j) term in Eq. 1 adjusts the contribution of each pixel to the cost function. The goal of including this cost function is to minimize the effect of nearby airways/vessels or other high-intensity structures on segmentation (Fig. 7). Our approach was to detect these high-intensity regions so that we could exclude them from the estimation (by assigning 0.0 to the w(i,j), which otherwise would be 1.0). These structures can be easily detected if the average local pixel intensity in the parenchymal region of each airway and vessel is above a threshold value. Experimentally we have found that excluding such regions makes the model estimation more robust with the remaining pixels providing enough data points for an accurate model fitting (see the “Results” section). However, an intrinsic drawback of a binary (0/1) weighting is that a small change in parenchyma intensity can switch that pixel in and out of the optimization domain. To address this problem, we used a soft-threshold function, w(θ) (Fig. 6). The break point in Fig. 6 (Pintensity) was estimated as the median intensity of the parenchymal sub-region. This function, w(θ), is computed for each angle with respect to the center of airway/vessel. To obtain w(i,j) for each pixel within the sub-region, the following method was used: For each angle θ in radial direction from the center to the perimeter of airway/vessel, w(i,j) = 1.0, and from perimeter to α × perimeter, w(i,j) = w(θ) (Fig. 7d). α is a scaler larger than 1.0, defining the parenchyma region (values in the range of [1.5, 1.8] worked quite well, so the mid-point value1.65 was used). Perimeter, radius(θ), is defined by the ellipse fitted threshold method boundary. Note that detecting and excluding those outside high-intensity regions from the estimation (instead of rejecting whole rays originating from the center) makes it possible to use the airway region (air and wall) for better estimation of the airway lumen (Fig. 7d). Hence, more image information is utilized.
Fig. 7.
a A portion of a CT lung image with a labeled airway and vessel pairs of Fig. 1a (red and green dots show the centers of airway and vessel respectively); b overlayed are the automatically computed airway wall peak (blue). Also shown in purple is the preliminary computed airway wall peaks by simple peak detection (before the correction applied [32]); c threshold-based airway (lumen and outer) and vessel boundaries (blue) and simple ellipse fitting results (red). Also shown are the markers corresponding to short-axis threshold-based method estimated boundaries; d ellipse fitted boundaries (red) which define the w(i,j) function, shown in gray scale (black = 0.0, white = 1.0). Note that as the local average intensity at α × radius(θ) gets higher (i.e., there another high-intensity region), w(i,j) gets smaller, meaning that the zone outside the airway/vessel will lose its weight (importance) in estimation; e CT image within the optimization region. Black holes correspond to w(i,j) = 0.0 regions; f estimated model image after ten iterations of algorithm; g model image blurred with the convolution kernel; h model-based estimated boundaries (green), ellipse fitted threshold method boundaries (red) and short-axis threshold method markers (blue). Model-based method short-axis markers are not shown, since they are obvious to the reader along the thinnest part of the ellipse. Note how the short-axis direction changes between different methods. Also, note that CT image on a–c are displayed at reconstructed image pixel size, whereas (e–h) are six-times up-sampled (in x–y-axis) by interpolation, on which the estimation algorithm was run
Fig. 6.
Soft-threshold function, w(θ), as a function of local parenchymal intensity at α · radius(θ) from center of airway/vessel. Break point (Pintensity) was estimated as the median parenchymal intensity around the airway–vessel regions. As the parenchymal local intensity gets higher, the function value gets smaller (<1), and hence, the zone outside the airway/vessel will lose its weight (contribution) proportionally in estimation of model parameters. Horizontal axis intercept point chosen in the range of [−600 HU, −350 HU] worked quite well
Г in Eq. 1 is the parameter set in optimization that defines the model image:
 |
In this set, the first eight parameters are defined for airway: AWcx and AWcy are center coordinates, AWIrmaj and AWIrmin are major and minor axis radii of inner boundary, AWangle is the orientation of major (long) axis, AWthicknessmin is the minor (short) axis thickness (between outer and inner boundaries), and AWwall_intensity is the airway wall intensity. The remaining parameters are defined similarly for the vessel: Vcx, Vcy, Vrmaj, Vrmin, Vangle.
For airways that are oblique to the image plane, the inner and outer boundaries of the airway cross-sectional image do not show similar rmaj/rmin ratios, due to the finite thickness of the imaging plane. Typically, a larger ratio is observed for the outer boundary [21, 46]. Therefore, we define a variable called AWIOratio which allows a higher long-/short-axis ratio for the outer boundary than for the inner one (we limit its values to the range of [1.0, 1.5]):
 |
2 |
The reason for defining AWthicknessmin and AWIOratio parameters rather than AWOrmaj and AWOrmin was to simplify the optimization. Note that with this parameter set, some of the parameters have to be optimized under simple constraints: AWthicknessmin > 0 and AWIOratio ε [1.0, 1.5]. Many optimization methods can easily be adapted with such constraints [47]. On the other hand, a more straightforward parameterization of the outer boundary ellipse as (AWOrmaj, AWOrmin) results in a more complex constraint set to be dealt with: AWOrmaj/AWOrmin. ≥ AWIrmaj/AWIrmin, therefore not preferred. In order to evaluate the cost function (Eq. 1) more accurately, CT and model images were up-sampled by a factor of six in the x,y-axis using bilinear interpolation in a local region covering airway and vessel.
In the case of oblique airways, slice thickness causes partial volume averaging, and if an airway-vessel pair is in very close proximity, they can appear to be overlapping in cross-sectional images. To adapt our model for these cases, we allowed our model to have parameters that resulted in partial overlapping of airway and vessel regions. To restrict the overlap regions, the intersectional region was assigned a higher intensity value, which forced the optimization (below) to converge to a model with minimal overlap. Any overlapping pixel of the model image (at each iteration) is assigned a higher intensity value than vessel intensity. Percent increase values in the range of [20–30 %] worked quite effectively to provide close to expected airway and vessel region boundaries (judged by visual analysis by experts), so the mid-point value 25 % was used.
Optimization of the Model-Based Segmentation Cost Function
To optimize the cost function given by Eq. 1, which is not quadratic, gradient-based techniques were used. The gradient can be computed numerically by a finite difference method at each iteration. Among the gradient-based techniques, the conjugate gradient is one of the most computationally efficient and fast converging methods [47]. Here, we used the Polak–Ribiera form of the conjugate gradient method [47]. Although conjugate gradient methods are generally more effective for quadratic cost functions, we observed at least 50 % improvement in convergence speed could be achieved when compared to the steepest-descent method.
Using a suitable preconditioner matrix (P) may also significantly enhance the convergence speed of the conjugate gradient method. Here, it is selected as P = diagonal−1{Hessian} [47], where Hessian represents the Hessian matrix of the cost function (Eq. 1) computed numerically by finite differencing:
 |
in units of pixels for distance related terms and in radians for angular terms. Using this preconditioner, the update equation for the conjugate gradient algorithm is defined in Eq. 3 [47]:
 |
3 |
where γ(n) denotes the vector form of the parameter set (Г, defined above of size = 13) at iteration n, β is the optimum step size (calculated at each iteration as explained below), P is the preconditioner matrix, and d(n) is the direction vector computed using the gradient and previous direction vectors [47].
In each iteration, the conjugate gradient method requires an accurate line search (to determine the optimum step size, β), along the direction vector. Our line search method was as follows:
Initialize β = 2.0.
Compute the initial cost using Eq. 1.
Reduce β by a factor of 0.7; if AWIOratio goes beyond the range of [1.0, 1.5], truncate, and compute a new cost.
Repeat step “3” until (a) the cost starts increasing and (b) the cost is less than the initial cost or the maximum number of iterations (15) is reached.
Ten iterations of conjugate gradient method (Eq. 3) were found to provide enough convergence using the above preconditioner and line search method.
Hybrid Method
Our final method, called the hybrid method, is just the simple averaging of the short-axis measurements of our model-based and threshold-based methods.
Results
To test the performance of our new threshold method with regression correction, leave-one-out training/testing method was applied. Tables 1, 2, and 3 display the measurement error and R2 values (after regression correction) for various parameter settings. Our observations on these tables can be summarized as follows:
Low mean squared error rate (column 2) (∼10 %) and R2 values close to 1.0 after regression correction (column 4) are indicative of the success of the linear regression approach taken.
As the linear regression curve deviates from y = x (i.e., b1 ≠ 0.0, b2 ≠ 1.0 in y = b1 + b2x), correction in the form of x = (y − b1)/b2 is applied. Although this correction does not cause any problems for measurements close to regression curve, it may result in amplification of some outliers. To minimize this problem, parameter setting for which the regression curve has minimal deviation from y = x curve (last column) has to be preferred. In fact, parameter settings with the lowest deviation show approximately the lowest mean squared/maximum error and also the highest R2 values. The optimum parameter settings are selected as those with the lowest deviation: 75 % for AID, 0.8 for AOD, and 70 % for VD. The results (AWT/VD and AID/VD) of the threshold method are presented for these settings.
Table 1.
AID measurement error and R2 value after regression correction for various airway inner threshold settings of the threshold method, using leave-one-out training/testing
| Airway inner threshold (%) | Mean squared error (%) | Maximum error (%) | R2 | y = b1 + b2x Regression function (all data) | Maximum % difference between the regression function and y = x function |
|---|---|---|---|---|---|
| 50 | 10.7 | 47.1 | 0.947 | −0.22 + 0.89x | 39.1 |
| 65 | 9.9 | 43.2 | 0.955 | −0.11 + 0.95x | 18.7 |
| 70 | 9.7 | 42.1 | 0.956 | −0.06 + 0.96x | 11.5 |
| 75 | 9.6 | 42.6 | 0.957 | −0.02 + 0.98x | 4.0 |
| 80 | 9.8 | 41.8 | 0.956 | 0.03 + 1.00x | 4.3 |
| 85 | 10.2 | 41.4 | 0.954 | 0.10 + 1.02x | 13.4 |
| 90 | 10.6 | 41.7 | 0.951 | 0.16 + 1.03x | 23.8 |
Also shown are regression function and maximum percent difference between the regression function and y = x function for each setting
Table 2.
AOD measurement error and R2 value after regression correction for various airway outer thickness fraction settings of the threshold method, using leave-one-out training/testing (for AID threshold setting of 75 %)
| Airway outer thickness fraction (of inner thickness) | Mean squared error (%) | Maximum error (%) | R2 | y = b1 + b2x Regression function (all data) | Maximum % difference between the regression function and y = x function |
|---|---|---|---|---|---|
| 0.40 | 11.1 | 65.8 | 0.925 | 0.00 + 0.90x | 10.3 |
| 0.50 | 11.3 | 67.4 | 0.924 | 0.04 + 0.91x | 8.6 |
| 0.60 | 11.5 | 68.4 | 0.922 | 0.08 + 0.92x | 7.0 |
| 0.70 | 11.7 | 69.3 | 0.919 | 0.12 + 0.93x | 5.4 |
| 0.75 | 11.9 | 70.1 | 0.918 | 0.15 + 0.93x | 4.6 |
| 0.80 | 11.9 | 70.8 | 0.924 | 0.17 + 0.94x | 3.8 |
| 0.90 | 12.2 | 71.7 | 0.914 | 0.21 + 0.95x | 5.1 |
Also shown are regression function and maximum percent difference between the regression function and y = x function for each setting
Table 3.
VD measurement error and R2 values after regression correction for various vessel threshold settings of the threshold method, using leave-one-out training/testing
| Vessel threshold (%) | Mean squared error (%) | Maximum error (%) | R2 | y = b1 + b2x Regression function (all data) | Maximum % difference between the regression function and y = x function |
|---|---|---|---|---|---|
| 50 | 18.4 | 63.2 | 0.849 | 0.85 + 0.89x | 73.3 |
| 60 | 14.4 | 45.6 | 0.891 | 0.48 + 0.89x | 37.1 |
| 65 | 13.3 | 38.6 | 0.901 | 0.32 + 0.88x | 20.2 |
| 70 | 12.7 | 35.0 | 0.907 | 0.14 + 0.87x | 10.5 |
| 75 | 12.5 | 33.0 | 0.908 | 0.04 + 0.85x | 14.9 |
| 80 | 12.5 | 34.7 | 0.907 | −0.09 + 0.81x | 27.7 |
| 90 | 14.3 | 47.9 | 0.883 | −0.38 + 0.72x | 65.5 |
Also shown are regression function and maximum percent difference between the regression function and y = x function for each setting
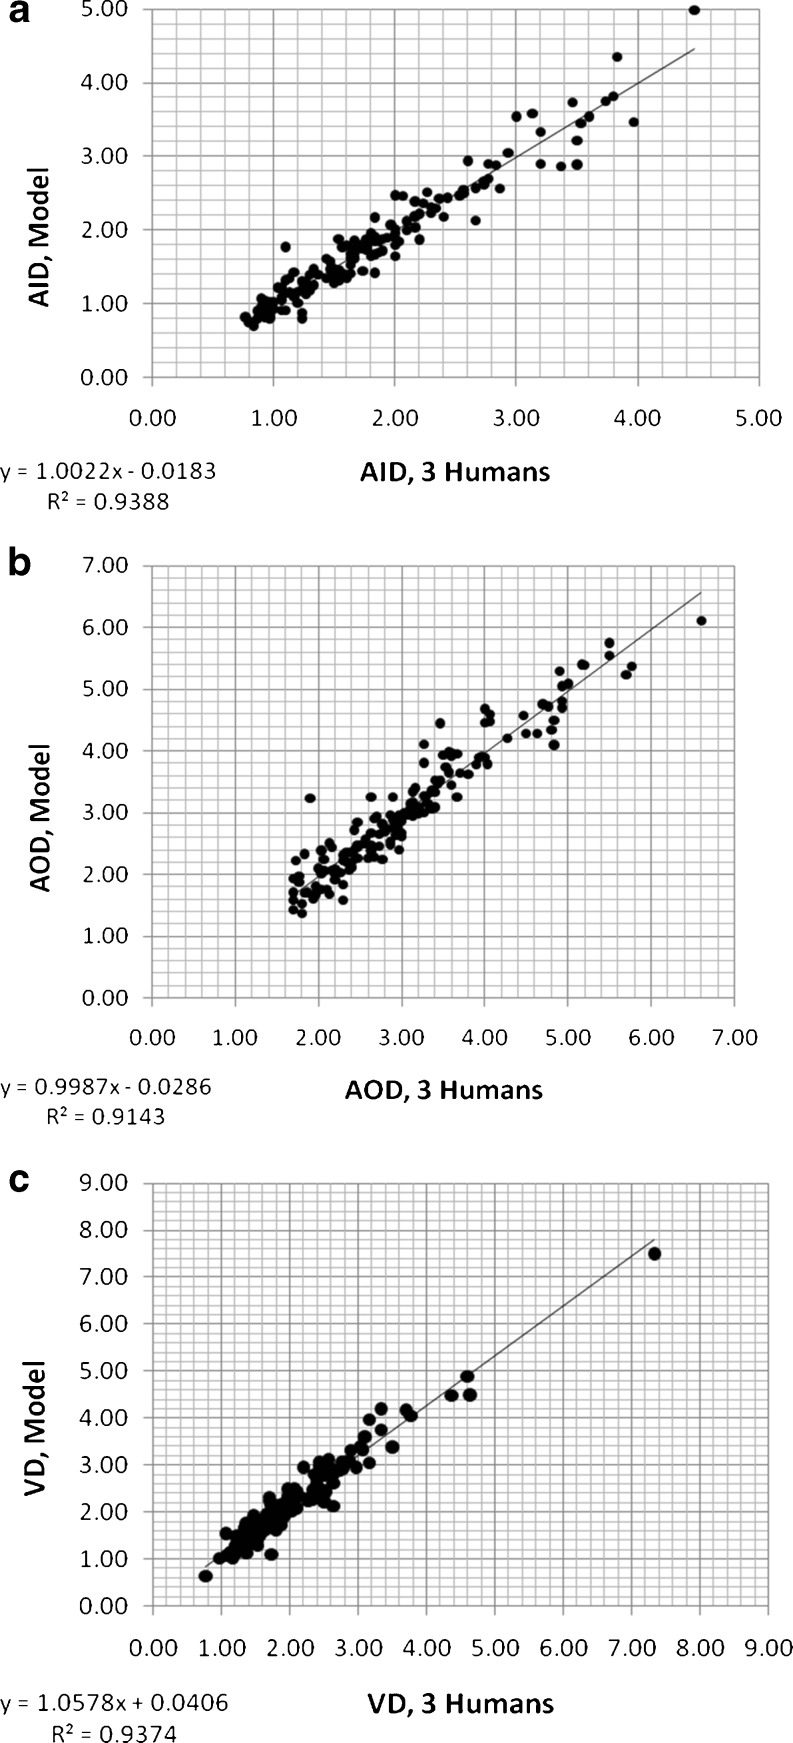
Results of each step of the threshold- and model-based algorithms are shown in Fig. 7 for an airway–vessel pair. Note the w(i,j) term calculated which minimizes or eliminates the effect of outside high-intensity structures. Three human and computer measurements for this image are listed in Table 4. Figure 8 displays how well the model algorithm duplicates the three human measurements at the primary level. Note that no regression correction was employed to obtain these results because there is no considerable systematic error left.
Table 4.
| Method | AID (mm) | AOD (mm) | VD (mm) |
|---|---|---|---|
| Human 1 | 2.30 | 3.80 | 2.80 |
| Human 2 | 2.70 | 4.00 | 3.00 |
| Human 3 | 2.80 | 4.20 | 3.10 |
| Average human | 2.60 | 4.00 | 2.97 |
| Threshold-based | 2.64 | 4.33 | 2.50 |
| Model-based | 2.66 | 4.33 | 2.92 |
| Hybrid | 2.65 | 4.33 | 2.71 |
Fig. 8.
Measurements of primary variables (AID, AOD, VD) using the model computerized method versus three human observers
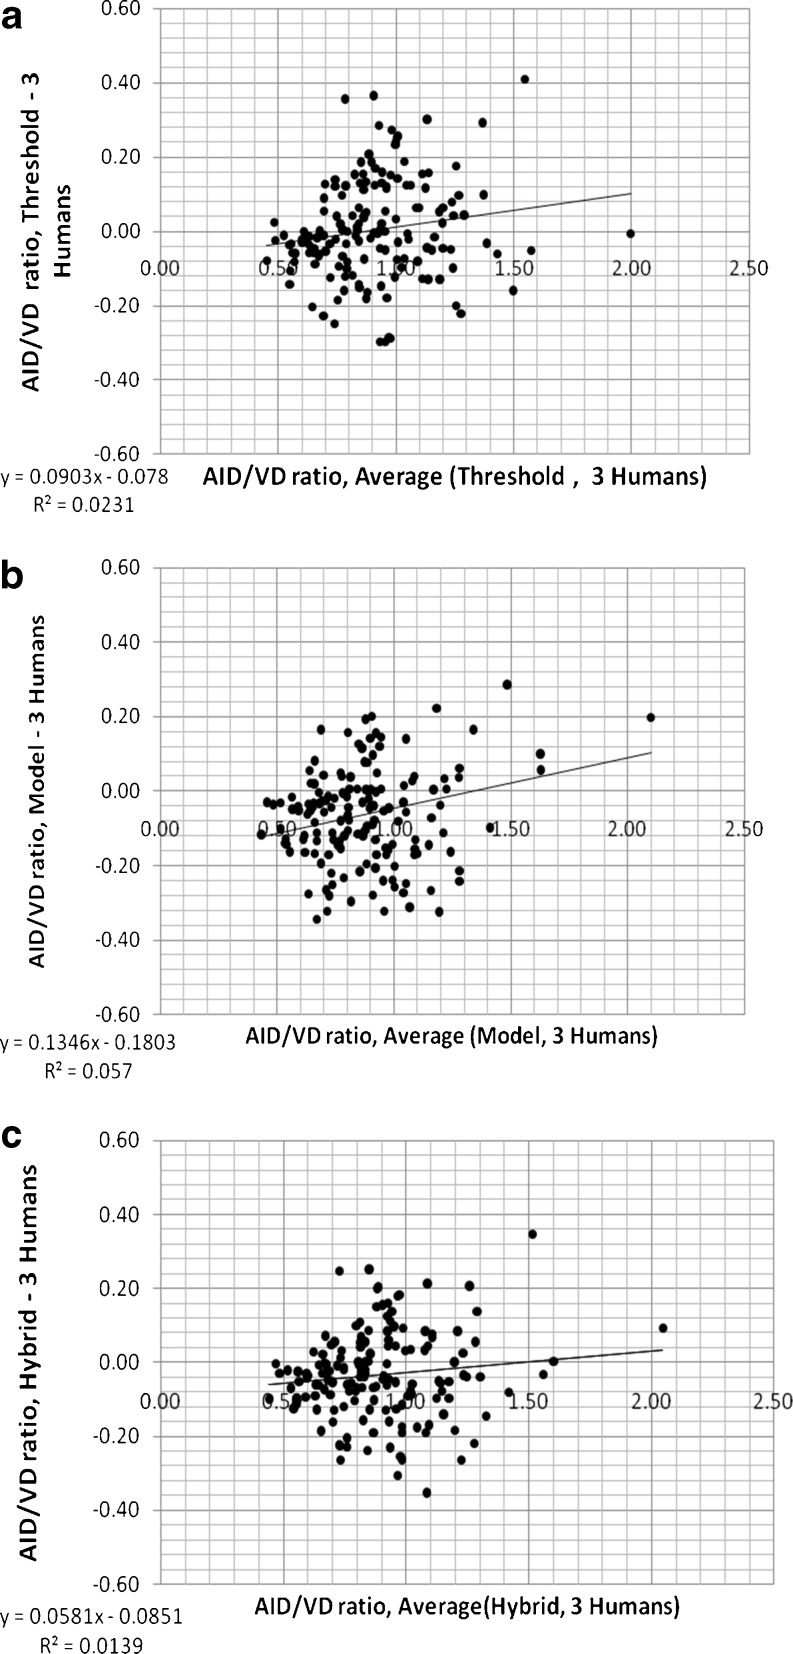
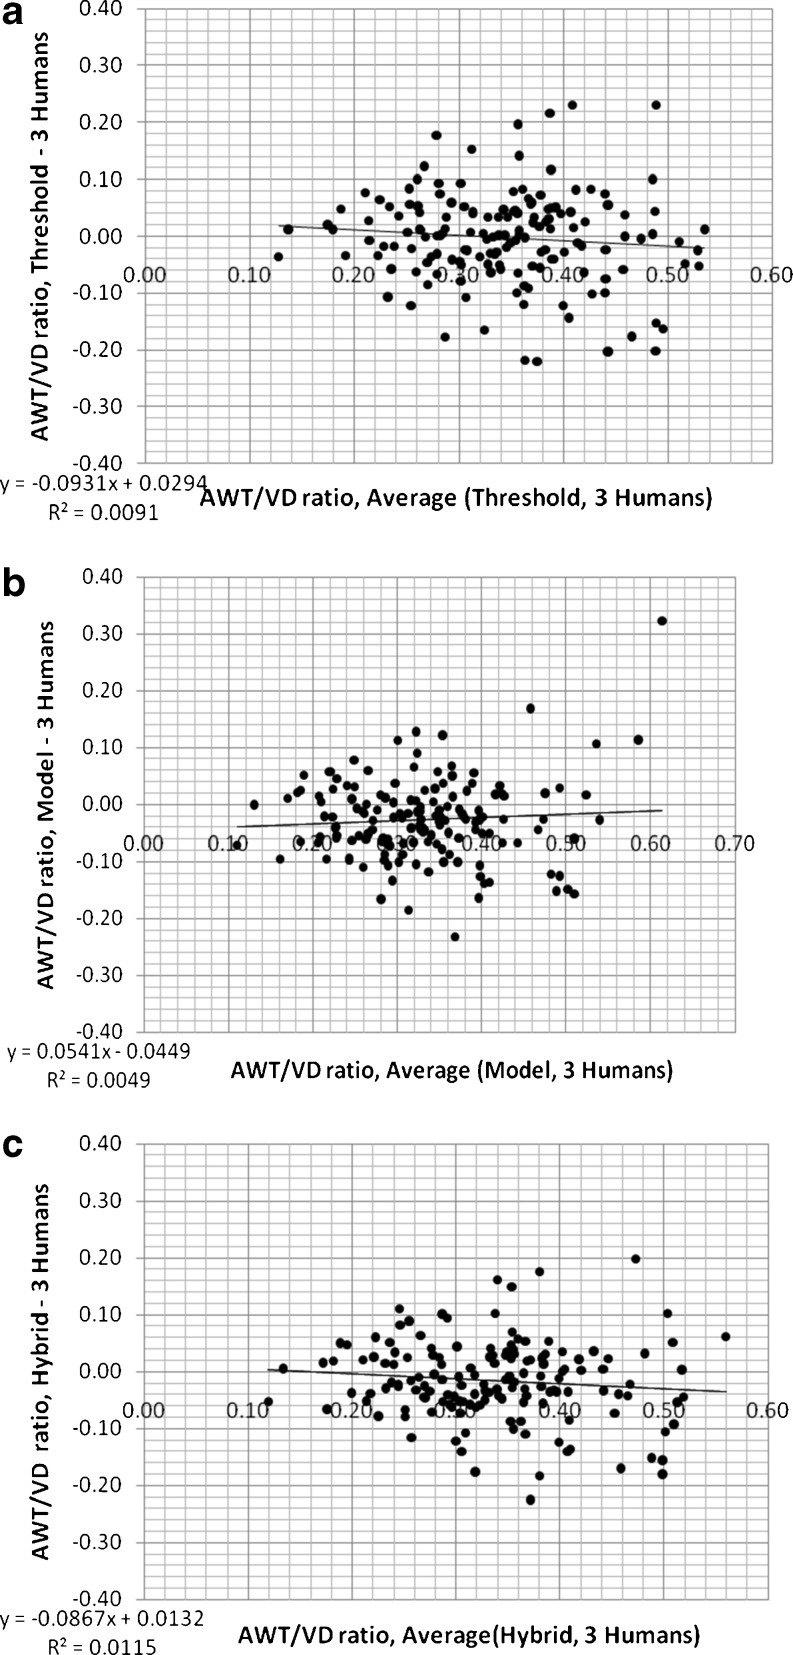
Mean AID/VD and AWT/VD ratios measured by the three human observers were all linearly correlated with those measured using the three computerized methods (p < 0.001); R2 values and slopes of linear relationships are shown in Tables 5 and 6. The slopes and R2 values of linear regression are slightly better (closer to 1.0) for model and hybrid methods than those of the threshold method for both ratios (i.e., AID/VD and AWT/VD). Comparisons of the differences between the mean ratios measured by the three human observers and the three different computerized assessments (threshold, model, and hybrid) of AID/VD and AWT/VD are shown in Figs. 9 and 10 for the 155 airway–vessel pairs. These are the Bland–Altman plots [48] of the mean of measurements of the three human observers and computerized ratios. Tables 5 and 6 also summarize the mean differences (biases), variation (standard deviations of the differences), frequency of occurrence of outlier measurements, slopes, and R2 levels for the Bland–Altman relationships shown in Figs. 9 and 10. While the differences and variations around the mean in relation the ratio magnitudes are similar for all three computerized methods, the hybrid method reduced the frequency of outliers. Thus, the hybrid method is the best match and most consistent with the human observer measurements.
Table 5.
Slopes and R2 levels for the linear regression of the three methods versus three readers
| AID/VD | Threshold-based | Model-based | Hybrid |
|---|---|---|---|
| Linear regression | |||
| R2 of method vs. 3 readers | 0.71 | 0.74 | 0.79 |
| Slope of method vs. 3 readers | 0.91 | 0.97 | 0.94 |
| Bland–Altman | |||
| Mean difference (bias) | 0.00 | −0.06 | −0.03 |
| Standard deviation of differences | 0.14 | 0.14 | 0.12 |
| Frequency of outliers (> ± 0.28) | 9 | 7 | 3 |
| Slope of regression | 0.090 | 0.134 | 0.058 |
| R2 of regression | 0.023 | 0.057 | 0.013 |
Also tabulated are the mean differences (biases), variation (standard deviations of the differences), frequency of occurrence of outlier measurements, slopes, and R2 levels for the AID/VD Bland–Altman relationships shown in Fig. 9
Table 6.
Slopes and R2 levels for the linear regression of the three methods versus three readers
| AWT/VD | Threshold-based | Model-based | Hybrid |
|---|---|---|---|
| Linear regression | |||
| R2 of method vs. 3 readers | 0.38 | 0.55 | 0.52 |
| Slope of method vs. 3 readers | 0.57 | 0.77 | 0.67 |
| Bland–Altman | |||
| Mean difference (bias) | 0.00 | −0.03 | −0.02 |
| Standard deviation of differences | 0.08 | 0.07 | 0.07 |
| Frequency of outliers (>±0.16) | 13 | 6 | 7 |
| Slope of regression | −0.093 | 0.054 | −0.086 |
| R2 of regression | 0.009 | 0.004 | 0.011 |
Also tabulated are the mean differences (biases), variation (standard deviations of the differences), frequency of occurrence of outlier measurements, slopes, and R2 levels for the AWT/VD Bland–Altman relationships shown in Fig. 10
Fig. 9.
Differences between the mean ratios measured by the three human observers (three humans) and the three different computerized assessments of AID/VD (threshold, model, and hybrid) plotted versus the mean of three human and computerized ratios (Bland–Altman plots, n = 155 airway–vessel pairs)
Fig. 10.
Differences between the mean ratios measured by the three human observers (three humans) and the three different computerized assessments of AWT/VD (threshold, model, and hybrid) plotted versus the mean of three human and computerized ratios (Bland–Altman plots, n = 155 airway–vessel pairs)
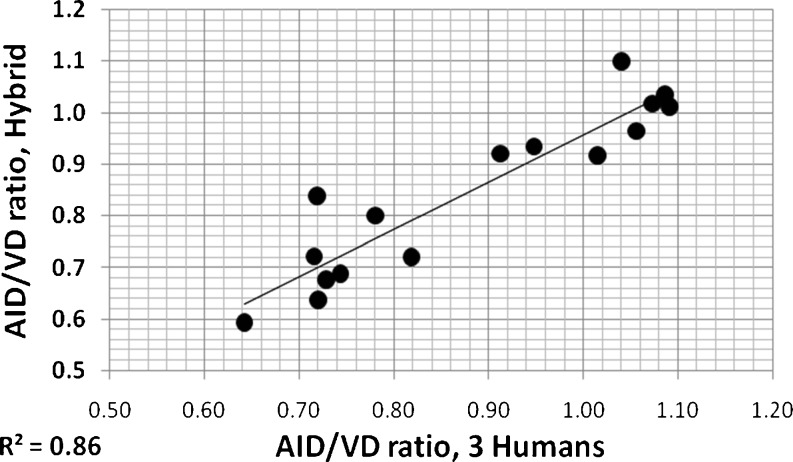
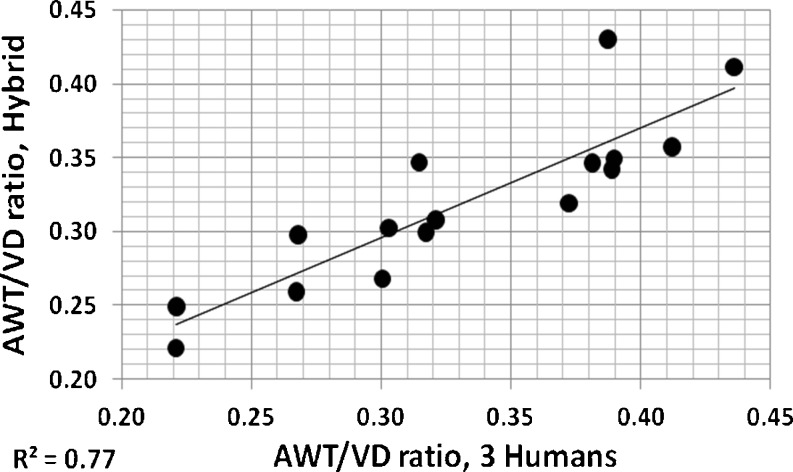
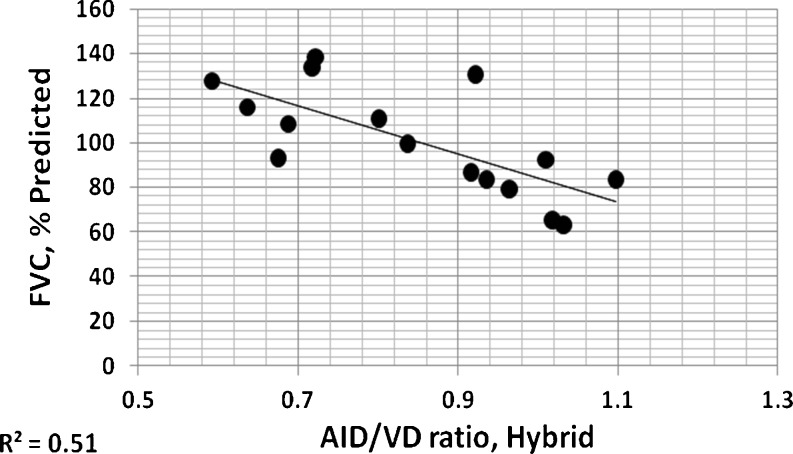
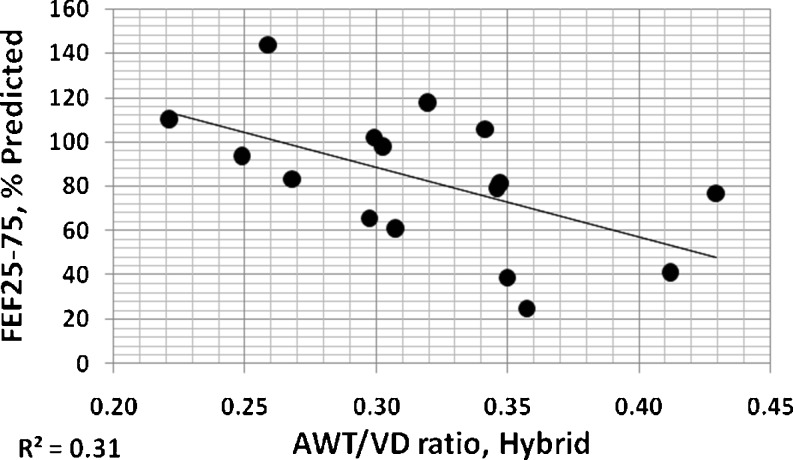
The mean of all AID/VD or AWT/VD ratio measurements from an individual patient provides a coarse global indication of airway involvement for that patient [4]. In Figs. 11 and 12, these overall individual per patient ratios measured by three observers using electronic calipers are compared to those of the hybrid method. For both measures, it can be seen that these measures of airway disease involvement are highly correlated. Figures 13 and 14 show correlations of per patient mean ratio measures produced by the hybrid method with measures of pulmonary function expressed as percent of predicted normal levels. In both figures, higher mean per patient ratios, indicative of relatively more advanced airway disease, are associated with lower levels of function. In Fig. 13, higher mean AID/VD ratios suggest more bronchiectatic airways. These airways are more likely to close as forced expiration proceeds, trapping air in the lung and reducing the amount that can be voluntarily expelled, i.e., the FVC. In Fig. 14, higher AWT/VD ratios, indicative of more narrowed airways, are associated with lower ability to force flows through those airways. These relationships suggest that measurement of these ratios from limited numbers of CT images provide clinically relevant information about the levels of airway disease in individual patients.
Fig. 11.
Individual per patient overall AID/VD ratios measured by three observers using electronic calipers plotted versus the same individual per patient overall AID/VD ratios assessed using the hybrid computerized method
Fig. 12.
Individual per patient overall mean AWT/VD ratios measured by three observers using electronic calipers plotted versus the same individual per patient overall mean AWT/VD ratios assessed using the hybrid computerized method
Fig. 13.
Individual per patient overall mean AID/VD ratios measured by the hybrid method plotted versus FVC expressed as percents of predicted normal levels
Fig. 14.
Individual per patient overall mean AWT/VD ratios measured by the hybrid method plotted versus FEF25–75 expressed as percents of predicted normal levels
Since the proposed method requires a user input, the reproducibility of the results is a question. To test the reproducibility of the methods, inputs 0.5 mm away from the already selected centers were selected (in random directions) for each of the 155 airway–vessel pairs, and the methods were run again with these random input selections. This experiment simulates potential selection point location differences of the user for each airway/vessel. The value 0.5 is considered as close as possible to the maximum user error with the resolution of the CT images. The mean and standard deviation of percent error in AID, AOD, and VD measurements obtained are shown in Table 7 for all three methods. The error is relatively small given the fact that algorithm starts by searching for the local minimum (maximum) for every airway (vessel) within the close proximity.
Table 7.
Mean and standard deviation of percent error in AID, AOD, and VD measurements (among 155 airway–vessel pairs) for randomly selected seed points (0.5 mm away from already selected points in random directions)
| Method | AID error (%) | AOD error (%) | VD error (%) |
|---|---|---|---|
| Threshold-based | 0.2 ± 5.1 | 0.0 ± 3.9 | 0.1 ± 3.7 |
| Model-based | 0.6 ± 5.9 | −0.4 ± 5.5 | 0.6 ± 4.2 |
| Hybrid | 0.3 ± 4.0 | −0.3 ± 3.9 | 0.3 ± 2.4 |
This simulates a test for reproducibility of the methods
In order to demonstrate the inter-observer variability, assessments of overall mean patient ratios (AID/VD and AWT/VD) made by three experts using electronic calipers are displayed in Fig. 15. Red, blue, and green are caliper measurements by three expert observers; algorithmically derived (hybrid method) mean patient ratios are in black.
Fig. 15.
Mean AID/VD and AWT/VD ratio plots for 16 patients. Red, blue, and green are caliper measurements by three expert observers; hybrid method estimates are in black
We also measured the average time required to make manual and automatic measurements of one airway–vessel pair. To make one set of three manual measurements per airway–vessel pair took approximately 30 s once that airway/vessel pair had been identified and magnified on the workstation. Threshold and model-based methods run times were approximately 1.5 s and 2 min, respectively, once the center point was chosen. The algorithms were developed using MATLAB® (Signal Processing Toolbox; Natick, MA, USA) (http://www.mathworks.com/) and not optimized for speed.
Discussion and Conclusion
In this study, threshold-based (regression corrected) and model-based estimation methods were developed to measure airway and vessel wall short-axis diameters from 2D HRCT images in pediatric patients at low pediatric radiation dose exposures. The threshold-based method requires a training step for setting three algorithm parameters and regression function. This training and correction approach makes the method generalizable to other image reconstruction settings and/or CT scanners. The model-based approach requires only an approximately determined system resolution parameter.
The developed model-based algorithm runs iteratively to minimize a cost function. This cost function may have some local minima. Although there are techniques that can guarantee the global convergence, they usually result in much longer and sometimes impractical computational times. In our approach, we tried to find a good compromise between very long computational times and local minima problems by initializing with the threshold-based method estimate.
Our evaluations on a data set of 16 infants and children with early CF related airway disease demonstrated that both threshold-based and model-based approaches correlated well with the measurements made by experienced observers using electronic calipers as well as with the spirometric measurements of lung function. However, the model-based approach correlates slightly better with the human measurements when compared with the threshold method. Additional improvements were observed when the hybrid approach, which resulted in less number of outliers, was used.
The current methods require minimal user input for the identification of airway and vessel pairs. We observed that initialization (of the model-based method) by the threshold method estimate is very effective, and initialization by a random set of parameters does not converge to acceptable solutions. Efforts are underway to develop methods for automatically detecting these pairs, thereby resulting in a completely automated system. For additional future work, we will improve the study by validating the hybrid method on a larger number of cases (with separate training and test data sets) and observing the variation of the model for different age groups and different stages of the disease.
Acknowledgments
The authors would like to thank Bronte Clifford and Brian N. Baker for their help in preparation of the data and measurements. This work was supported by the Middle Eeast Technical University, the Fulbright Scholar Program and by funding from the Cystic Fibrosis Foundation.
References
- 1.Ramsey BW. Management of pulmonary disease in patients with cystic fibrosis. New Engl J Med. 1996;335:179–188. doi: 10.1056/NEJM199607183350307. [DOI] [PubMed] [Google Scholar]
- 2.Cantin A. Cystic fibrosis lung inflammation: early, sustained, and severe. Am J Respir Crit Care Med. 1995;151:939–941. doi: 10.1164/ajrccm.151.4.7697269. [DOI] [PubMed] [Google Scholar]
- 3.Rosenfeld M, Gibson RL, McNamara S, Emerson J, Burns JL, Castile R, et al. Early pulmonary infection, inflammation, and clinical outcomes in infants with cystic fibrosis. Pediatr Pulmonol. 2001;32:356–366. doi: 10.1002/ppul.1144. [DOI] [PubMed] [Google Scholar]
- 4.Long FR, Williams RS, Castile RG. Structural airway abnormalities in infants and young children with cystic fibrosis. J Pediatr. 2004;144:154–161. doi: 10.1016/j.jpeds.2003.09.026. [DOI] [PubMed] [Google Scholar]
- 5.Ranganathan SC, Stocks J, Dezateux C, Bush A, Wade A, Carr S, et al. The evolution of airway function in early childhood following clinical diagnosis of cystic fibrosis. Am J Respir Crit Care Med. 2004;169:928–933. doi: 10.1164/rccm.200309-1344OC. [DOI] [PubMed] [Google Scholar]
- 6.Linnane BM, Hall GL, Nolan G, Brennan S, Stick SM, Sly PD, AREST-CF et al. Lung function in infants with cystic fibrosis diagnosed by newborn screening. Am J Respir Crit Care Med. 2008;178:1238–1244. doi: 10.1164/rccm.200804-551OC. [DOI] [PubMed] [Google Scholar]
- 7.Sly PD, Brennan S, Gangell C, de Klerk N, Murray C, Mott L, Australian Respiratory Early Surveillance Team for Cystic Fibrosis (AREST-CF) et al. Lung disease at diagnosis in infants with cystic fibrosis detected by newborn screening, Am J Respir Crit Care Med. 2009;180:146–152. doi: 10.1164/rccm.200901-0069OC. [DOI] [PubMed] [Google Scholar]
- 8.Stick SM, Brennan S, Murray C, Douglas T, von Ungern-Sternberg BS, Garratt LW, Australian Respiratory Early Surveillance Team for Cystic Fibrosis (AREST CF) et al. Bronchiectasis in infants and preschool children diagnosed with cystic fibrosis after newborn screening. J Pediatr. 2009;155:623–628. doi: 10.1016/j.jpeds.2009.05.005. [DOI] [PubMed] [Google Scholar]
- 9.Little SA, Sproule MW, Cowan MD, Macleod KJ, Robertson M, Love JG, et al. High resolution computed tomographic assessment of airway wall thickness in chronic asthma: reproducibility and relationship with lung function and severity. Thorax. 2002;57:247–253. doi: 10.1136/thorax.57.3.247. [DOI] [PMC free article] [PubMed] [Google Scholar]
- 10.de Jong PA, Nakano Y, Lequin MH, Tiddens HA. Dose reduction for CT in children with cystic fibrosis: is it feasible to reduce the number of images per scan? Pediatr Radiol. 2006;36:50–53. doi: 10.1007/s00247-005-0006-0. [DOI] [PubMed] [Google Scholar]
- 11.Weinheimer O, Achenbach T, Bletz C, Düber C, Kauczor H-U, Heussel CP. About objective 3-D analysis of airway geometry in computerized tomography. IEEE Trans Med Imaging. 2008;27:64–74. doi: 10.1109/TMI.2007.902798. [DOI] [PubMed] [Google Scholar]
- 12.Petersen J, Lo P, Nielsen M, Edula G, Ashraf H, Dirksen A, De Bruijne M. Quantitative analysis of airway abnormalities. In: Karssemeijer N, Summers RM, editors. Medical Imaging 2010: Computer-Aided Diagnosis. Conf Proc of SPIE. Bellingham: SPIE; 2010. p. 76241S. [Google Scholar]
- 13.Nakamura M, Wada S, Miki T, Shimada Y, Suda Y, Tamura G. Automated segmentation and morphometric analysis of the human airway tree from multidetector CT images. J Physiol Sci. 2008;58:493–498. doi: 10.2170/physiolsci.RP007408. [DOI] [PubMed] [Google Scholar]
- 14.Cheng I, Nilufar S, Flores-Mir C, Basu A, Airway segmentation and measurement in CT images. Conf Proc IEEE EMBS, pp. 795–799, 2007. [DOI] [PubMed]
- 15.Li K, Wu X, Chen DZ, Sonka M. Optimal surface segmentation in volumetric images—a graph-theoretic approach. IEEE Trans Pattern Anal Mach Intel. 2006;28:119–134. doi: 10.1109/TPAMI.2006.19. [DOI] [PMC free article] [PubMed] [Google Scholar]
- 16.Estepar RSJ, Reilly JJ, Silverman EK, Washko GR. Three-dimensional airway measurements and algorithms. Proc Am Thorac Soc. 2008;5:905–909. doi: 10.1513/pats.200809-104QC. [DOI] [PubMed] [Google Scholar]
- 17.D’Souza ND, Reinhardt JM, Hoffman EA, ASAP: Interactive quantification of 2D airway geometry, Proc. SPIE Conf. Medical Imaging, Newport Beach, CA, Feb. 10–15, 1996, vol. 2709, pp. 180–196.
- 18.Sluimer I, Schilham A, Prokop M, van Ginneken B. Computer analysis of CT scans of the lung: a survey. IEEE Trans. Medical Imaging. 2006;25:385–405. doi: 10.1109/TMI.2005.862753. [DOI] [PubMed] [Google Scholar]
- 19.Tschirren J, Hoffman EA, McLennan G, Sonka M. Intrathoracic airway trees: segmentation and airway morphology analysis from low-dose CT scans. IEEE Trans. Medical Imaging. 2005;24:1529–1539. doi: 10.1109/TMI.2005.857654. [DOI] [PMC free article] [PubMed] [Google Scholar]
- 20.Gurcan MN, Sahiner B, Petrick N, Chan H-P, Kazerooni EA, Cascade PN, Hadjiiski LM. Lung nodule detection on thoracic computed tomography images: preliminary evaluation of a computer-aided diagnosis system. Med Phys. 2002;29:2552–2558. doi: 10.1118/1.1515762. [DOI] [PubMed] [Google Scholar]
- 21.King GG, Muller NL, Whittall KP, Xiang QS, Pare PD. An analysis algorithm for measuring airway lumen and wall areas from high-resolution computed tomographic data. Am J Respir Crit Care Med. 2000;161:574–580. doi: 10.1164/ajrccm.161.2.9812073. [DOI] [PubMed] [Google Scholar]
- 22.Brown RH, Herold CJ, Hirshman CA, Zerhouni EA, Mitzner W. In vivo measurements of airway reactivity using high-resolution computed tomography. Am Rev Respir Dis. 1991;144:208–212. doi: 10.1164/ajrccm/144.1.208. [DOI] [PubMed] [Google Scholar]
- 23.McNittGray MF, Goldin JG, Johnson TD, Tashkin DP, Aberle DR. Development and testing of image-processing methods for the quantitative assessment of airway hyperresponsiveness from high-resolution CT images. J Comput Assist Tomogr. 1997;21:939–947. doi: 10.1097/00004728-199711000-00017. [DOI] [PubMed] [Google Scholar]
- 24.Amirav I, Kramer SS, Grunstein MM, Hoffman EA. Assessment of methacholine-induced airway constriction by ultrafast high-resolution computed tomography. J Appl Physiol. 1993;75:2239–2250. doi: 10.1152/jappl.1993.75.5.2239. [DOI] [PubMed] [Google Scholar]
- 25.Nakano Y, Muro S, Sakai H, Hirai T, Chin K, Tsukino M, et al. Computed tomographic measurements of airway dimensions and emphysema in smokers. Correlation with lung function. Am J Respir Crit Care Med. 2000;162:1102–1108. doi: 10.1164/ajrccm.162.3.9907120. [DOI] [PubMed] [Google Scholar]
- 26.Berger P, Perot V, Desbarats P, Tunon-de-Lara JM, Marthan R, Laurent F. Airway wall thickness in cigarette smokers: quantitative thin-section CT assessment. Radiology. 2005;235:1055–1064. doi: 10.1148/radiol.2353040121. [DOI] [PubMed] [Google Scholar]
- 27.Montaudon M, Berger P, de Dietrich G, Braquelaire A, Marthan R, Tunon-de-Lara JM, et al. Assessment of airways with three-dimensional quantitative thin-section CT: in vitro and in vivo validation. Radiology. 2007;242:563–572. doi: 10.1148/radiol.2422060029. [DOI] [PubMed] [Google Scholar]
- 28.Saba O, Hoffman EA, Reinhardt JM. Maximizing quantitative accuracy of lung airway lumen and wall measures obtained from X-ray CT imaging. J. Applied Physiology. 2003;95:1063–1075. doi: 10.1152/japplphysiol.00962.2002. [DOI] [PubMed] [Google Scholar]
- 29.Reinhardt JM, D’Souza ND, Hoffman EA. Accurate measurement of intra-thoracic airways. IEEE Trans. Medical Imaging. 1997;16:820–827. doi: 10.1109/42.650878. [DOI] [PubMed] [Google Scholar]
- 30.Nakano Y, Wong JC, de Jong PA, Buzatu L, Nagao T, Coxson HO, et al. The prediction of small airway dimensions using computed tomography. Am J Respir Crit Care Med. 2005;171:142–146. doi: 10.1164/rccm.200407-874OC. [DOI] [PubMed] [Google Scholar]
- 31.Venkatraman R, Raman R, Raman B, Moss RB, Rubin GD, Mathers LH, et al. Fully automated system for three-dimensional bronchial morphology analysis using volumetric multidetector computed tomography of the chest. J Digit Imaging. 2006;19:132–139. doi: 10.1007/s10278-005-9240-0. [DOI] [PMC free article] [PubMed] [Google Scholar]
- 32.Mumcuoglu EU, Prescott J, Baker BN, Clifford B, Long F, Castile R, Gurcan MN: Image Analysis for Cystic Fibrosis: Automatic Lung Airway Wall and Vessel Measurement on CT Images. IEEE EMBC 2009:3545–8, 2009 [DOI] [PubMed]
- 33.Long FR, Castile RG, Brody AS, Hogan MJ, Flucke RL, Filbrun DA, McCoy KS. Lungs in infants and young children: improved thin-section CT with a noninvasive controlled ventilation technique—initial experience. Radiology. 1999;212:588–593. doi: 10.1148/radiology.212.2.r99au06588. [DOI] [PubMed] [Google Scholar]
- 34.Long FR, Castile RG. Technique and clinical applications of full-inflation and end-exhalation controlled-ventilation chest CT in infants and young children. Pediatr Radiol. 2001;31:413–422. doi: 10.1007/s002470100462. [DOI] [PubMed] [Google Scholar]
- 35.Mueller KS, Long FR, Flucke RL, Castile RG. Volume-monitored chest CT: a simplified method for obtaining motion-free images near full inspiratory and end expiratory lung volumes. Pediatr Radiol. 2010;40:1663–1669. doi: 10.1007/s00247-010-1671-1. [DOI] [PubMed] [Google Scholar]
- 36.King GG, Muller NL, Pare PD. Evaluation of airways in obstructive pulmonary disease using high-resolution computed tomography. Am J Respir Crit Care Med. 1999;159:992–1004. doi: 10.1164/ajrccm.159.3.9805064. [DOI] [PubMed] [Google Scholar]
- 37.Webb WR, Muller NL, Naidich DP. High-Resolution CT of the Lung. Philadelphia: Lippincott Williams and Wilkins; 2001. [Google Scholar]
- 38.Lum S, Stocks J, Castile RG, Davis S, Henschen M, Jones M, et al. Standards for infant pulmonary function testing: raised volume forced expirations in infants: guidelines for current practice. ATS/ERS Consensus Statement. Am J Respir Crit Care Med. 2005;172:1463–1471. doi: 10.1164/rccm.200408-1141ST. [DOI] [PubMed] [Google Scholar]
- 39.Miller MR, Hankinson J, Brusasco V, Burgos F, Casaburi R, Coates A, ATS/ERS Task Force et al. Standardisation of spirometry. Eur Respir J. 2005;26:319–338. doi: 10.1183/09031936.05.00034805. [DOI] [PubMed] [Google Scholar]
- 40.Jones M, Castile R, Davis S, Kisling J, Filbrun D, Flucke R, et al. Forced expiratory flows and volumes in infants: normative data and lung growth. Am J Respir Crit Care Med. 2000;161:353–359. doi: 10.1164/ajrccm.161.2.9903026. [DOI] [PubMed] [Google Scholar]
- 41.Stanojevic S, Wade A, Stocks J, Hankinson J, Coates AL, Pan H, et al. Reference ranges for spirometry across all ages: a new approach. Am J Respir Crit Care Med. 2008;177:253–260. doi: 10.1164/rccm.200708-1248OC. [DOI] [PMC free article] [PubMed] [Google Scholar]
- 42.Cheng Y, Sato Y, Tanaka H, Nishii T, Sugano N, Nakamura H, et al. Accurate thickness measurement of two adjacent sheet structures in CT images. IEICE Transactions on Information and Systems. 2007;E90-D(1):271–282. doi: 10.1093/ietisy/e90-1.1.271. [DOI] [Google Scholar]
- 43.Streekstra GJ, Strackee SD, Maas M, ter Wee R, Venema HW. Model-based cartilage thickness measurement in the submillimeter range. Med Phys. 2007;34:3562–3570. doi: 10.1118/1.2766759. [DOI] [PubMed] [Google Scholar]
- 44.Ionescu CM, Segers P, Keyser RD. Mechanical properties of the respiratory system derived from morphologic insight. IEEE Trans. on Biomed Engineering. 2009;56:949–959. doi: 10.1109/TBME.2008.2007807. [DOI] [PubMed] [Google Scholar]
- 45.Schwarzband G, Kiryati N. The point spread function of spiral CT. Phys Med Biol. 2005;50:5307–5322. doi: 10.1088/0031-9155/50/22/007. [DOI] [PubMed] [Google Scholar]
- 46.Williamson JP, James AL, Phillips MJ, Sampson DD, Hillman DR, Eastwood PR. Breakthrough in respiratory medicine: quantifying tracheobronchial tree dimensions: methods, limitations and emerging techniques. EurRespirJ. 2009;34:42–55. doi: 10.1183/09031936.00020408. [DOI] [PubMed] [Google Scholar]
- 47.Luenberger DG, Ye Y. Linear and Nonlinear Programming. 3. New York: Springer; 2008. [Google Scholar]
- 48.Bland JM, Altman DG. Statistical methods for assessing agreement between two methods of clinical measurement. Lancet. 1986;1:307–310. doi: 10.1016/S0140-6736(86)90837-8. [DOI] [PubMed] [Google Scholar]


