

Abstract
Background: Bisphenol A (BPA) is widely used in the manufacture of polycarbonate plastic bottles, food and beverage can linings, thermal receipts, and dental sealants. Animal and human studies suggest that BPA may disrupt thyroid function. Although thyroid hormones play a determinant role in human growth and brain development, no studies have investigated relations between BPA exposure and thyroid function in pregnant women or neonates.
Objective: Our goal was to evaluate whether exposure to BPA during pregnancy is related to thyroid hormone levels in pregnant women and neonates.
Methods: We measured BPA concentration in urine samples collected during the first and second half of pregnancy in 476 women participating in the CHAMACOS (Center for the Health Assessment of Mothers and Children of Salinas) study. We also measured free thyroxine (T4), total T4, and thyroid-stimulating hormone (TSH) in women during pregnancy, and TSH in neonates.
Results: Associations between the average of the two BPA measurements and maternal thyroid hormone levels were not statistically significant. Of the two BPA measurements, only the one taken closest in time to the TH measurement was significantly associated with a reduction in total T4 (β = –0.13 µg/dL per log2 unit; 95% CI: –0.25, 0.00). The average of the maternal BPA concentrations was associated with reduced TSH in boys (–9.9% per log2 unit; 95% CI: –15.9%, –3.5%) but not in girls. Among boys, the relation was stronger when BPA was measured in the third trimester of pregnancy and decreased with time between BPA and TH measurements.
Conclusion: Results suggest that exposure to BPA during pregnancy is related to reduced total T4 in pregnant women and decreased TSH in male neonates. Findings may have implications for fetal and neonatal development.
Keywords: bisphenol A, endocrine disruption, neonates, pregnancy, thyroid hormone
Bisphenol A (BPA) is widely used in the manufacture of polycarbonate plastic bottles, epoxy resins used in the inner lining of food and beverage cans, thermal receipts, medical equipment, tableware, and water supply pipes. Approximately 2.4 billion pounds of BPA were produced in the United States in 2007 [U.S. Environmental Protection Agency (EPA) 2010], and 95% of U.S. women of reproductive age (18–44 years) from the 2007–2008 National Health and Nutrition Examination Survey (NHANES) had detectable BPA levels in their urine [Centers for Disease Control and Prevention (CDC) 2011]. Unconjugated BPA has been detected in cord blood, placental tissue, and amniotic fluid, suggesting that the chemical can cross the placenta (Ikezuki et al. 2002; Schonfelder et al. 2002). Following a review of BPA’s potential to cause adverse reproductive and developmental effects, the National Toxicology Program (NTP) published a report in 2008 expressing “some concern” (the midpoint of a five-level scale) that current human exposure to BPA resulted in adverse effects on brain development and behavior in fetuses, infants, and children (Chapin et al. 2008).
Thyroid hormones (TH) play an essential role in pre- and postnatal growth and brain development in humans. Although severe maternal and neonatal thyroid insufficiency or overactivity has been known to alter cognition, behavior, and growth for more than a century (Dunn 1993), more recent evidence suggests that mild alterations in thyroid function may also influence these outcomes (Pop et al. 1999). Potential effects of BPA on cognition and behavior may thus be attributable in part to disruption of thyroid function.
Experimental evidence offers some support for this hypothesis. For instance, one in vitro study reported that BPA antagonized the ability of TH to affect oligodendrocyte differentiation (Seiwa et al. 2004). Moriyama et al. (2002) also found that BPA binds to the thyroid receptor (TR), antagonizes triiodothyronine (T3) binding to the TR, and inhibits TR-mediated gene expression in vitro. Furthermore, an animal study suggested that oral exposure to BPA results in a nonmonotonic transitory decrease in free, but not total, thyroxine (T4) in pregnant rats (Xu et al. 2007). Prenatal exposure to BPA, on the other hand, was related to a transitory dose-related elevation in total T4 among both male and female pups in one study (Zoeller et al. 2005) and in a nonmonotonic increase in free T4 (at postnatal day 7) followed by a decrease (at postnatal day 21) among male pups only in another study (Xu et al. 2007); a third study found no effect of prenatal BPA exposure on total T4 (Kobayashi et al. 2005). The studies by Zoeller et al. (2005) and Xu et al. (2007) found effects at the lowest doses administered (1 mg/kg body weight and 0.1 mg/L drinking water, respectively). Studies conducted in nonpregnant animals generally found no effect of BPA on thyroid hormone levels (Nieminen et al. 2002; Seidlova-Wuttke et al. 2005).
Four human studies have examined relations between exposure to BPA and thyroid function, yielding conflicting results. Meeker et al. (2010) found no association between serum free T4, total T3, and thyroid-stimulating hormone (TSH) and BPA concentrations in urine samples collected the same day in 167 men seeking treatment at an infertility clinic in Boston, Massachusetts. However, when BPA urinary concentrations in samples collected at multiple time points (1–3 measurements taken 3–75 days apart) were considered, their geometric means (GM) were associated with depressed TSH. In addition, BPA urinary concentrations were positively associated with free T3 among factory workers with high occupational exposure (Wang et al. 2012). Sugiura-Ogasawara et al. (2005), on the other hand, found no significant relation between hypothyroidism (generally diagnosed based on elevated TSH levels) and BPA urine concentration among Japanese women with a history of recurrent miscarriages (8 hypothyroidism cases and 37 controls), but the authors did not examine relations with low TSH. Finally, in a recently published study based on NHANES data, Meeker and Ferguson (2011) found a marginally significant (p = 0.08) inverse relation between urine BPA concentration and total T4 among 1,367 adults ≥ 20 years of age (–5.4% per ln unit; 95% CI: 0.01, –11.3) but not among 329 adolescents 12–19 years of age. The association among adults reached statistical significance (p = 0.049) when sampling weights were ignored.
Although TH is essential to normal fetal and neonatal brain development and growth, no human studies have investigated associations between exposure to BPA during pregnancy and maternal or neonatal thyroid hormone levels. Our objective was thus to determine whether maternal exposure to BPA during pregnancy, estimated based on BPA urinary concentration, was associated with maternal or neonatal TH levels in a Mexican-American population living in the Salinas Valley, California.
Methods
Participants. We collected data as part of the Center for the Health Assessment of Mothers and Children of Salinas (CHAMACOS), a longitudinal birth cohort study of environmental exposures and health among pregnant women and children. Women were eligible to participate in this study if they spoke Spanish or English, were ≥ 18 years old, had completed < 20 weeks gestation, and qualified for California’s low-income health insurance program. We enrolled participants (n = 601) between October 1999 and October 2000. We excluded women from the present analyses if they had twins (n = 5), had a miscarriage (n = 20) or stillborn baby (n = 3), were lost to follow-up (n = 40), were taking medication that could affect TH levels (n = 1), or did not have a BPA urine measurement during pregnancy (n = 28). TH was not measured in 169 mothers due to insufficient serum volume, leaving a final sample of 335 for the maternal analyses. For the analyses of neonatal TSH, we excluded 2 neonatal deaths and 138 neonates for whom TSH measures (n = 114) or age at heel stick (n = 24) were missing from medical records. A total of 364 mother–child pairs were included in the neonatal analyses; 476 women were included in at least one analysis. We obtained written informed consent from all participants and all research was approved by the University of California (UC), Berkeley, Committee for the Protection of Human Subjects before commencement of the study. CDC relied on the UC Berkeley Committee.
Interviews. We interviewed participants at enrollment (~ 13 weeks gestation) and near the end of the second trimester (~ 26 weeks gestation) using structured questionnaires. We collected information on demographics including maternal age, race/ethnicity, education, country of birth, and time lived in the United States. We also collected information on smoking, alcohol consumption, and drug use during pregnancy. In addition, we obtained data on iodine intake during pregnancy using a modified version of the Spanish-language Block 98 Questionnaire (Block et al. 1990; Harley et al. 2005)
Sample analysis. Measurement of thyroid hormone. We collected maternal blood samples during the second interview and processed them immediately after collection. Samples were stored at –80°C at the UC Berkeley School of Public Health Biorepository until analysis. A pilot study showed that the number of freeze–thaw cycles was related to an increase in free T4 (data not shown). Samples were thus thawed only once, shipped refrigerated and analyzed for TH by Quest Diagnostics’ Nichols Institute (San Juan Capistrano, CA) within 48 hr. Free T4 was measured using direct equilibrium dialysis followed by radioimmunoassay (Nelson and Tomei 1988), which provides accurate measurements despite pregnancy-induced elevations in T4-bound proteins (Nelson et al. 1994). Total T4 and TSH were measured in maternal serum using solid-phase immunochemiluminometric assays (Bayer ADVIA Centaur system; Siemens Healthcare Diagnostics, Deerfield, IL). The limits of detection (LODs) were 0.1 ng/dL for free T4, 0.1 µg/dL for total T4, and 0.01 mIU/L for TSH.
Neonatal TSH is routinely measured by the California Department of Health Services Genetic Diseases Branch (Richmond, CA) as part of the state’s Newborn Screening Program. Blood spots were collected soon after birth [median = 21 hr; interquartile range (IQR) = 17–26 hr] by heel stick on filter paper and were analyzed using a solid-phase, time-resolved sandwich fluoroimmunoassay (AutoDELFIA; PerkinElmer, Wellesley, MA). The LOD was 2 mIU/L. Neonatal TSH and age (hours) at the time of heel stick were abstracted from medical records by a registered nurse.
Measurement of BPA. We collected spot urine samples from participants in sterile, polypropylene, BPA-free urine cups during the first (12.4 ± 3.8 weeks gestation) and second half (26.2 ± 2.2 weeks gestation) of pregnancy. Samples were stored at –80°C until shipment on dry ice to the CDC (Atlanta, GA) for analysis. The total urinary concentration of BPA (free and conjugated species) was measured using online solid-phase extraction coupled with isotope dilution–high performance liquid chromatography–negative ion–atmospheric pressure chemical ionization–tandem mass spectrometry (Ye et al. 2005). The LOD was 0.4 µg/L. Blank samples as well as low (~ 2.8 μg/L) and high (~ 10 μg/L) concentration materials were included in each run as quality control measures. Analysis of field blanks showed no contamination by BPA using this collection protocol. To account for urine dilution, we determined creatinine concentration using a commercially available diagnostic assay (Vitros CREA slides; Ortho Clinical Diagnostics, Raritan, NJ) for all specimens and measured specific gravity using a hand-held refractometer (National Instrument Company, Baltimore, MD) for 88.9% and 94.9% of samples included in the maternal and neonatal TH analyses, respectively.
Measurement of other environmental chemicals. Lead concentration was measured in maternal blood by the California Department of Public Health by graphite furnace atomic absorption spectrophotometry. Serum polychlorinated biphenyls (PCBs), hexachlorobenzene (HCB), and polybrominated diphenyl ether (PBDE) flame retardants were measured by the CDC using gas chromatography/isotope-dilution high-resolution mass spectrometry (Castorina et al. 2011; Sjödin et al. 2004). We collected samples for these analyses at the end of the second trimester of gestation (mean ± SD = 27 ± 3 weeks gestation).
Statistical analysis. We used analysis of variance (ANOVA) to compare BPA urinary concentrations across variable categories and Pearson’s correlations to evaluate bivariate associations between continuous variables. Because animal studies have suggested nonmonotonic dose responses between BPA and TH levels (Xu et al. 2007), we ran generalized additive models (GAM) with a 3-degrees-of-freedom cubic spline including covariates selected for the final models, to evaluate the shape of exposure–response curves in our study population. None of the tests for digression from linearity were significant (p < 0.15), suggesting that relations did not depart from linearity. We therefore included linear terms for BPA in multiple linear regression models. We expressed exposure as the average of the two (first and second half of pregnancy) BPA measurements. BPA urine concentrations were heavily right-skewed and thus were log2-transformed to reduce the influence of outliers. We log10-transformed TSH to normalize residuals; free and total T4 were expressed on the arithmetic scale. Regression coefficients thus represent mean (free and total T4) or percent (TSH) change in outcomes for each doubling in BPA concentration. In addition, we ran multiple logistic regressions, categorizing TH as normal versus above or below their respective reference ranges.
We considered the following variables that may influence TH levels as potential confounders (expressed as shown in Table 1 or in parentheses): maternal age (continuous), race/ethnicity, education, family income, country of birth, number of years spent in the United States, parity, gestational age at the time of blood collection (for maternal TH analyses only; weeks, continuous), iodine intake (continuous), and smoking, alcohol consumption, and illegal drug use during pregnancy. For neonatal TSH analyses, we also considered sex, delivery mode, and age at the time of heel stick (hours, continuous). TSH surges at birth and sharply declines during the first few days of life (Brown et al. 2005). Our previous work suggests that age at the time of TSH measurement is a strong confounder for associations with other environmental contaminants in the CHAMACOS population (Chevrier et al. 2007, 2011). We thus used GAMs and applied cubic splines to this variable to minimize residual confounding. Finally, based on results from prior studies in this population (Chevrier et al. 2007, 2008, 2010), we considered environmental exposures such as (log10-transformed) blood lead (micrograms per deciliter), total serum PCBs, HCB, and PBDE flame retardants (nanograms per gram lipids) for inclusion in models. We included covariates in final models if they were associated with both TH and BPA (p < 0.20) in bivariate analyses. For analyses of maternal TH, final models comprised mother’s age, education level, country of birth, poverty level, alcohol and drug use during pregnancy, iodine intake, and HCB and PCB serum concentrations. Final models of neonatal TSH included mother’s country of birth and child’s age at thyroid hormone measurement.
Table 1.
Geometric mean (GSD) of average urinary BPA concentrations (μg/g creatinine) during pregnancy by demographic characteristics in CHAMACOS study participants.
| Characteristic | Maternal TH analyses (n = 335) | Neonatal TSH analyses (n = 364) | ||||||
|---|---|---|---|---|---|---|---|---|
| n (%) | GM (GSD) | n (%) | GM (GSD) | |||||
| Maternal characteristics | ||||||||
| Age (years) | ||||||||
| 18–24 | 158 (47) | 1.3 (2.0) | 186 (51) | 1.3 (1.9) | ||||
| 25–29 | 109 (33) | 1.3 (1.8) | 105 (29) | 1.3 (1.8) | ||||
| 30–34 | 44 (13) | 1.1 (2.2) | 47 (13) | 1.2 (2.2) | ||||
| 35–45 | 24 (7) | 1.5 (2.3) | 26 (7) | 1.8 (2.9) | ||||
| Race/ethnicity | ||||||||
| Caucasian | 7 (2) | 1.6 (2.0) | 4 (1) | 1.0 (1.5) | ||||
| Latino | 321 (96) | 1.3 (2.0) | 351 (96) | 1.3 (2.0) | ||||
| Other | 7 (2) | 1.8 (1.7) | 9 (3) | 2.0 (1.7) | ||||
| Education | ||||||||
| ≤ 6th grade | 141 (42) | 1.2 (2.0) | 153 (42) | 1.3 (2.0) | ||||
| 7–12th grade | 117 (35) | 1.3 (2.1) | 130 (36) | 1.3 (2.2) | ||||
| ≥ High school | 77 (23) | 1.3 (1.9) | 81 (22) | 1.3 (1.8) | ||||
| Family income | ||||||||
| ≤ Poverty line | 205 (61) | 1.2 (2.0) | 217 (60) | 1.3 (2.1) | ||||
| Poverty line to 200% | 117 (35) | 1.3 (2.0) | 133 (37) | 1.3 (2.0) | ||||
| > Poverty line | 13 (4) | 1.7 (1.6) | 14 (4) | 1.8 (1.6) | ||||
| Country of birth | ||||||||
| United States | 41 (12) | 1.4 (2.0) | 51 (14) | 1.5 (2.1) | ||||
| Mexico | 287 (86) | 1.2 (2.0) | 305 (84) | 1.3 (2.0) | ||||
| Other | 7 (2) | 1.6 (1.8) | 8 (2) | 1.5 (2.0) | ||||
| Time in United States (years) | ||||||||
| ≤ 1 | 84 (25) | 1.2 (1.9) | 89 (24) | 1.1 (1.9) | ||||
| 2–5 | 99 (30) | 1.2 (2.1) | 96 (26) | 1.2 (2.1) | ||||
| 6–10 | 77 (23) | 1.3 (1.9) | 87 (24) | 1.3 (2.0) | ||||
| ≥ 11 | 41 (12) | 1.4 (2.1) | 50 (14) | 1.6 (2.2) | ||||
| Entire life | 34 (10) | 1.5 (2.1) | 42 (12) | 1.5 (2.1)* | ||||
| Parity | ||||||||
| 0 | 111 (33) | 1.2 (1.9) | 134 (37) | 1.2 (1.9) | ||||
| ≥ 1 | 224 (67) | 1.3 (2.0) | 230 (63) | 1.4 (2.1) | ||||
| Smoking during pregnancy | ||||||||
| Yes | 23 (7) | 1.5 (2.0) | 17 (5) | 1.4 (2.1) | ||||
| No | 312 (93) | 1.2 (2.0) | 347 (95) | 1.3 (2.0) | ||||
| Alcohol during pregnancy | ||||||||
| Yes | 4 (1) | 1.1 (1.5) | 3 (1) | 1.6 (1.0) | ||||
| No | 331 (99) | 1.3 (2.0) | 361 (99) | 1.3 (2.0) | ||||
| Illegal drug use during pregnancy | ||||||||
| Yes | 5 (2) | 1.3 (1.3) | 5 (1) | 2.1 (1.7) | ||||
| No | 330 (98) | 1.3 (2.0) | 359 (99) | 1.3 (2.0) | ||||
| Prepregnancy body mass index (kg/m2) | ||||||||
| < 25 | 128 (40) | 1.3 (2.0) | 136 (38) | 1.4 (2.1) | ||||
| 25–30 | 128 (40) | 1.2 (1.9) | 138 (39) | 1.2 (1.8) | ||||
| > 30 | 66 (21) | 1.3 (2.3) | 82 (23) | 1.4 (2.2) | ||||
| Infant characteristics | ||||||||
| Sex | ||||||||
| Male | 188 (52) | 1.3 (1.9) | ||||||
| Female | 176 (48) | 1.3 (2.1) | ||||||
| Birth weight (g) | ||||||||
| < 2,500 | 13 (4) | 1.6 (1.6) | ||||||
| 2,500–3,500 | 189 (52) | 1.2 (1.9) | ||||||
| > 3,500 | 162 (45) | 1.3 (2.2) | ||||||
| Gestational age at birth (weeks) | ||||||||
| < 37 | 21 (6) | 1.6 (1.9) | ||||||
| 37–42 | 343 (94) | 1.3 (2.0) | ||||||
| > 42 | 0 (0) | — (—) | ||||||
| *p < 0.05 based on analysis of variance (ANOVA). | ||||||||
BPA has a short half-life in humans (< 6 hr) (Volkel et al. 2002), and some experimental studies suggest that exposure to BPA may have a transitory effect on TH (Xu et al. 2007; Zoeller et al. 2005). Given these data, we hypothesized that potential relationships between BPA and TH may be stronger when the time between the two measurements was shorter. We tested this hypothesis by conducting additional analyses using the BPA measurement that was closest, and the one farthest, in time to the TH measurement. For the neonatal TSH analysis, we also conducted stratified analysis by examining exposure in each trimester of pregnancy. Finally, we considered interaction by iodine intake dichotomized using the U.S. Institute of Medicine recommended daily allowance of 220 μg/day during pregnancy as the cutoff (Otten et al. 2006) based on the hypothesis that women with low iodine intake may be more susceptible to TH disruption. For neonates, we also examined effect modification by sex based on results from experimental studies (Xu et al. 2007) and by age (dichotomized at 24 hr). We set statistical significance at p < 0.05 for main effects and p < 0.10 for effect modification.
For concentrations below the LOD, we used values generated by the instrument when available. Otherwise (e.g., when no signal was detected), we imputed values at random based on a log-normal probability distribution whose parameters were determined by maximum likelihood estimation (Lubin et al. 2004). This method has been shown to yield reasonable estimates when detection frequencies are > 70%. We had complete data on most covariates. We imputed values of missing covariates (≤ 5%) at random based on observed probability distributions.
We conducted sensitivity analysis to evaluate the robustness of our results. We first re-ran models after excluding outliers identified using the generalized extreme studentized deviate many-outlier procedure (Rosner 1983). We also determined whether the method that we chose to adjust for urine dilution (i.e., by dividing urinary BPA by creatinine concentration) affected our results by running models with unadjusted (with and without controlling for creatinine in models) and specific gravity–adjusted BPA concentrations. Finally, we applied inverse probability weights in an attempt to account for selection bias due to exclusion from final models (Hernan et al. 2004). We determined weights by multiple logistic regression whose independent variables were selected based on a deletion–substitution–addition algorithm (Sinisi and van der Laan 2004). Estimates from all of the above models were similar (data not shown). We present results using creatinine-adjusted BPA and including outliers in unweighted regression models.
Results
Participant characteristics. Study participants were primarily young (80% < 30 years of age) Latinas (96%) born in Mexico (84–86%) who had immigrated to the United States within 10 years of enrollment (74–78%) (Table 1). Most women had low income (60–61% below the federal poverty line) and educational attainment (77–78% did not complete high school), and many were multiparous (63–67%). Few women smoked (5–7%), consumed ≥ 1 alcoholic drink per week (1%), or used illegal drugs (1–2%) during pregnancy. There were slightly more male (52%) than female infants. Only 4% of infants were born at low birth weight (< 2,500 g), and 6% were preterm (< 37 weeks gestation). As many as 8.2% of women had iodine intakes below the recommended daily allowance.
Maternal BPA urine concentrations. BPA was detected in 82% of samples. Median BPA concentrations were similar in the first and second half of pregnancy (Table 2) as well as for BPA measurements closest and farthest in time to thyroid hormone measurements (medians = 1.1–1.2 μg/g creatinine) [see Supplemental Material, Table S1 (http://dx.doi.org/10.1289/ehp.1205092)]. BPA concentrations measured in the first and second half of pregnancy were weakly but significantly correlated with Pearson’s and intraclass correlation coefficients of 0.16 each (p < 0.01). Women who had lived their entire life in the United States (GM = 1.5 µg/g creatinine) had higher BPA urine concentrations than those who lived in the United States ≤ 1 year (GM = 1.1–1.2 µg/g creatinine) (Table 1). Median BPA concentrations in our study population were lower than in women of reproductive age (18–44 years) in the 2007–2008 NHANES sample (median = 1.9 μg/g creatinine; IQR = 1.2–3.4) (CDC 2011).
Table 2.
Urinary BPA concentrations (µg/g creatinine) during pregnancy in CHAMACOS study participants in samples included in analyses of maternal (n = 335) and neonatal (n = 364) serum TH levels.
| Timing of measurement | n | Percentile | Range | GM (GSD) | Detection frequency (%) | |||||||||
|---|---|---|---|---|---|---|---|---|---|---|---|---|---|---|
| 25th | 50th | 75th | ||||||||||||
| Maternal TH analyses | ||||||||||||||
| First half of pregnancy | 290 | 0.6 | 1.1 | 1.8 | < LOD–27 | 1.1 (2.3) | 82 | |||||||
| Second half of pregnancy | 317 | 0.7 | 1.1 | 1.9 | < LOD–37 | 1.2 (2.2) | 81 | |||||||
| Pregnancy average | 335 | 0.8 | 1.2 | 1.9 | < LOD–19 | 1.3 (2.0) | 82 | |||||||
| Neonatal TSH analyses | ||||||||||||||
| First half of pregnancy | 309 | 0.7 | 1.1 | 1.9 | < LOD–27 | 1.1 (2.3) | 83 | |||||||
| Second half of pregnancy | 344 | 0.7 | 1.1 | 1.8 | < LOD–37 | 1.2 (2.2) | 82 | |||||||
| Pregnancy average | 364 | 0.8 | 1.2 | 1.9 | < LOD–24 | 1.3 (2.0) | 82 | |||||||
| GSD, geometric standard deviation. LOD = 0.4 µg/L. | ||||||||||||||
Maternal and neonatal TH levels. Mean (± SD) serum concentrations of free and total T4 were 0.8 ± 0.2 ng/dL and 10.6 ± 1.6 μg/dL in maternal samples, respectively. The GM was 1.2 mIU/L (GSD = 1.7) for maternal TSH and 5.6 mIU/L (GSD = 1.8) for neonatal TSH. Based on trimester-specific laboratory reference ranges, four women had elevated free T4 (> 1.6 ng/dL) and 39 had low TSH (< 0.5 and < 0.8 mIU/L in second and third trimesters, respectively); none had high total T4 (> 17.8 and > 20.1 μg/dL in the second and third trimester, respectively). Seven women had low free T4 (< 0.5 ng/dL), 13 had low total T4 (< 8.0 μg/dL) and two had elevated TSH (> 4.6 and > 5.2 mIU/L in the second and third trimester, respectively). Seventeen had high TSH based on National Academy of Clinical Biochemistry guidelines (> 2.5 mIU/L) (Mandel et al. 2005). TSH was elevated (> 25 mIU/L) in one of the neonates.
Association between maternal BPA urine concentrations and maternal and neonatal TH levels. Maternal urinary BPA concentrations were not associated with maternal free T4 or TSH, but were negatively associated with maternal total T4 (Table 3). This association was not statistically significant using the average of the two BPA measurements (β = –0.13; 95% CI: –0.29, 0.02) or using the BPA measurements taken farthest in time (median = 95 days; IQR = 63–116) to total T4 serum measurements (β = –0.06; 95% CI: –0.20, 0.08), but was significant when the BPA measurements taken closest in time to total T4 measurements (median = 6 days; IQR = 0–15) were examined (β = –0.13; 95% CI: –0.25, 0.00). Average maternal urinary BPA was also related to increased odds of low total T4 [odds ratio (OR) = 1.6; 95% CI: 1.1, 2.3] and low TSH (OR = 1.5; 95% CI: 1.1, 2.0). Similar to results from linear regressions, associations were stronger when the BPA and TH measurements were taken closer together relative to when measurements were taken farther apart (data not shown).
Table 3.
Associations between maternal BPA urinary concentrations during pregnancy and TH levels in women and their neonates participating in the CHAMACOS study.
| Outcome | Exposure time | Unadjusted models | Adjusted models β (95% CI) | |||||
|---|---|---|---|---|---|---|---|---|
| n | β (95% CI) | |||||||
| Maternal TH analyses | ||||||||
| Free T4 | Closest measurement | 332 | 0.00 (–0.02, 0.02) | 0.00 (–0.02, 0.02) | ||||
| Free T4 | Farthest measurement | 332 | 0.01 (–0.01, 0.03) | 0.01 (–0.01, 0.03) | ||||
| Free T4 | Pregnancy average | 332 | 0.00 (–0.02, 0.03) | 0.00 (–0.02, 0.03) | ||||
| Total T4 | Closest measurement | 335 | –0.11 (–0.25, 0.02) | –0.13 (–0.25, 0.00)* | ||||
| Total T4 | Farthest measurement | 335 | –0.05 (–0.18, 0.09) | –0.06 (–0.20, 0.08) | ||||
| Total T4 | Pregnancy average | 335 | –0.12 (–0.28, 0.04) | –0.13 (–0.29, 0.02) | ||||
| TSHa | Closest measurement | 335 | –2.9 (–7.5, 2.0) | –3.5 (–8.2, 1.5) | ||||
| TSHa | Farthest measurement | 335 | 0.3 (–4.7, 5.4) | 0.1 (–4.9, 5.5) | ||||
| TSHa | Pregnancy average | 335 | –2.5 (–8.2, 3.6) | –3.3 (–9.2, 2.9) | ||||
| Neonatal TSH analyses | ||||||||
| TSHa | Closest measurement | 364 | –2.4 (–7.3, 2.7) | –2.0 (–6.1, 2.2) | ||||
| TSHa | Farthest measurement | 364 | –1.2 (–7.4, 5.4) | –0.5 (–5.2, 3.3) | ||||
| TSHa | Pregnancy average | 364 | –1.7 (–8.1, 5.2) | –1.8 (–4.2, 0.8) | ||||
| Coefficients represent the mean change (free and total T4) or percent change (TSH) in thyroid hormone levels for each doubling in maternal BPA urinary concentrations. Maternal TH models were adjusted for mother’s age, education level, country of birth, poverty level, alcohol and drug use during pregnancy, iodine intake, and hexachlorobenzene and polychlorinated biphenyl serum concentrations. Neonatal TSH models were adjusted for mother’s country of birth and child’s age at TSH measurement. aPercent change in TSH serum concentration calculated using the following formula: (10β–1) × 100. *p < 0.05. | ||||||||
Although maternal BPA urinary concentrations were not associated with neonatal TSH when both sexes were combined (Table 3), effect modification by sex was statistically significant (p = 0.01). Analyses stratified by sex revealed an inverse relationship among boys (–9.9% for every doubling in average BPA; 95% CI: –15.9%, –3.5%) but not girls (4.4% for every doubling in average BPA; 95% CI: –2.4%, 11.7) (Figure 1). Among boys, associations with neonatal TSH were stronger when maternal BPA urinary concentrations were measured in the third trimester of gestation (–9.3% for every doubling in BPA; 95% CI: –16.3%, –1.7%) than when BPA was measured in the first (–3.2%; 95% CI: –11.5%, 6.0%) or second (–5.1%; 95% CI: –11.3%, 1.6%) trimesters. Associations were weaker as the time between the BPA and TSH measurements increased. Results were similar to those obtained using third trimester BPA when analyses were restricted to the BPA samples collected closest in time to the TSH measurements (median = 92 days; IQR = 81–104) (data not shown). None of the above associations were significantly modified by iodine intake or age at the time of heel stick (data not shown).
Figure 1.
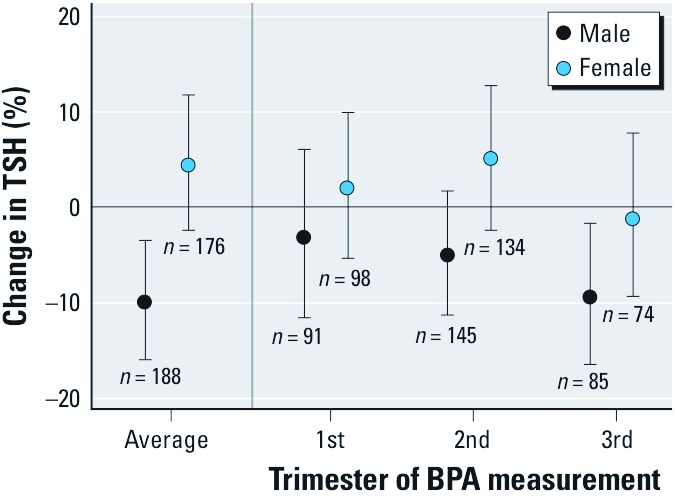
Change in neonatal TSH for each doubling in maternal urinary BPA concentration (µg/g creatinine) by infant sex and trimester of BPA measurement.
There were no statistically significant differences in demographic or lifestyle variables between participants included in maternal TH analyses relative to those excluded. Participants who were included in neonatal TSH analyses were more educated (22% ≥ high school education vs. 16%), were less likely to have used illegal drugs during pregnancy (2% vs. 5%), and delivered children with a higher birth weight (mean = 3,438 g vs. 3,314 g) (p < 0.05).
Discussion
We report significant inverse associations between maternal BPA urine concentrations during pregnancy and TSH in male, but not female, neonates after adjustment for covariates. The relationship among males was stronger when BPA was measured in the third trimester of gestation. We also found an inverse association between maternal urinary BPA and serum total T4 when analyses were restricted to the BPA measurement taken closest in time to the TH measurement. However, contrary to a previous study investigating relations between urinary perchlorate and serum TSH and T4 using NHANES data (Blount et al. 2006), we found no evidence of a stronger relation among women with low iodine intake.
This is the first study to evaluate associations between maternal BPA urine concentrations during pregnancy and maternal or neonatal TH in humans. Meeker and Ferguson (2011) reported a borderline significant (p = 0.08) inverse association between total T4 in serum and BPA concentrations in the urine of 1,367 adult NHANES participants, consistent with our findings. However, no association was found with free T4 or total T3 (total T4 was not measured) in a smaller study of 167 men from an infertility clinic, but an inverse relation with TSH was reported (Meeker et al. 2010). On the other hand, BPA urine concentrations were not found to be related to hypothyroidism in 45 Japanese women with a history of miscarriage (Sugiura-Ogasawara et al. 2005). In addition to sample size, inconsistent results may be attributable to differences in study populations. Whereas one study was conducted in a nationally representative sample (Meeker and Ferguson 2011), other investigations examined the question in individuals who may have suffered from medical conditions (Meeker et al. 2010; Sugiura-Ogasawara et al. 2005). In addition, prior studies examined relations between BPA and TH among nonpregnant adults only. Fetuses and pregnant women may however be particularly susceptible to BPA exposure. Livers of pregnant rats have been shown to have a lower capacity to glucuronidate BPA relative to nonpregnant rats (Inoue et al. 2005), and the human fetus has limited glucuronidation capacity (Ring et al. 1999).
Of interest is the apparent sexually dimorphic relationship of BPA and neonatal TSH, suggesting an association in males but not females. Although data from NHANES suggested that inverse relations between BPA and total T4 were similar for both sexes in adults (Meeker and Ferguson 2011), one experimental rat study found that exposure to BPA during pregnancy and postpartum was related to alterations in free T4 (total T4 was not measured) among male pups only (Xu et al. 2007). Furthermore, results from some animal studies suggest that males may not metabolize BPA as efficiently as females. For instance, mRNA expression of the uridinediphosphate glucuronyl transferase (UDP-GT) isoform UGT 2B1 [which glucuronidates BPA in rats (Yokota et al. 1999)] has been reported to be lower in male rats than in females (Takeuchi et al. 2004). In addition, exposure to BPA was found to lower the expression of UGT 2B1 in male rats but not in females (Shibata et al. 2002).
BPA is eliminated quickly in humans (half-life < 6 hr) (Volkel et al. 2002), and data from our study as well as others’ (Braun et al. 2011; Ye et al. 2011), which show that the between-person variance of creatinine-adjusted BPA measurements accounted for only 9–16% of the total variance, suggest that a large number of measurements may be necessary to assess exposure over the long term. Urinary BPA measurements may, however, be adequate to evaluate transitory effects. Some experimental studies suggest that exposure to BPA may have such effects on TH (Xu et al. 2007; Zoeller et al. 2005). Given these results, we hypothesized that relations between BPA and TH may be stronger when the time elapsed between the two measurements was shorter. Our finding that the association between urinary BPA and maternal serum total T4 was significant when BPA was measured closer in time, but not when measurements were farther apart, and that the relation with neonatal TSH was stronger when BPA was measured in the third trimester of pregnancy appears to support this hypothesis or may be attributable to a specific developmental window of susceptibility to BPA. It is noteworthy that effect estimates for the average BPA and the closer measurements were very similar albeit of slightly different precision. Average urinary BPA may therefore remain a useful measure in studies of thyroid hormone disruption.
BPA may affect thyroid function through a number of pathways. In addition to binding and activating the TR (Moriyama et al. 2002), BPA has been shown to induce UDP-GT activity in European polecats (Nieminen et al. 2002). Since UDP-GT regulates the rate-limiting step in T4 metabolism in rats and presumably in humans, induction of this enzyme could underlie the reduction in T4 observed in this study. However, contrary to some hydroxylated metabolites of other commonly measured environmental chemicals, such as PCBs and PBDEs, BPA binds only weakly to the transport proteins transthyretin and thyroxine-binding globulin (Marchesini et al. 2008). The finding of a reduction in total T4 but not free T4 was unexpected. This may be attributable to a BPA-induced reduction in the serum concentration of transport proteins, an increased elimination of free T4 compensated by a release of T4 from transport proteins, or a hepatic sequestration of T4 as observed following exposure of mice to PCB-153 (Kato et al. 2011).
Strengths of this study include the availability of data on a large number of potential confounders including iodine intake during pregnancy. Iodine is an essential component of TH and both iodine deficiency and excess can adversely affect thyroid function (Delange et al. 2001). Data from NHANES suggest that, although the United States is generally considered an iodine sufficient area, a significant proportion of pregnant U.S. women are iodine deficient (Caldwell et al. 2008). We also conducted sensitivity analysis and our results were robust to methods used to adjust for urine dilution (creatinine or specific-gravity adjustment) and to adjustment for selection bias due to exclusion from final models.
This study also has some limitations. Associations that we report were identified in an immigrant Mexican-American population with low socioeconomic status. Our results thus need to be confirmed in other populations to evaluate their generalizability. Although we considered many variables known to affect TH levels, unmeasured confounders may have affected our results. In addition, the health implications of a possible decrease in maternal total T4 with no reduction in free T4 is unclear because bound T4 is not biologically active (Mendel 1989). Similarly, we are aware of no studies that investigated the developmental effect of lower but normal neonatal TSH.
In summary, we report an inverse relation between BPA concentration in maternal urine and maternal serum total T4 during pregnancy. Although we cannot rule out that average BPA concentrations during pregnancy may be relevant, the association of maternal BPA and total T4 was stronger when they were measured closer together relative to further apart in time, suggesting a transient effect of BPA. Similarly, the relationship of maternal BPA and neonatal TSH was strongest when maternal BPA was measured in the third trimester compared with earlier in pregnancy. This may also suggest a transient effect of maternal BPA on neonatal TSH, or alternatively, a developmental window of susceptibility. We recommend that future studies examine relations between prenatal exposure to BPA and TH in children and/or adults to elucidate this question.
Supplemental Material
Acknowledgments
We gratefully acknowledge M. Vedar for her important contributions, and X. Ye, X. Zhou, T. Jia, and R. Hennings for technical assistance in measuring the urinary concentrations of BPA.
Footnotes
This publication was supported by grants RD 83171001 from the U.S. Environmental Protection Agency and RC ES018792 and P01 ES009605 from the National Institute of Environmental Health Sciences. Additional funding was provided by the University of California Institute for Mexico and the United States and the University of California Berkeley Center for Latino Policy Research.
The contents of this publication are solely the responsibility of the authors and do not necessarily represent funders’ or the Center for Disease Control and Prevention’s official views.
The authors declare they have no actual or potential competing financial interests.
References
- Block G, Woods M, Potosky A, Clifford C. Validation of a self-administered diet history questionnaire using multiple diet records. J Clin Epidemiol. 1990;43(12):1327–1335. doi: 10.1016/0895-4356(90)90099-b. [DOI] [PubMed] [Google Scholar]
- Blount BC, Pirkle JL, Osterloh JD, Valentin-Blasini L, Caldwell KL. Urinary perchlorate and thyroid hormone levels in adolescent and adult men and women living in the United States. Environ Health Perspect. 2006;114:1865–1871. doi: 10.1289/ehp.9466. [DOI] [PMC free article] [PubMed] [Google Scholar]
- Braun JM, Kalkbrenner AE, Calafat AM, Bernert JT, Ye X, Silva MJ, et al. Variability and predictors of urinary bisphenol A concentrations during pregnancy. Environ Health Perspect. 2011;119:131–137. doi: 10.1289/ehp.1002366. [DOI] [PMC free article] [PubMed] [Google Scholar]
- Brown RS, Huang SA, Fisher DA. Philadelphia, PA: Lippincott, Williams & Wilkins, 1013–1028; 2005. The maturation of thyroid function in the perinatal period and during childhood. In: Werner & Ingbar’s The Thyroid: A Fundamental and Clinical Text (Braverman LE, Utiger RD, eds) [Google Scholar]
- Caldwell KL, Miller GA, Wang RY, Jain RB, Jones RL. Iodine status of the U.S. population, National Health and Nutrition Examination Survey 2003–2004. Thyroid. 2008;18(11):1207–1214. doi: 10.1089/thy.2008.0161. [DOI] [PubMed] [Google Scholar]
- Castorina R, Bradman A, Sjödin A, Fenster L, Jones RS, Harley KG, et al. Determinants of serum polybrominated diphenyl ether (PBDE) levels among pregnant women in the CHAMACOS cohort. Environ Sci Technol. 2011;45(15):6553–6560. doi: 10.1021/es104295m. [DOI] [PMC free article] [PubMed] [Google Scholar]
- CDC (Centers for Disease Control and Prevention) National Health and Nutrition Examination Survey Data 2007–2008. Hyattsville, MD:CDC. 2011. Available: http://www.cdc.gov/nchs/nhanes/nhanes2007-2008/nhanes07_08.htm [accessed 20 November 2012]
- Chapin RE, Adams J, Boekelheide K, Gray LE, Jr, Hayward SW, Lees PS, et al. NTP-CERHR expert panel report on the reproductive and developmental toxicity of bisphenol A. Birth Defects Res B Dev Reprod Toxicol. 2008;83(3):157–395. doi: 10.1002/bdrb.20147. [DOI] [PubMed] [Google Scholar]
- Chevrier J, Eskenazi B, Bradman A, Fenster L, Barr DB. Associations between prenatal exposure to polychlorinated biphenyls and neonatal thyroid-stimulating hormone levels in a Mexican-American population, Salinas Valley, California. Environ Health Perspect. 2007;115:1490–1496. doi: 10.1289/ehp.9843. [DOI] [PMC free article] [PubMed] [Google Scholar]
- Chevrier J, Eskenazi B, Holland N, Bradman A, Barr DB. Effects of exposure to polychlorinated biphenyls and organochlorine pesticides on thyroid function during pregnancy. Am J Epidemiol. 2008;168(3):298–310. doi: 10.1093/aje/kwn136. [DOI] [PMC free article] [PubMed] [Google Scholar]
- Chevrier J, Harley KG, Bradman A, Gharbi M, Sjödin A, Eskenazi B. Polybrominated diphenyl ether (PBDE) flame retardants and thyroid hormone during pregnancy. Environ Health Perspect. 2010;118:1444–1449. doi: 10.1289/ehp.1001905. [DOI] [PMC free article] [PubMed] [Google Scholar]
- Chevrier J, Harley KG, Bradman A, Sjödin A, Eskenazi B. Prenatal exposure to polybrominated diphenyl ether flame retardants and neonatal thyroid-stimulating hormone levels in the CHAMACOS study. Am J Epidemiol. 2011;174(10):1166–1174. doi: 10.1093/aje/kwr223. [DOI] [PMC free article] [PubMed] [Google Scholar]
- Delange F, de Benoist B, Pretell E, Dunn JT. Iodine deficiency in the world: where do we stand at the turn of the century? Thyroid. 2001;11(5):437–447. doi: 10.1089/105072501300176390. [DOI] [PubMed] [Google Scholar]
- Dunn JT. Iodine supplementation and the prevention of cretinism. Ann NY Acad Sci. 1993;678:158–168. doi: 10.1111/j.1749-6632.1993.tb26119.x. [DOI] [PubMed] [Google Scholar]
- Harley K, Eskenazi B, Block G. The association of time in the US and diet during pregnancy in low-income women of Mexican descent. Paediatr Perinat Epidemiol. 2005;19(2):125–134. doi: 10.1111/j.1365-3016.2005.00640.x. [DOI] [PMC free article] [PubMed] [Google Scholar]
- Hernan MA, Hernandez-Diaz S, Robins JM. A structural approach to selection bias. Epidemiology. 2004;15(5):615–625. doi: 10.1097/01.ede.0000135174.63482.43. [DOI] [PubMed] [Google Scholar]
- Ikezuki Y, Tsutsumi O, Takai Y, Kamei Y, Taketani Y. Determination of bisphenol A concentrations in human biological fluids reveals significant early prenatal exposure. Hum Reprod. 2002;17(11):2839–2841. doi: 10.1093/humrep/17.11.2839. [DOI] [PubMed] [Google Scholar]
- Inoue H, Tsuruta A, Kudo S, Ishii T, Fukushima Y, Iwano H, et al. Bisphenol A glucuronidation and excretion in liver of pregnant and nonpregnant female rats. Drug Metab Dispos. 2005;33(1):55–59. doi: 10.1124/dmd.104.001537. [DOI] [PubMed] [Google Scholar]
- Kato Y, Onishi M, Haraguchi K, Ikushiro S, Ohta C, Koga N, et al. A possible mechanism for 2,2’,4,4’,5,5’-hexachlorobiphenyl-mediated decrease in serum thyroxine level in mice. Toxicol Appl Pharmacol. 2011;254(1):48–55. doi: 10.1016/j.taap.2011.04.020. [DOI] [PubMed] [Google Scholar]
- Kobayashi K, Miyagawa M, Wang RS, Suda M, Sekiguchi S, Honma T. Effects of in utero and lactational exposure to bisphenol A on thyroid status in F1 rat offspring. Ind Health. 2005;43(4):685–690. doi: 10.2486/indhealth.43.685. [DOI] [PubMed] [Google Scholar]
- Lubin JH, Colt JS, Camann D, Davis S, Cerhan JR, Severson RK, et al. Epidemiologic evaluation of measurement data in the presence of detection limits. Environ Health Perspect. 2004;112:1691–1696. doi: 10.1289/ehp.7199. [DOI] [PMC free article] [PubMed] [Google Scholar]
- Mandel SJ, Spencer CA, Hollowell JG. Are detection and treatment of thyroid insufficiency in pregnancy feasible? Thyroid. 2005;15(1):44–53. doi: 10.1089/thy.2005.15.44. [DOI] [PubMed] [Google Scholar]
- Marchesini GR, Meimaridou A, Haasnoot W, Meulenberg E, Albertus F, Mizuguchi M, et al. Biosensor discovery of thyroxine transport disrupting chemicals. Toxicol Appl Pharmacol. 2008;232(1):150–160. doi: 10.1016/j.taap.2008.06.014. [DOI] [PubMed] [Google Scholar]
- Meeker JD, Calafat AM, Hauser R. Urinary bisphenol A concentrations in relation to serum thyroid and reproductive hormone levels in men from an infertility clinic. Environ Sci Technol. 2010;44(4):1458–1463. doi: 10.1021/es9028292. [DOI] [PMC free article] [PubMed] [Google Scholar]
- Meeker JD, Ferguson KK. Relationship between urinary phthalate and bisphenol A concentrations and serum thyroid measures in U.S. adults and adolescents from the National Health and Nutrition Examination Survey (NHANES) 2007–2008. Environ Health Perspect. 2011;119:1396–1402. doi: 10.1289/ehp.1103582. [DOI] [PMC free article] [PubMed] [Google Scholar]
- Mendel CM. The free hormone hypothesis: a physiologically based mathematical model. Endocrine Reviews. 1989;10(3):232–274. doi: 10.1210/edrv-10-3-232. [DOI] [PubMed] [Google Scholar]
- Moriyama K, Tagami T, Akamizu T, Usui T, Saijo M, Kanamoto N, et al. Thyroid hormone action is disrupted by bisphenol A as an antagonist. J Clin Endocrinol Metab. 2002;87(11):5185–5190. doi: 10.1210/jc.2002-020209. [DOI] [PubMed] [Google Scholar]
- Nelson JC, Tomei RT. Direct determination of free thyroxin in undiluted serum by equilibrium dialysis/radioimmunoassay. Clin Chem. 1988;34(9):1737–1744. [PubMed] [Google Scholar]
- Nelson JC, Weiss RM, Wilcox RB. Underestimates of serum free thyroxine (T4) concentrations by free T4 immunoassays. J Clin Endocrinol Metab. 1994;79(1):76–79. doi: 10.1210/jcem.79.1.8027258. [DOI] [PubMed] [Google Scholar]
- Nieminen P, Lindstrom-Seppa P, Juntunen M, Asikainen J, Mustonen AM, Karonen SL, et al. In vivo effects of bisphenol A on the polecat (mustela putorius). J Toxicol Environ Health A. 2002;65(13):933–945. doi: 10.1080/00984100290071063. [DOI] [PubMed] [Google Scholar]
- Otten JJ, Pitzi Hellwig J, Meyers LD. Washington, DC: Food and Nutrition Board, Institute of Medicine; 2006. Dietary Reference Intakes: The Essential Guide to Nutrient Requirements. [Google Scholar]
- Pop VJ, Kuijpens JL, van Baar AL, Verkerk G, van Son MM, de Vijlder JJ, et al. Low maternal free thyroxine concentrations during early pregnancy are associated with impaired psychomotor development in infancy. Clin Endocrinol (Oxf) 1999;50(2):149–155. doi: 10.1046/j.1365-2265.1999.00639.x. [DOI] [PubMed] [Google Scholar]
- Ring JA, Ghabrial H, Ching MS, Smallwood RA, Morgan DJ. Fetal hepatic drug elimination. Pharmacol Ther. 1999;84(3):429–445. doi: 10.1016/s0163-7258(99)00046-7. [DOI] [PubMed] [Google Scholar]
- Rosner B. Percentage points for a generalized ESD many-outlier procedure. Technometrics. 1983;25(2):165–172. [Google Scholar]
- Schonfelder G, Wittfoht W, Hopp H, Talsness CE, Paul M, Chahoud I. Parent bisphenol A accumulation in the human maternal–fetal–placental unit. Environ Health Perspect. 2002;110:A703–A707. doi: 10.1289/ehp.110-1241091. [DOI] [PMC free article] [PubMed] [Google Scholar]
- Seidlova-Wuttke D, Jarry H, Christoffel J, Rimoldi G, Wuttke W. Effects of bisphenol-A (BPA), dibutylphtalate (DBP), benzophenone-2 (BP2), procymidone (Proc), and linurone (Lin) on fat tissue, a variety of hormones and metabolic parameters: a 3 months comparison with effects of estradiol (E2) in ovariectomized (ovx) rats. Toxicology. 2005;213(1–2):13–24. doi: 10.1016/j.tox.2005.05.001. [DOI] [PubMed] [Google Scholar]
- Seiwa C, Nakahara J, Komiyama T, Katsu Y, Iguchi T, Asou H. Bisphenol A exerts thyroid-hormone-like effects on mouse oligodendrocyte precursor cells. Neuroendocrinology. 2004;80(1):21–30. doi: 10.1159/000080663. [DOI] [PubMed] [Google Scholar]
- Shibata N, Matsumoto J, Nakada K, Yuasa A, Yokota H. Male-specific suppression of hepatic microsomal UDP-glucuronosyl transferase activities toward sex hormones in the adult male rat administered bisphenol A. Biochem J. 2002;368(pt 3):783–788. doi: 10.1042/BJ20020804. [DOI] [PMC free article] [PubMed] [Google Scholar]
- Sinisi SE, van der Laan MJ. Loss-based cross-validated deletion/substitution/addition algorithms in estimation. UC Berkeley Division of Biostatistics Working Paper Series:Working Paper 143. 2004. Available: http://www.bepress.com/ucbbiostat/paper143/ [Online March 2004]
- Sjödin A, Jones RS, Lapeza CR, Focant JF, McGahee EE, III, Patterson DG., Jr Semiautomated high-throughput extraction and cleanup method for the measurement of polybrominated diphenyl ethers, polybrominated biphenyls, and polychlorinated biphenyls in human serum. Anal Chem. 2004;76(7):1921–1927. doi: 10.1021/ac030381+. [DOI] [PubMed] [Google Scholar]
- Sugiura-Ogasawara M, Ozaki Y, Sonta S, Makino T, Suzumori K. Exposure to bisphenol A is associated with recurrent miscarriage. Hum Reprod. 2005;20(8):2325–2329. doi: 10.1093/humrep/deh888. [DOI] [PubMed] [Google Scholar]
- Takeuchi T, Tsutsumi O, Nakamura N, Ikezuki Y, Takai Y, Yano T, et al. Gender difference in serum bisphenol A levels may be caused by liver UDP-glucuronosyltransferase activity in rats. Biochem Biophys Res Commun. 2004;325(2):549–554. doi: 10.1016/j.bbrc.2004.10.073. [DOI] [PubMed] [Google Scholar]
- U.S. EPA (U.S. Environmental Protection Agency) Bisphenol A Action Plan. Washington, DC:U.S. Environmental Protection Agency. 2010. Available: http://www.epa.gov/oppt/existingchemicals/pubs/actionplans/bpa_action_plan.pdf [accessed 10 November 2011]
- Volkel W, Colnot T, Csanady GA, Filser JG, Dekant W. Metabolism and kinetics of bisphenol A in humans at low doses following oral administration. Chem Res Toxicol. 2002;15(10):1281–1287. doi: 10.1021/tx025548t. [DOI] [PubMed] [Google Scholar]
- Wang F, Hua J, Chen M, Xia Y, Zhang Q, Zhao R, et al. High urinary bisphenol A concentrations in workers and possible laboratory abnormalities. Occup Environ Med. 2012;69(9):679–684. doi: 10.1136/oemed-2011-100529. [DOI] [PubMed] [Google Scholar]
- Xu X, Liu Y, Sadamatsu M, Tsutsumi S, Akaike M, Ushijima H, et al. Perinatal bisphenol A affects the behavior and SRC-1 expression of male pups but does not influence on the thyroid hormone receptors and its responsive gene. Neurosci Res. 2007;58(2):149–155. doi: 10.1016/j.neures.2007.02.011. [DOI] [PubMed] [Google Scholar]
- Ye X, Kuklenyik Z, Needham LL, Calafat AM. Quantification of urinary conjugates of bisphenol A, 2,5-dichlorophenol, and 2-hydroxy-4-methoxybenzophenone in humans by online solid phase extraction-high performance liquid chromatography-tandem mass spectrometry. Anal Bioanal Chem. 2005;383(4):638–644. doi: 10.1007/s00216-005-0019-4. [DOI] [PubMed] [Google Scholar]
- Ye X, Wong LY, Bishop AM, Calafat AM. Variability of urinary concentrations of bisphenol A in spot samples, first morning voids, and 24-hour collections. Environ Health Perspect. 2011;119:983–988. doi: 10.1289/ehp.1002701. [DOI] [PMC free article] [PubMed] [Google Scholar]
- Yokota H, Iwano H, Endo M, Kobayashi T, Inoue H, Ikushiro S, et al. Glucuronidation of the environmental oestrogen bisphenol A by an isoform of UDP-glucuronosyltransferase, UGT2B1, in the rat liver. Biochem J. 1999;340(pt 2):405–409. [PMC free article] [PubMed] [Google Scholar]
- Zoeller RT, Bansal R, Parris C. Bisphenol-A, an environmental contaminant that acts as a thyroid hormone receptor antagonist in vitro, increases serum thyroxine, and alters RC3/neurogranin expression in the developing rat brain. Endocrinology. 2005;146(2):607–612. doi: 10.1210/en.2004-1018. [DOI] [PubMed] [Google Scholar]
Associated Data
This section collects any data citations, data availability statements, or supplementary materials included in this article.