Abstract
We describe a multispectral continuous-wave diffuse optical tomography (DOT) system that can be used for in vivo three-dimensional (3-D) imaging of seizure dynamics. Fast 3-D data acquisition is realized through a time multiplexing approach based on a parallel lighting configuration - our system can achieve 0.12ms per source per wavelength and up to 14Hz sampling rate for a full set of data for 3-D DOT image reconstruction. The system is validated using both static and dynamic tissue-like phantoms. An initial in vivo experiment using a rat model of seizure is also demonstrated.
1. Introduction
Near-infrared (NIR) diffuse optical tomography (DOT), as a promising noninvasive functional imaging modality, has the potential to become a powerful tool for neuroimaging. Recently, the instrumentation development of DOT has been moving towards the use of high density source-detector pairs[1], fast sampling[2], more portable and wearable designs [3, 4], and new illumination methods such as structured light[5] to achieve better temporal and spatial resolution. DOT has been applied to study hemodynamic response to the motor and visual stimulations in several cortical areas [6, 7], and to quantify cerebral perfusion[8] and blood flow[9] both in humans and small animals. DOT has also been used in the analysis of functional connectivity and networks of the brain[10, 11]. These studies have shown that DOT is able to detect hemodynamic responses spatially equivalent to fMRI.
On the other hand, near-infrared spectroscopy (NIRS) has been used for epileptic seizure research [12–14]. As a dynamic process, epilepsy not only evolves with time, but also distribute in three dimensional spaces. NIRS, however, suffers from low spatial resolution and lacks depth-sectioning capability. It is clear that a tomographic approach such as DOT is needed to localize seizure focus. We recently reported for the first time in vivo epilepsy imaging using DOT[15]. As we showed in that study, we were able to produce high quality functional images using in vivo data for localizing epileptic foci accurately. The reconstructed images of oxyhemoglobin (HbO2), deoxyhemoglobin (HbR), and total hemoglobin all demonstrated significant changes during the seizure onset. However, our first imaging prototype is slow and requires several minutes per imaging frame. In addition, it is limited to 2-D imaging. In order to capture the seizure dynamics in the whole brain, a fast DOT system capable of 3-D imaging is needed.
We note that several other groups have also developed DOT instrumentation for fast optical neuroimaging [2, 4, 16, 17]. While promising, these systems either could not be used for whole brain imaging due to the use of limited number of excitation source and charge-coupled-device (CCD) for detection, or are not fast enough to capture the fast change during seizure. In the current work, we develop a fast multispectral continuous-wave DOT system using 144 light emitting diodes (LEDs) as the excitation sources and highly sensitive photo detectors for light detection. This system allows a full set of 3-D data collection at 3 NIR wavelengths for whole brain imaging in ~14 Hz. In the following sections, we describe in detail the design, calibration, and performance of our fast DOT system. Three dimensional imaging experiments with both static and dynamic tissue-like phantoms and an in vivo experiment were conducted to evaluate the system. Absorption and scattering images were obtained using our nonlinear finite element reconstruction algorithms.
2. System Description
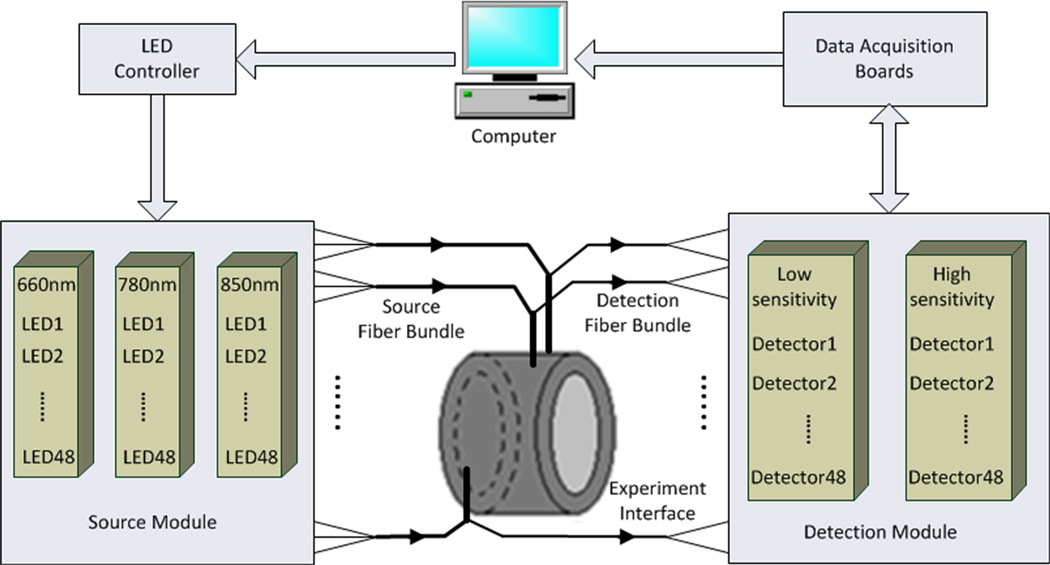
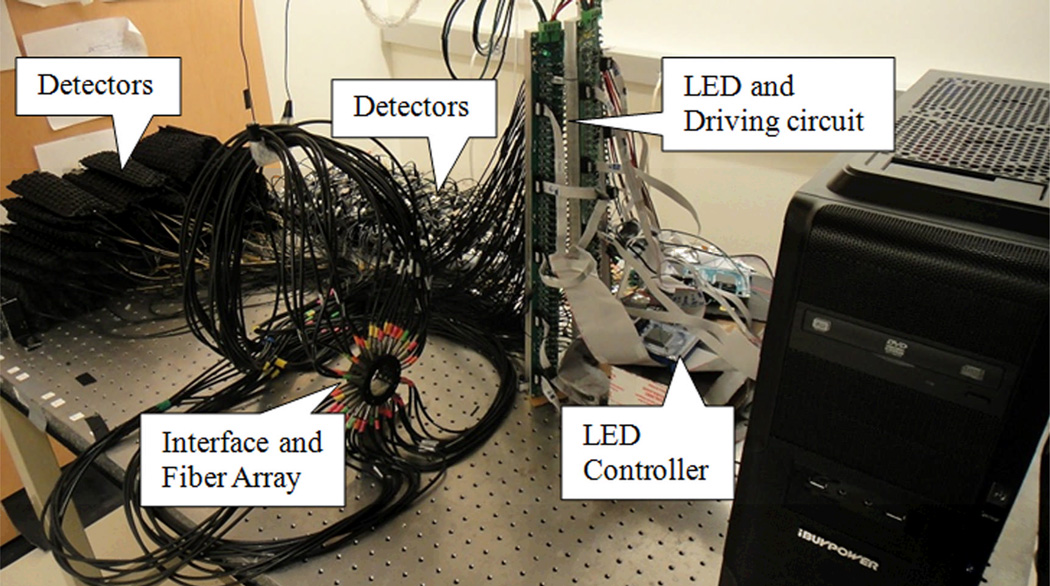
The fast DOT imaging system is schematically shown in Figure. 1. The computer sends a starting signal to the LED controller to sequentially light up three groups of LEDs (a total of 144 LEDS, 48 LEDs each group; each group represents one of the three wavelengths: 660 nm, 780 nm, and 850 nm). The light beams are delivered to the measuring interface via fiber optic bundles. The diffusing light received by the detection fiber bundles is converted to electrical signals and pramplified by two sets of detectors with different sensitivities. The amplified signals are collected through two data acquisition boards. Photograph of the system is shown in Figure. 2. We detail each component of the system in the following subsections.
Figure. 1.
(Color online) Schematic of the fast DOT system.
Figure. 2.
(Color online) Photograph of the fast DOT system.
A. LED and its driving circuit
Three groups of high power NIR LEDs (Epitex Inc.) at wavelengths 660 nm, 780 nm, and 850 nm are chosen as the light sources. The typical rising and falling time for the LED is less than 50 ns, which is much faster than that for a laser diode (LD). Besides, a LED is more cost effective than a LD. Despite these advantages, LED also suffers from some drawbacks compared to LD. First, the half bandwidth of LED is greater than that of LD. However, it can still be considered as a monochromatic light source as demonstrated in [18]. Second, there are wavelength and power drifts due to the increased temperature of LED. Such drifts, however, could be minimized by allowing sufficient settling time and low duty circle for each LED [18]. Furthermore, normalization of measured data in the calibration procedures described below could further reduce the influence from the drifts. Table 1 gives the details of the three groups of LEDs.
Table 1.
Three wavelength LEDs
| Model number |
Peak Wavelength |
Half Band Width |
Radiant Power |
|---|---|---|---|
| SMB660N | 660nm | 25nm | 1.20W(IFP*=2A) |
| SMB780 | 780nm | 25nm | 1.65W(IFP=4A) |
| SMB850D | 850nm | 20nm | 1.60W(IFP=3A) |
IFP: pulse forward current, duty=1%, pulse width=10µs.
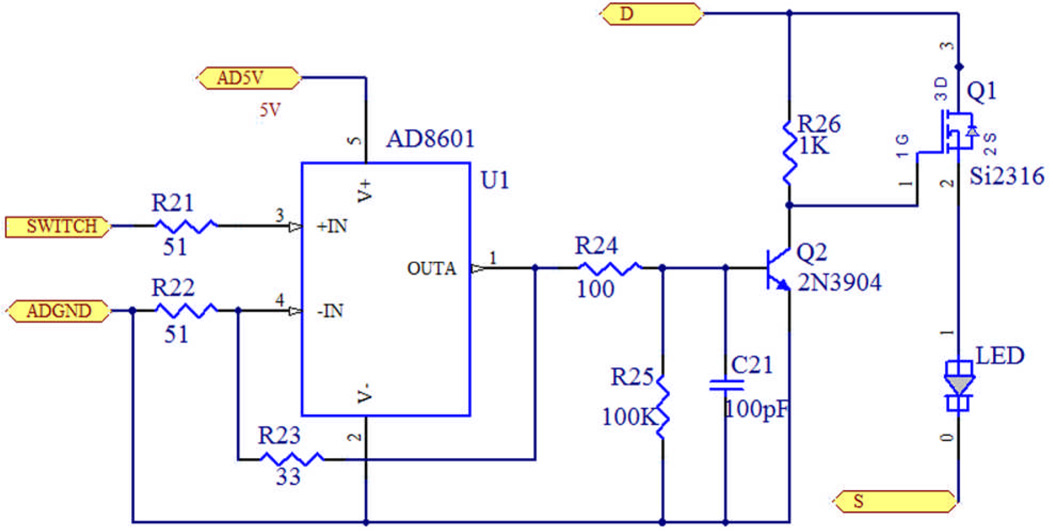
A current driving circuit is designed to drive each LED, as shown in Figure. 3. AD8601 works as a voltage follower, isolating and shaping the control pulse from the FPGA controller. Transistor Q1 is used to switch on/off the LED, and a second transistor Q2 is added to ensure Q1 working in the deep saturation region, which in turn increases the current driving ability. The pull-up resistor keeps the LED in off state before the controller is on to prevent the LEDs from potential damage.
Figure. 3.
(Color online) Diagram of the LED driving circuit.
There are totally three driving boards, each of which drives 48 LEDs at one wavelength. The output power of each LED is adjustable through three independent DC power supplies to achieve an optimal SNR given an object size.
B. LED controller
Two FPGA core boards (CuteDigi Technologies) are used to control the LED timing sequence. Each board consists of an Altera EP2C8 FPGA, a 50MHz crystal oscillator, and 139 I/O pins. FPGA (Field programmable gate array), which contains a large amount of programmable logic blocks, can be used to quickly configure and perform a variety of tasks. Taking advantages of its features of accuracy control, high-speed clock and plenty of I/Os, it is suitable to apply FPGA to our fast DOT system for frequent and rapid switching of 144 LEDs. The first board controls the 96 LEDs of wavelengths 780nm and 850nm. The second one controls the 48 LEDs of wavelength 660nm.
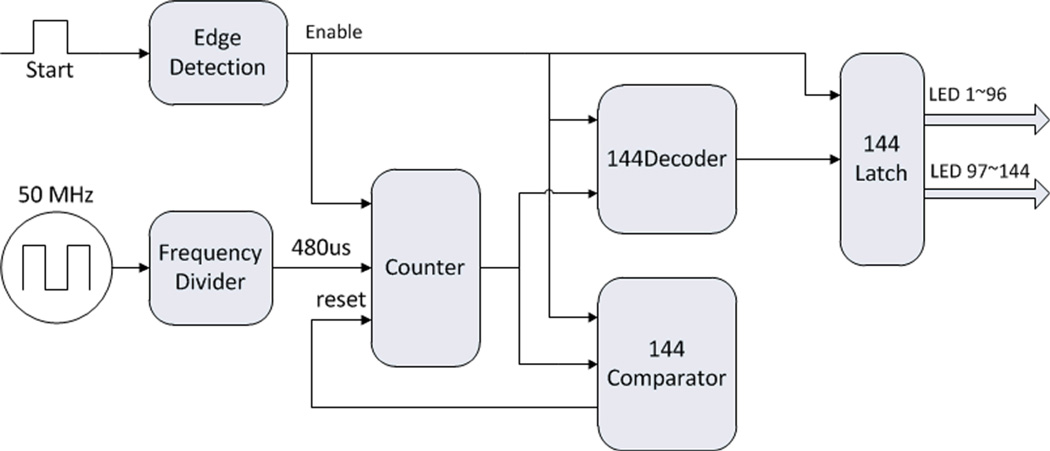
We use Quartus II (Altera) to develop the FPGA controller code, as shown in Figure. 4. The FPGA controller consists of several modules, including edge detection, frequency divider, counter, comparator, and latch. When a rising edge comes, the edge detection module sends an order to enable the other modules. The system 50MHz clock is divided into a 480µs clock, which is used by the counter. The counting value is decoded by the decoder to control the 1~144 LEDs lighting up sequentially in one working circle. After the 144th LED lights up, the comparator resets the counter, rests for 480µs, and then starts the next working circle.
Figure. 4.
(Color online) Schematic of FPGA controller.
C. Optical fiber bundles and tissue/phantom interface
As shown in Figure. 5, bifurcated optic fiber bundles are used to deliver light from the LEDs to the 48 source positions sequentially as required by the reconstruction algorithm and to send the diffused light to the two types of photo detectors.
Figure. 5.
Schematic of the optical fiber bundle. Right end: 5 fiber bundles (1.65 mm) in diameter, FC connectors used for fiber bundles connected to detectors). Left end: 3.10 mm diameter fiber bundle.
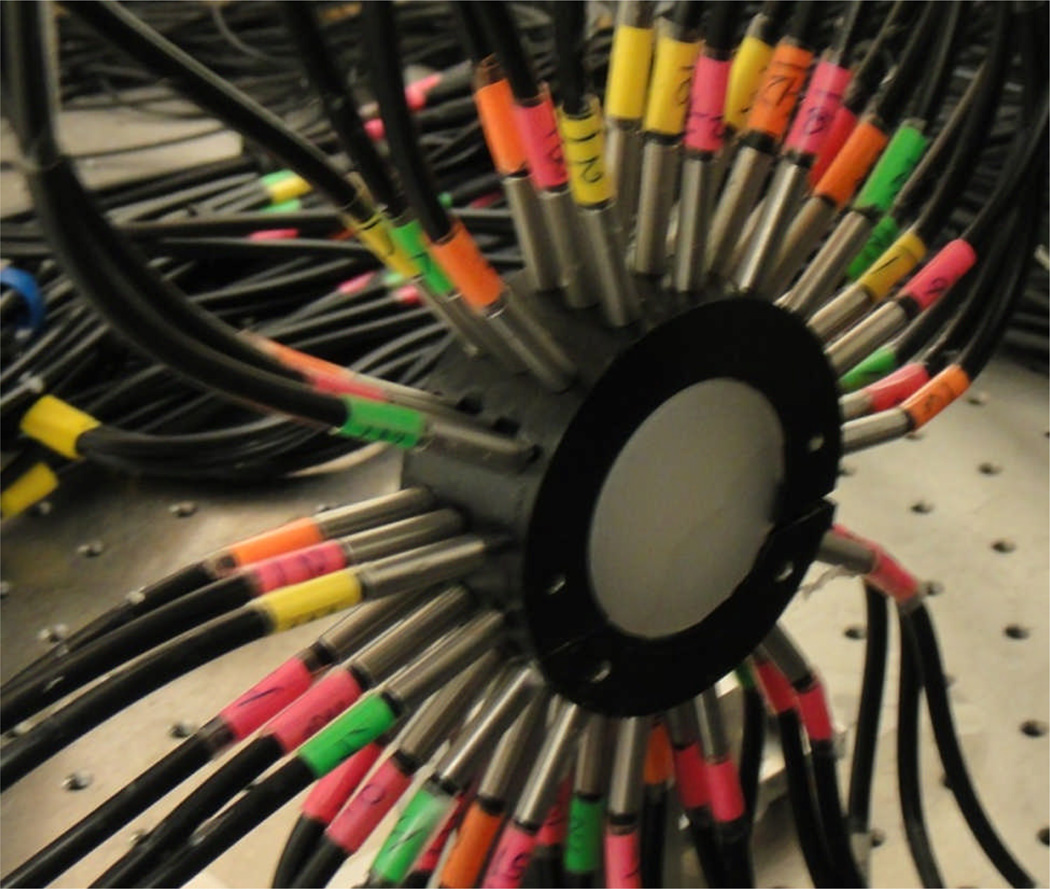
We design and build two ring-shaped interfaces, with diameters of 3 cm and 4 cm, respectively, for the phantom experiments and initial in vivo testing, as shown in Figure. 6. Three layers of optical fibers are placed equally-spaced along the boundary.
Figure. 6.
(Color online) Phantom/fiber optic array interface.
D. Detection units
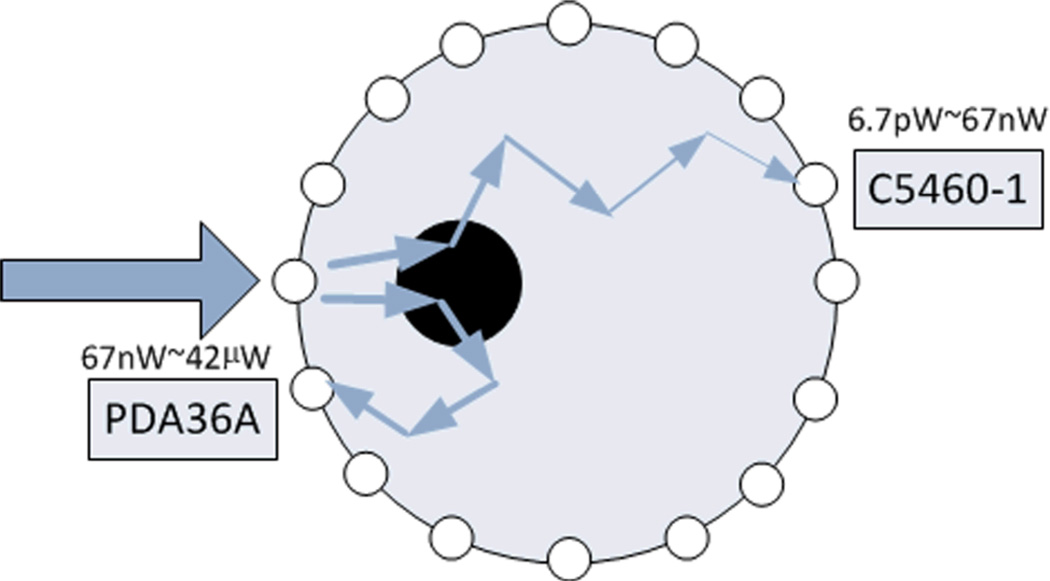
Two types of detectors are chosen to cover a large dynamic detection range while satisfying the high sampling speed: a high sensitivity avalanche photodiode (APD) C5460-01 (Hamamatsu), and a lower sensitivity silicon photodiode PDA36A (Thorlabs) (see Figure. 7). For 48 detection positions, there are totally 48 C5460-01 and 48 PDA36A working together. Both types are gain adjustable. In our current setting, the gain of C5460-01 is fixed to 30dB with a cut-off frequency of 100 kHz, and PDA26A is fixed at 50dB with a cut-off frequency of 100 kHz. The combination of C5460-1 and PDA36A allows an excellent dynamic range of 6.3×10⁶ for photon intensity varying from 6.7pW to 42µW.
Figure. 7.
(Color online) Detection schematic.
The high sensitivity avalanche photodiode detectors C5460-1 consists of an APD and a low-noise current-to-voltage amplifier, which is suitable for low-light-level detection. The 800nm photon sensitivity at 30dB is 1.5×10⁸ V/W and the electronic noise level is 1 mV. The noise equivalent intensity is 6.7pW. Since the maximum output voltage is about 10V, accordingly the maximum detectable light power is 67nW. Considering the proposed whole brain imaging in rats where large light attenuation could occur, a relatively high intensity light would be used in order for light to pass through the head. In this case, the light intensities received by neighboring detectors close to the sources would be larger than the upper limit provided by C5460-1. We then need to expand the light detection range in order to keep useful information contained in these nearby detectors. Thus we use PDA36A as photon detectors for light with higher intensity. For PDA36A, the 800nm photon sensitivity at 50dB is 2.4×10⁵ V/W, while the electronic noise level is 1 mV, and the maximum output voltage is 10V. Accordingly the minimum and maximum detectable light power is 4.2nW and 42µW, providing a 4.2nW to 67nW overlap between C5460-1 and PDA36A.
The 100 kHz cutoff frequency was chosen to make sure there is an overlap in the gains between the detection ranges of C5460-1 and PDA36A. Although the noise performance could be improved with a lower cutoff frequency, a lower cutoff frequency would smooth out the rising and falling edges, leading to increased settling times of the amplified signals from these detectors (which are now about 20 µs and 10 µs, respectively). In order to avoid measuring such smoothed edges, we would need to increase the length of the lighting up time, which would reduce the system sampling rate.
E. Data Acquisition
The data acquisition unit consists of two PCI-DAS6071 boards (Measurement Computing). PCI-DAS6071 is a 12-bit resolution A/D board with a maximum ADC rate of 1.25MS/s. It has 64 single-ended analog input channels, 48 of which are used on each board for the 48 detectors of C5460-1 or PDA36A separately. It also has 8 digital I/Os, one of which is used to send starting order to the LED driving circuit. One set of data collection is completed when the 144 light beams are sequentially delivered to all the source positions. A LabVIEW program is developed to control the two acquisition boards, through which we can set up the collection channels from the two types of detectors, the sampling rate, and the acquisition time period.
F. Stability
To test the stability, we conducted a static phantom experiment with a 4cm-diameter homogeneous phantom using all the 144 sources and 48 detectors. The experiment lasted 30 minutes, which is a typical duration for a seizure experiment. During the experiment, all the room lights were turned off and the phantom was covered with a black opaque plastic sheet to reduce the residual weak ambient light. The equivalent power of the dark noise was less than 40pW in such an experimental environment. The SNR varies from about 3000 for the closest source-detector pairs to about 10 for the most distant source-detector pairs. The measurement variation is less than 1% over 30 minutes.
F. System Timing
The sampling rate of DAQ board PCI-DAS6071 used is 1.25 MS/s, and the channel number is set to 50, rather than the number of the actual detection channels (i.e., 48), in order to achieve an integer sampling clock, consistent with the FPGA clock. The cutoff frequency is 100 kHz for the detectors C5460-01 at 30dB and PDA36A at 50dB, which provides the detection ability for a 10µs width pulse signal. For the signal collection from 48 detection positions, the pulse width should be ≥ 40µs. In practice, for each lighting period at one illumination source position, all the detection channels are sampled three times in order to avoid effect from the rising and falling edges of the preamplified signal. The time needed to collect signals from the 48 detection positions will be 120µs, resulting in a lighting up time of 120µs for each LED. A 360µs blank time is used between two consecutive LEDs lighting sequence to prevent saturation of the detector. After each lighting circle, there is an additional 480µs period needed for counter reset to start a new lighting circle. Thus, for the three groups of 144 LEDs, the time for one lighting circle will be 145 × 480 us = 69.6ms, giving a temporal resolution of 14.4Hz for the system.
3. System Calibration
We implement a calibration method for the fast 3-D DOT system which is a modification of our previously described hybrid calibration method for a 2-D DOT system [19]. The purpose of this calibration is to reduce the errors caused by the use of different source/detection intensities/positions and the system hardware. The modified calibration procedure is described by the following steps:
Make a homogeneous phantom that has the same diameter as the heterogeneous phantom of interest. Perform experiments with the homogeneous phantom. Obtain a set of normalized measure data , where i is the source number from 1 to 48, and j is the detector number from 1 to 48.
Find the initial values of absorption coefficient µa, reduced scattering coefficient , and the boundary conditions coefficient α from , using a preprocessing search method developed previously [20].
Generate a 3-D finite element mesh with the same diameter as the phantom. Using a unit source intensity for the 48 source positions, the 3-D photon propagation is simulated with the optical properties µa, , and α identified in step (2). This creates a new normalized data set from the simulation.
Obtain a factor matrix fij using the following equation: , and a maximum intensity difference coefficient ci, which is the maximum value from the 48 detection positions at source i.
Normalize data from the heterogeneous phantom Eij to , and multiply the correction factor fij and coefficient ci.
| (1) |
is the calibrated data that will be used for the image reconstruction.
4. Experimental Results and Discussion
A. Phantom experiments
The system is evaluated using tissue-like phantoms for 3-D reconstruction of absorption coefficient µa and reduced scattering coefficient . The tissue-like phantom materials used consist of Intralipid (Sigma) as scatterers and India ink (Higgins) as an absorber. 1% ~ 2% agar (Sigma) was used to solidify the Intralipid and Indian ink solution.
3-D images were reconstructed using the nonlinear, finite element based reconstruction algorithms described in [21]. The algorithms use a regularized Newton’s method to update an initial optical property distribution iteratively in order to minimize an object function composed of a weighted sum of the squared difference between computed and measured optical data at the medium surface. The computed optical data was obtained by solving the photon diffusion equation with the finite element method.
The photon diffusion model is the first-order approximation to the radiative transport equation (RTE), under the condition of and not-too-close distance between a detector and the source[22]. The first condition is satisfied for our experimental setup, in which the source-detector separations (at least 7mm) are sufficient compared to the photon transport length. The second condition, although true in most tissues within the brain, is not met in the low scattering cerebral spinal fluid (CSF) surrounding the space between the brain and the dura mater. However, due to the CSF layer is very thin in small animals, as well as the fact that this space is filled with connective tissue and blood vessels, it has been shown that diffusion equation is still accurate [23].
The core procedure in our reconstruction algorithms is to iteratively solve the following regularized matrix equation:
| (2) |
where Φ is the photon density, I is the identity matrix, and λ can be a scalar or a diagonal matrix. Δq = (ΔD1, ΔD2,…ΔDN, ΔDN, Δµa,1, Δµa,2,…,Δµa,N,)T is the update vector for the optical property profiles, where N is the total number of nodes in the finite element mesh used and D is the diffusion coefficient. and , where and , respectively, are measured and calculated data for i =1,2,…,M boundary locations. J is the Jacobian matrix measurement sites. In DOT, the goal is to update the µa and D or distributions through the iterative solution of Eq. (2) so that a weighted sum of the squared difference between computed and measured data can be minimized. A GPU (graphic processing units) based parallel code, using CUDA programming model (NVIDIA), was implemented in order to speed up the time consuming image reconstruction process. With the GPU acceleration, the reconstruction time for a typical mesh (4560 nodes, 22764 elements) is about 6 seconds per iteration.
Three groups of phantom results are shown here, two of which are from the static phantom and the third is from the dynamic fluid flow phantom. In both the single and two static targets experiments (Figure. 8), background µa is 0.01 mm−1, and is 1 mm−1, while the contrast of µa was 4:1, and the contrast of was 2:1 between the target and background. In the fluid flowing experiment (Figure. 8), background µa is 0.01 mm−1, and is 1 mm−1, while the fluid µa is 0.002 mm−1, and is 0.5 mm−1.
Figure. 8.
(Color online) Geometry of the phantoms. (a) Two targets with the 40mm diameter interface. The first target is centered at (x,y)=(−3, −10), the second is centered at (x,y)=(10,3); (b) Single target with the 30mm diameter interface centered at (9,0). (c) The phantom with fluid flowing through the phantom from the top to the bottom.
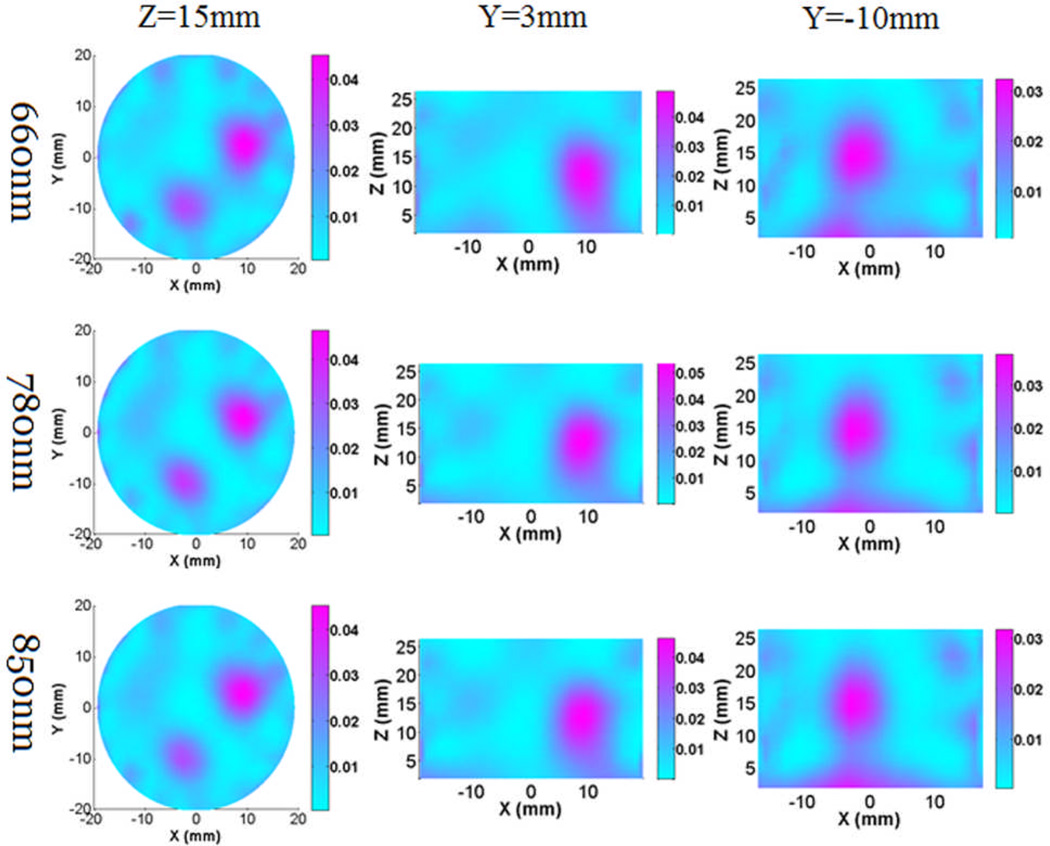
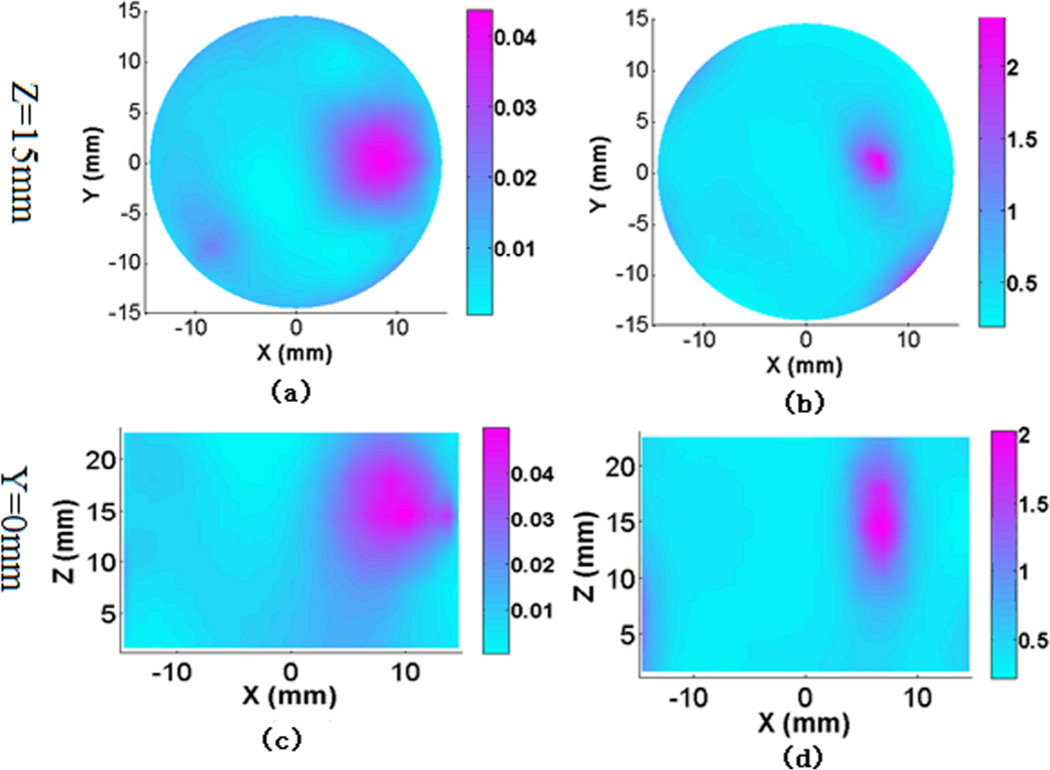
Figure. 9 gives the reconstructed absorption images from the two-target experiment for all three wavelengths, while Figure. 10 shows the recovered absorption and scattering images from the single target experiment for a selected wavelength. We can see that the targets can be clearly detected in both cases. The high absorption at z=0 was due to the boundary artifact. In our in vivo experiment, the ROI (rat brain) was placed in the center of the interface to avoid the influence from the boundary artifact.
Figure. 9.
(Color online) Reconstructed 3-D absorption images at Z and Y cut planes for the two targets phantom experiment at wavelengths of 660nm, 780nm and 850nm. The color bar shows the absorption coefficient value (mm−1), while the axes indicate the spatial dimension (mm).
Figure. 10.
(Color online) Reconstructed 3-D absorption images (a), (c) and scattering images (b), (d) at Z and Y cut planes for the single target phantom experiment at wavelength 780nm. The color bar shows the absorption coefficient (mm−1) or reduced scattering coefficient value (mm−1), while the axes indicate the spatial dimension (mm).
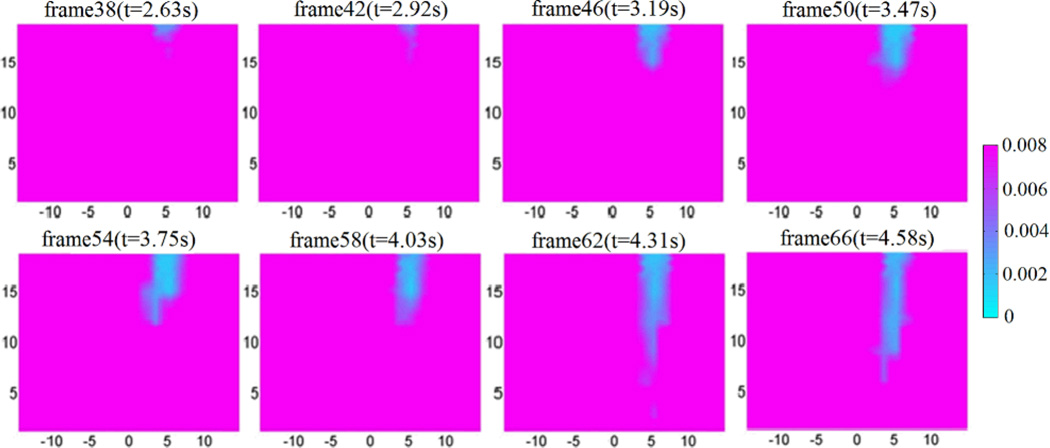
We also conducted phantom experiments to test the ability of high temporal resolution (~14 Hz) of the fast DOT system. Figure. 11 depicts the reconstructed image frames from a 6-second sequence of fluids flowing through a 1.6 mm-diameter polyethylene tube embedded in the background phantom using an automatic syringe pump. The images obtained show that we can clearly track the flow through the tubing with high temporal resolution. This will provide a powerful tool for in vivo real-time monitoring of brain hemodynamics during epileptic seizure onset.
Figure. 11.
(Color online) Reconstructed 3-D absorption images from wavelength 780nm at different time points/frames when the fluids flow through a small tube. The images are shown at cut plane x = 10mm. The fluids flow from the top to the bottom at a speed of ~6mm/s, and the imaging sampling rate is ~14Hz. The color bar shows the absorption coefficient value (mm−1), while the axes indicate the spatial dimension (mm).
B. Initial in vivo experiment
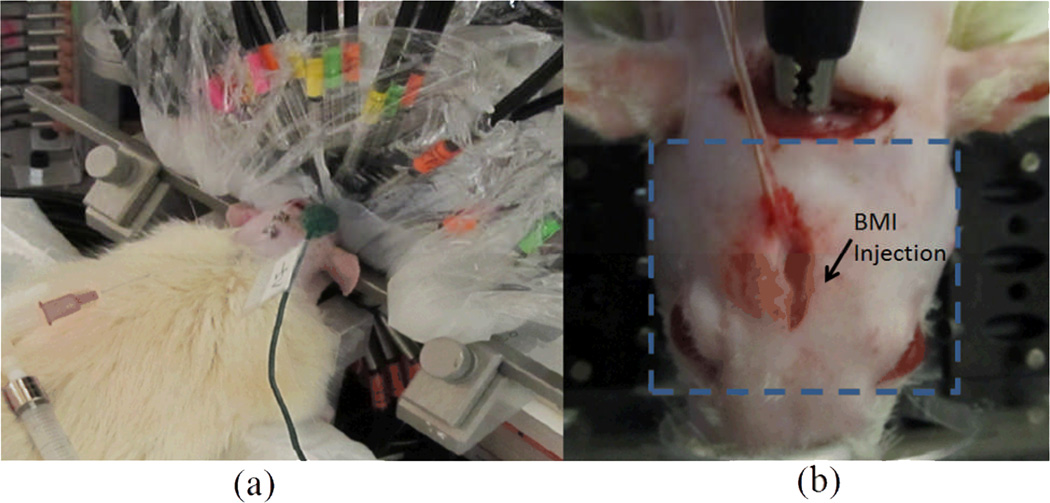
An adult male Sprague-Dawley rat was used in the initial in vivo experiment (Figure. 12). All the experimental protocols and procedures involving animal and its care were conducted in conformity with the NIH and IACUC committee at the University of Florida. The rat was placed in a stereotaxic frame and anaesthetized with Urethane (1mg/kg). Two holes were drilled, one for placing reference EEG electrode and the other for EEG recording and drug injection. The focal seizure was induced by microinjection of 20µl of 2mM GABAA antagonist bicuculline methiodide (BMI) into the left parietal cortex through a transparent catheter. The tissue interface was consisted of two parts as shown in Figure. 6. The lower half was first filled with liquid Intralipid/ink solution (µa =0.01 mm−1 and mm−1), as a coupling medium filling the gap between the head and interface. After the solution solidified, a piece of transparent plastic wrap was used to cover the rat head in order to fill up the remaining space using the Intralipid/ink solution and to ensure a good contact between the optic fibers and sample. The 48 source/detectors were distributed equally in space along the 40mm-diameter interface. Six of the source/detector fibers, which were close to and blocked by the stereotaxic frame, were not used during the experiment. Before BMI injection, resting state was recorded for 3 minutes. Thirty minutes recording was conducted after BMI injection.
Figure. 12.
(Color online) (a) Photograph of the rat/tissue interface. (b) Photograph of the rat with a dashed rectangle indicating the transverse or cross section at the cortex surface for the images shown in Figure. 13 and Figure. 14.
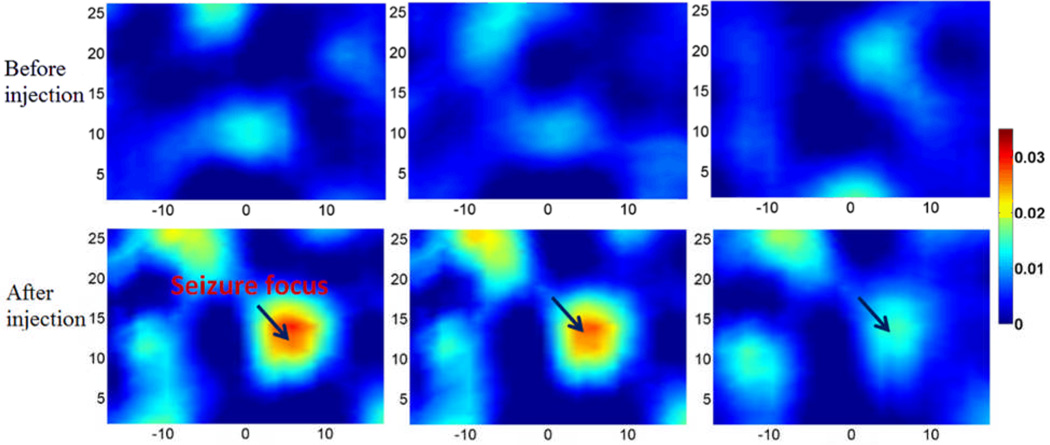
DOT images at resting state before BMI injection are provided baseline reference (top, Figure. 13). DOT images after BMI injection shown in Figure. 13(bottom) show that an obvious seizure focus appeared when the seizure was onset compared to the resting state images.
Figure. 13.
(Color online) Cross sectional images of absorption coefficient (mm−1) at 780nm for the in vivo experiment. Top: the baseline images at three time points before BMI injection. Bottom: the images at three time points after BMI injection.
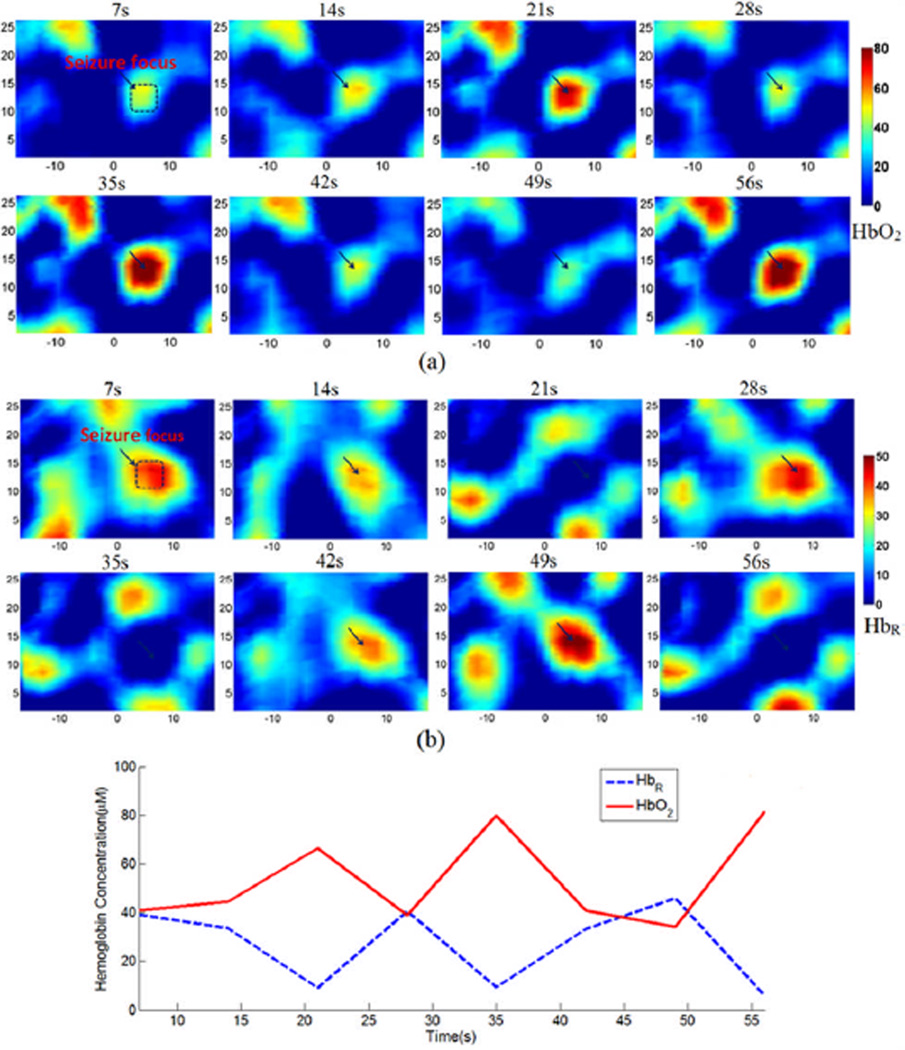
Assuming oxy- and deoxy-hemoglobin (HbO2 and HbR) are the two major chromophores in the rat brain, we used the absorption coefficients at wavelengths 780nm and 850nm to calculate [HbO2] and [HbR] [24]. Figure. 14(a) and (b) show the resulting [HbO2] and [HbR] images at different time points within 1 minute during seizure onset. We also plot the change of averaged [HbO2] and [HbR] within the seizure focus over time in Figure. 14(c). The variation of [HbO2] and [HbR] reveals the local hemodynamics involved during the seizure onset.
Figure. 14.
(Color online) Cross sectional images of [HbO2](a) and [HbR](b), in µM, and the change of averaged [HbO2] and [HbR] (c) within the area of seizure focus as indicated in each of the top left image in (a) and (b).
5. Conclusions
In this paper, we have demonstrated a fast multispectral DOT system capable of providing quantitative 3-D imaging of seizure focus. Evaluation of the system using considerably more in vivo rat experiments is underway in our lab to systematically study the ability of DOT for tracking seizure dynamics and mapping epileptic networks. We also plan to build a cap-like tissue interface which will be used for imaging rats with spontaneous seizure over a long period of time. With sufficient number of source-detector pairs arranged in a proper headgear to cover the whole head of a patient, our system has the potential to be translated to humans with epilepsy for localization of seizure focus and seizure prediction.
Acknowledgements
This research was funded in part by an NIH grant (R01 NS069848), and by the J. Crayton Pruitt Family Endowment.
References
- 1.Habermehl C, Holtze S, Steinbrink J, Koch SP, Obrig H, Mehnert J, Schmitz CH. Somatosensory activation of two fingers can be discriminated with ultrahigh-density diffuse optical tomography. NeuroImage. 2011 doi: 10.1016/j.neuroimage.2011.11.062. [DOI] [PMC free article] [PubMed] [Google Scholar]
- 2.Lasker JM, Masciotti JM, Schoenecker M, Schmitz CH, Hielscher AH. Digital-signal-processor-based dynamic imaging system for optical tomography. The Review of scientific instruments. 2007;78:083706. doi: 10.1063/1.2769577. [DOI] [PubMed] [Google Scholar]
- 3.Lareau E, Lesage F, Pouliot P, Nguyen D, Le Lan J, Sawan M. Multichannel wearable system dedicated for simultaneous electroencephalography/near-infrared spectroscopy real-time data acquisitions. Journal of biomedical optics. 2011;16:096014. doi: 10.1117/1.3625575. [DOI] [PubMed] [Google Scholar]
- 4.Atsumori H, Kiguchi M, Katura T, Funane T, Obata A, Sato H, Manaka T, Iwamoto M, Maki A, Koizumi H. Noninvasive imaging of prefrontal activation during attention-demanding tasks performed while walking using a wearable optical topography system. Journal of biomedical optics. 2010;15:046002. doi: 10.1117/1.3462996. [DOI] [PubMed] [Google Scholar]
- 5.Bélanger S, Abran M, Intes X, Casanova C, Lesage F. Real-time diffuse optical tomography based on structured illumination. Journal of biomedical optics. 2010;15:016006. doi: 10.1117/1.3290818. [DOI] [PubMed] [Google Scholar]
- 6.Gibson A, Austin T, Everdell N, Schweiger M, Arridge S, Meek J, Wyatt J, Delpy D, Hebden J. Three-dimensional whole-head optical tomography of passive motor evoked responses in the neonate. NeuroImage. 2006;30:521–528. doi: 10.1016/j.neuroimage.2005.08.059. [DOI] [PubMed] [Google Scholar]
- 7.White BR, Culver JP. Phase-encoded retinotopy as an evaluation of diffuse optical neuroimaging. NeuroImage. 2010;49:568–577. doi: 10.1016/j.neuroimage.2009.07.023. [DOI] [PMC free article] [PubMed] [Google Scholar]
- 8.Habermehl C, Schmitz CH, Steinbrink J. Contrast enhanced high-resolution diffuse optical tomography of the human brain using ICG. Optics express. 2011;19:18636–18644. doi: 10.1364/OE.19.018636. [DOI] [PMC free article] [PubMed] [Google Scholar]
- 9.Zhou C, Yu G, Furuya D, Greenberg J, Yodh A, Durduran T. Diffuse optical correlation tomography of cerebral blood flow during cortical spreading depression in rat brain. Optics express. 2006;14:1125–1144. doi: 10.1364/oe.14.001125. [DOI] [PubMed] [Google Scholar]
- 10.Mesquita RC, Franceschini MA, Boas DA. Resting state functional connectivity of the whole head with near-infrared spectroscopy. Biomedical optics express. 2010;1:324–336. doi: 10.1364/BOE.1.000324. [DOI] [PMC free article] [PubMed] [Google Scholar]
- 11.White BR, Liao SM, Ferradal SL, Inder TE, Culver JP. Bedside optical imaging of occipital resting-state functional connectivity in neonates. NeuroImage. 2011 doi: 10.1016/j.neuroimage.2011.08.094. [DOI] [PMC free article] [PubMed] [Google Scholar]
- 12.Watanabe E, Nagahori Y, Mayanagi Y. Focus Diagnosis of Epilepsy Using Near-Infrared Spectroscopy. Epilepsia. 2002;43:50–55. doi: 10.1046/j.1528-1157.43.s.9.12.x. [DOI] [PubMed] [Google Scholar]
- 13.Roche-Labarbe N, Zaaimi B, Berquin P, Nehlig A, Grebe R, Wallois F. NIRS-measured oxy-and deoxyhemoglobin changes associated with EEG spike-and-wave discharges in children. Epilepsia. 2008;49:1871–1880. doi: 10.1111/j.1528-1167.2008.01711.x. [DOI] [PubMed] [Google Scholar]
- 14.Nguyen DK, Tremblay J, Pouliot P, Vannasing P, Florea O, Carmant L, Lepore F, Sawan M, Lesage F, Lassonde M. Non-invasive continuous EEG-fNIRS recording of temporal lobe seizures. Epilepsy research. 2011 doi: 10.1016/j.eplepsyres.2011.10.035. [DOI] [PubMed] [Google Scholar]
- 15.Wang Q, Liang X, Liu Z, Zhang Q, Carney P, Jiang H. Visualizing localized dynamic changes during epileptic seizure onset in vivo with diffuse optical tomography. Medical Physics. 2008;35:216. doi: 10.1118/1.2818736. [DOI] [PubMed] [Google Scholar]
- 16.Piao D, Pogue BW. Rapid near-infrared diffuse tomography for hemodynamic imaging using a low-coherence wideband light source. Journal of biomedical optics. 2007;12:014016. doi: 10.1117/1.2709636. [DOI] [PubMed] [Google Scholar]
- 17.Zeff BW, White BR, Dehghani H, Schlaggar BL, Culver JP. Retinotopic mapping of adult human visual cortex with high-density diffuse optical tomography. Proceedings of the National Academy of Sciences of the United States of America. 2007;104:12169–12174. doi: 10.1073/pnas.0611266104. [DOI] [PMC free article] [PubMed] [Google Scholar]
- 18.Soraghan CJ. Development of a versatile multichannel CWNIRS instrument for optical brain-computer interface applications. 2010 [Google Scholar]
- 19.Li C, Jiang H. A calibration method in diffuse optical tomography. Journal of Optics A: Pure and Applied Optics. 2004;6:844–852. [Google Scholar]
- 20.Iftimia N, Jiang H. Quantitative optical image reconstruction of turbid media by use of direct-current measurements. Applied optics. 2000;39:5256–5261. doi: 10.1364/ao.39.005256. [DOI] [PubMed] [Google Scholar]
- 21.Jiang H, Xu Y, Iftimia N. Experimental three-dimensional optical image reconstruction of heterogeneous turbid media from continuous-wave data. Optics express. 2000;7:204–209. doi: 10.1364/oe.7.000204. [DOI] [PubMed] [Google Scholar]
- 22.Jiang H. Diffuse Optical Tomography: Principles and Applications. CRC Press; 2010. [Google Scholar]
- 23.Custo A, Wells WM, Iii, Barnett AH, Hillman E, Boas DA. Effective scattering coefficient of the cerebral spinal fluid in adult head models for diffuse optical imaging. Applied optics. 2006;45:4747–4755. doi: 10.1364/ao.45.004747. [DOI] [PubMed] [Google Scholar]
- 24.Bluestone AY, Stewart M, Lasker J, Abdoulaev GS, Hielscher AH. Three-dimensional optical tomographic brain imaging in small animals, part 1: hypercapnia. Journal of biomedical optics. 2004;9:1046. doi: 10.1117/1.1784471. [DOI] [PubMed] [Google Scholar]


