

Abstract
White matter (WM) loss is associated with cognitive impairment in Sturge-Weber syndrome (SWS). In this study, we evaluated if cognitive and fine motor abnormalities are associated with impaired microstructural integrity in specific WM regions in SWS. Fifteen children with unilateral SWS (age: 3-12.4 years) and 11 controls (age: 6-12.8 years) underwent diffusion tensor imaging. Tract Based Spatial Statistics was used for objective comparisons of WM fractional anisotropy (FA) and mean diffusivity (MD) between the two groups. In the SWS group, WM FA and MD values were correlated with IQ and fine motor scores, with age as a co-variate. Bilateral, multilobar WM areas showed decreased FA, while significant MD increases were confined to small ipsilateral posterior regions in SWS children. IQ in the SWS group (range: 47-128) was positively correlated with FA in the ipsilateral prefrontal WM and inversely associated with MD in the ipsilateral posterior parietal WM. A negative correlation between fine motor function and MD was found in ipsilateral frontal WM encompassing motor pathways. Microstructural WM abnormalities occur not only ipsi- but also contralateral to the angioma in unilateral SWS. Nevertheless, cognitive and fine motor functions are related to diffusion abnormalities in specific ipsilateral, mostly frontal, WM regions.
INTRODUCTION
Sturge-Weber syndrome (SWS) is a neurocutaneous disorder associated with congenital facial port-wine stains, leptomeningeal angiomatosis and glaucoma (1). Neurological manifestations, including motor deficit, visual field cut, progressive cognitive decline and seizures, most often start during the first year of life and show a highly variable clinical course (2). Since intracranial pathology affects only one hemisphere in most cases (1, 3), SWS is an excellent clinical model to study effects of early, unilateral brain damage on neurocognitive functions.
The pathophysiology of brain damage in SWS is poorly understood. Stasis and impaired blood drainage in abnormal pial veins may cause hypoxic-ischemic injury to the underlying cortex. Cortical abnormalities are common pathologic substrates of focal epilepsy and progressive neuro-cognitive impairments (4-6). In addition, the white matter (WM) may show structural and biochemical abnormalities, likely resulting from axonal and myelin injury (7-9). This can lead to a variable degree of WM atrophy in the affected hemisphere. Our previous studies demonstrated that the severity of subcortical WM atrophy, ipsilateral to the angioma, was a stronger predictor of cognitive functions than the degree of cortical atrophy (10). Further investigation of the WM is of high clinical relevance, since specific WM regions encompassing various cortico-cortical and cortico-subcortical tracts play a crucial role in motor and neuro-cognitive functioning (11, 12).
Diffusion tensor imaging (DTI) is a sensitive noninvasive tool for studying the structural integrity of cerebral WM and can show abnormal microstructural abnormalities in WM even when they appear normal on conventional MRI. Tract-Based Spatial Statistics (TBSS) provides an objective approach to study focal WM diffusion properties within/between groups (13-15). In the present study, TBSS was used to objectively explore focal microstructural WM abnormalities associated with SWS. Two DTI parameters, fractional anisotropy (FA), an indicator of WM coherence, axonal organization and myelination, and mean diffusivity (MD), the average magnitude of water diffusion, were analyzed.
The present study had two main purposes: (i) to determine which WM regions are commonly affected in children with unilateral SWS, and (ii) to identify specific WM areas whose diffusion properties are associated with cognitive abnormalities, fine motor functioning or seizure variables.
METHODS
Subjects
Fifteen children (age range: 3 to 12.4 years; mean age: 7.2 years) with the diagnosis of SWS and unilateral hemispheric involvement were included in the present study. All selected patients met the following inclusion criteria: (1) age at least 3 years; this age limit was selected to include only patients whose cognitive function could be assessed uniformly by the Wechsler intelligence scales and also to exclude very young patients with small brain volumes; (2) radiologic [MRI and/or 2-deoxy-2[18F]fluoro-D-glucose positron emission tomography (FDG PET)] evidence of unilateral brain involvement; (3) focal epilepsy and/or unilateral epileptiform EEG abnormalities; (4) full-brain MRI scan with a good quality DTI sequence. Gadolinium enhanced MRI revealed unilateral leptomeningeal angioma in all but two patients. Angiomas were located predominantly over the posterior cortex, also extending anteriorly in some cases. The side of hemispheric involvement was determined with interictal FDG PET (based on cortical hypometabolism) in the two patients (patient #13 and #14 in Table 1, both with a unilateral facial angioma) without an identifiable leptomeningeal angioma. No apparent MRI or PET abnormalities could be seen in the contralateral hemisphere in any of the patients. Unequivocal involvement of the ipsilateral frontal lobe could be detected by clinical MRI and FDG PET in 7 children. Fourteen of the 15 patients had a history of clinical seizures (mean age of seizure onset: 11 months; range: 2.5-29 months; mean duration of epilepsy: 6.5 years; range: 2.5-9.6 years), while one patient (#14) had interictal spikes on scalp EEG without clinical seizures. Five patients had well-controlled epilepsy, 8 patients had rare seizures (up to a few seizures per year), and only one patient (patient #5) had frequent (daily) seizures. Clinical and imaging data of the patients are presented in Table 1.
Table 1.
Clinical and imaging data of the patients
| Patient | Age (y)/ gender |
Duration of epilepsy (y) |
FSIQ | Fine motor function T scores |
Affected brain region |
|---|---|---|---|---|---|
| 1 | 4.3/M | 3.9 | 75 | 29 | 1FTPO |
| 2 | 8.9/M | 7.1 | 76 | 10 | rTPO |
| 3 | 11,3/F | 9.6 | 57 | 1 | rP |
| 4 | 12.4/M | 10 | 47 | −9 | rFTPO |
| 5 | 7/M | 6.5 | 47 | −65* | 1FTPO |
| 6 | 3/F | 2.2 | 128 | 36 | rP |
| 7 | 8.9/M | 8.6 | 82 | −65* | 1T(P)0 |
| 8 | 8.1/F | 7.9 | 55 | −65* | 1FTPO |
| 9 | 6/F | 5.7 | 60 | −64 | 1FTPO |
| 10 | 4.5/F | 2.5 | 91 | 35 | 1(T)P |
| 11 | 9.5/F | 8.6 | 60 | −65* | rFTPO |
| 12 | 6.3/M | 5.6 | 55 | 46 | rFTPO |
| 13 | 4.1/F | 3.6 | 102 | 34 | 1Tt |
| 14 | 3.6/F | NA | 112 | 75 | 1Tt |
| 15 | 9.5/M | 8.9 | 93 | 23 | 1P |
Fine motor function could not be assessed because of severe motor impairment in four subjects; the lowest score minus 1 (−65) was assigned to them; only scores measured contralateral to the brain involvement are listed.
These patients did not have leptomeningeal angioma; however, glucose PET showed left temporal hypometabolism and left facial angioma; intracranial involvement was further confirmed by the presence of clinical seizures or epileptiform discharges on scalp EEG.
NA, not applicable (this patient had only interictal spikes); M. male; F, female; 1, left; r, right; F, frontal; T, temporal; P, parietal; O, occipital. Letters in parenthesis indicate mild/partial involvement of the lobe.
To compare the images of the patient group with those of normal controls, we used a healthy control group of 11 children (age range: 6 to 12.8 years; mean age: 10.5 years). All control children had a full scale IQ (FSIQ) above 85 (above population mean – 1 SD) and had no current or historical medical, developmental, or psychiatric problems. Furthermore, they all had normal high-resolution brain MRI scans.
The study was approved by the Institutional Review Board at Wayne State University and written informed consent of the parent or legal guardian was obtained.
Neuropsychological evaluation
All children with SWS underwent a comprehensive neuropsychologic assessment within 1 day of the MRI studies, carried out by a pediatric neuropsychologist. Intellectual function was assessed using either the Wechsler Preschool and Primary Scales of Intelligence Scales for Children, Third Edition (WPPSI-III; age 36-87 months) (16), or the Wechsler Intelligence Scales for Children, Third Edition (WISC-III; age>87 months) (17). Global intellectual functioning was characterized by FSIQ. Children with SWS were also administered either the Purdue Pegboard task (18), if less than 5 years of age, or the Grooved Pegboard task (19), if older than 5 years of age. Raw manual dexterity scores (T-scores) of the hand both contra- and ipsilateral to the affected hemisphere were calculated. In cases, where the tasks could not be performed due to severe motor impairment (N=4 and N=1 for the hands contralateral and ipsilateral to the affected hemisphere, respectively), the lowest score among the others minus 1 was assigned for the correlation analysis. Thus, the scores used for correlations ranged from −65 to 75 (median: 10). Manual dexterity scores of the hand ipsilateral to the affected hemisphere ranged from −136 to 59 (median: 36).
MRI Data acquisition
MRI studies were carried out on a Sonata 1.5T MR scanner (Siemens, Erlangen, Germany) using a standard head coil. During the scanning phase, SWS children younger than 7 years of age were sedated. The MRI protocol for the patient group included an axial 3D gradient-echo T1-weighted, an axial T2-weighted turbo spin-echo sequence, DTI, susceptibility weighted imaging (SWI), followed by a postgadolinium (0.1 mmol/kg) T1-weighted acquisition. Additional MR sequences included dynamic perfusion weighted imaging, magnetic resonance angiography and post-gadolinium SWI, in some cases. DTI acquisition was performed using single-shot, diffusion-weighted, echoplanar imaging. The acquisition parameters included: TR=6600; TE=97 ms; NEX=8; acquisition matrix=128×128; bandwidth= 95 KHz; FOV= 230×230×3 mm3, voxel size=1.8×1.8×3 mm with 2 b values (0, 1000 s/mm2) applied sequentially in 6 noncollinear directions. The acquisition of DTI images was performed for both the patients and the DTI controls on the same scanner with the same protocol. In the control group, only diffusion tensor and volumetric T1-weighted images were obtained.
Image analysis
All images were visually inspected and affine corrected for motion and other imaging artifacts. The spatial maps of DTI parameters were estimated using multivariate least squares fitting approach implemented in the DtiStudio software (www.mristudio.org) (20). Subsequently, the brain matter was extracted on the non-diffusion weighted (b0) images using the Brain Extraction Tool (BET) available with the FSL software (FMRIB Software Library, www.fmrib.ox.ac.uk/fsl) (21); the utilized fractional intensity threshold was 0.35. The extracted brain-masks were applied to both the FA and MD images and these masked images were used for tract based statistical analysis (13). As 6 patients had right hemispheric brain involvement, the FA as well as MD images of these children were right-left flipped. Subgroups with left or right hemispheric involvement were not analyzed separately due to the limited number of cases. Importantly, the age, IQ and motor function scores did not differ significantly between patients with left and right hemispheric involvement (p>0.1 in all group comparisons, independent samples t-tests).
Statistical analysis was performed using TBSS (13), which is part of FSL. Details of the TBSS analysis have been described in our recent studies (14, 15). In brief, all FA images were aligned into a common space (MNI 152 space) using nonlinear registration. An in-house created pediatric MNI FA template was used as a target for registration of individual FA data in the present study. The transformed FA images of all participants were combined to create a group specific mean FA image. This mean FA image was then thinned to create a mean skeleton image of the WM tracts. This mean skeleton was later applied to the registered FA images of individual participants. Following the search for the maximum FA value along the width of the WM tract, perpendicular to the skeleton voxel, the maximum FA values were projected onto the skeleton voxel for further statistical analysis. An FA threshold of 0.25 was used to differentiate between gray and white matter. In addition, using the FA image derived skeleton, the maximum values along the direction perpendicular to the tract of the MD image were projected to a separate skeleton image.
Study design
Cross-subject statistical analysis of individual skeleton images of both controls and SWS children for both contrasts (controls > SWS) and (controls < SWS), with age as a covariate, was performed using nonparametric permutation tests (5000 permutations/design), as described previously (14), with a cluster size threshold of >3 and a p value of <0.01 for significance, after correcting for multiple comparisons. The strict p<0.01 significance threshold was used due to the multiple design matrices, to avoid false positive results. Skeletal voxels significantly different between the groups were isolated, labeled and expanded to include the full width of the WM tract, which was then used as a mask permitting calculation of the mean FA and MD values for the width of the tract for individual subjects. In addition, analysis of covariance (ANCOVA) was performed using PASW Statistics 18 to calculate age-adjusted mean FA and MD values of these regions for the patient as well as control group by factoring out the effect of age. This expansion procedure also facilitated better visualization of the identified voxel clusters. In addition, to address potential left-right asymmetries in normal brain, that could potentially confound our group comparisons including flipped images, FA and MD images of all control subjects were left-right flipped, and these flipped images were compared to the original (non-flipped) image set, using the same parameter set and statistical threshold, which was used to compare the SWS and control groups. After repeating the initial steps of TBSS using only the images of the SWS group, separate general linear model design matrices were applied to seek for skeletal voxel-clusters with FA/MD values correlating with FSIQ, fine motor function scores, age at seizure onset and duration of epilepsy, after controlling for age (13). Correlations with p<0.01 were considered to be significant. A DTI atlas was used to determine which WM fiber tracts were involved in voxel clusters identified by each analysis (22).
RESULTS
The comparison between the SWS and control group showed bilateral regions with significantly decreased FA in the SWS children (5.6% and 1.1% of the mean WM skeleton of the brain in the ipsilateral and contralateral hemispheres, respectively), including ipsilateral, multilobar regions as well as less extensive contralateral callosal and corona radiata areas (Figure 1A). Age-adjusted mean FA of the abnormal, “expanded” skeleton voxels was 0.56 (SD=0.076), whereas that of the controls was 0.74 (SD=0.091). Significant MD increases were, in contrast, much smaller and confined to ipsilateral posterior WM regions (posterior corona radiata; 0.31% of the mean WM skeleton; Figure 1B). Age-adjusted mean MD of the abnormal “expanded” skeleton voxels was 0.882×10⁻³ mm2/s (SD=5.24×10⁻⁵) as compared to mean MD values of 0.765×10⁻³ mm2/s (SD=6.28×10⁻⁵) in the control group. Representative raw FA and MD images of a patient and a control subject are shown in Figure 2. Most of the areas with increased MD also had significantly decreased FA. No voxel clusters showed increased FA or decreased MD values in the SWS group. Comparisons of the original and right-left flipped images of the control group showed no statistically significant differences between the two hemispheres for either FA and MD values.
Figure 1.

Tract-based comparison of white matter FA (A) and MD (B) between children with Sturge-Weber syndrome and healthy control children. To facilitate visualization, regions showing significant FA decrease/MD increase (p<0.01, after correcting for multiple comparisons) are thickened using the tbss_fill script implemented in FSL. (A) The red/yellow voxels indicate white matter areas where the FA was significantly reduced in patients compared to controls (after age differences between the two groups were factored out). (B) Blue-light blue voxels indicate brain regions where MD was significantly higher in patients compared to controls (after age factored out). Results are projected on the pediatric template FA image in MNI 152 space. Coordinates in MNI 152 space are indicated. I: side ipsilateral to the affected hemisphere; C: contralateral side. Output is color-coded to enhance appearance of skeleton within final output. Brighter colors indicate voxels closer to the white matter skeleton.
Figure 2.

Representative axial FA (A) and MD images (B) of an 8.9 year old patient (patient #7; left) with Sturge-Weber syndrome and left hemispheric involvement (note the mild left posterior atrophy) as well as those of a control subject of the same age (right). Visual assessment of FA images can reveal areas suggestive of decreased FA (darker gray; arrow) in patients with Sturge-Weber syndrome. MD differences are more subtle. L=left, R=right.
Voxel clusters with FA values positively associated with FSIQ were identified in the ipsilateral frontal WM (total size: 0.35% of the mean WM skeleton; including callosal fibers, parts of the anterior thalamic radiation, anterior corona radiata, uncinate and inferior fronto-occipital fascicles; Figure 3A), indicating higher FA values in this area in children with better cognitive function. In contrast, areas with MD values inversely correlating with FSIQ were seen only in ipsilateral posterior regions (0.32% of the mean WM skeleton; including parts of posterior thalamic radiation, inferior fronto-occipital and inferior longitudinal fascicles; Figure 3B).
Figure 3.
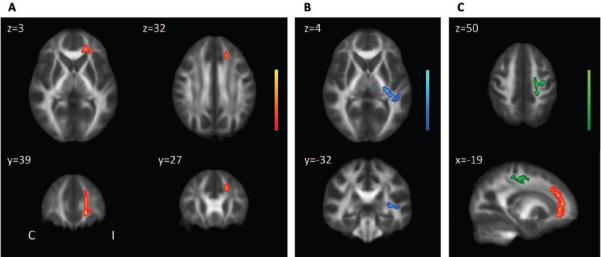
Results of correlations between DTI parameters and clinical variables in children with Sturge-Weber syndrome. (A) Significant (p<0.01) positive correlations between IQ and FA values in patients with Sturge-Weber syndrome. The red/yellow voxels indicate white matter regions where the FA positively correlated with IQ. (B) Significant inverse correlation between IQ and MD in patients with Sturge-Weber syndrome. The blue/light blue voxels indicate white matter areas where IQ inversely correlated with MD. (C) White matter regions with a significant inverse association between fine motor scores of the hand (opposite to the affected hemisphere) and MD values (green/light green). On the sagittal image, the region with the positive correlation between IQ and FA is also shown (red/yellow) to demonstrate the locations of the two distinct WM regions correlating with IQ vs. motor scores.
Dexterity scores of the hand contralateral to the affected hemisphere inversely correlated with MD values in ipsilateral frontal WM encompassing parts of the corticospinal (CST) and corticopontine tracts (CPT), callosal fibers, superior longitudinal fascicle (SLF) and superior thalamic radiation (STR). Altogether, 0.37% of the mean WM skeleton showed this correlation (Figure 3C), indicating higher MD in this area in patients with worse hand motor function. In contrast, we found no areas with FA values either directly or inversely correlating with fine motor scores. In addition, no voxels could be identified with FA or MD values correlating with dexterity scores of the hand ipsilateral to the affected hemisphere. Finally, no voxel clusters with FA or MD values correlating with age at seizure onset or duration of epilepsy could be identified.
DISCUSSION
Recently, we reported that hemispheric WM volume loss ipsilateral to the leptomeningeal angioma is associated with poor cognitive function in children with unilateral SWS (10). The present study builds on those findings by carrying out a tract based analysis of WM diffusion parameters and identifying focal WM regions with microstructural impairment. Our results suggest that FA is the more sensitive DTI parameter showing extensive ipsi- as well as smaller contralateral WM regions with decreased anisotropy compared to controls, while increased diffusivity (MD) was confined to the ipsilateral posterior WM, a general area most often abnormal on conventional MRI scans in SWS patients. Although conventional MRI and PET studies showed no frontal involvement in several patients (N=8), multiple frontal WM areas showed decreased FA on the group level, suggesting common involvement of the frontal lobe WM. Concordant with this finding, a recent study on SWS subjects also found diffusion abnormalities in normal appearing WM (9). Our study also demonstrates that cognitive and fine motor dysfunctions are related to microstructural abnormalities in specific ipsilateral, but not contralateral, WM regions.
The exact mechanism leading to WM damage in SWS is not completely understood. Direct effects contributing to WM injury may include hypoxia due to impaired venous drainage; this is supported by observations of “accelerated myelination” in infants with SWS (23, 24), and this may be followed by WM atrophy in older children (25). Cortical malformations and neuronal loss may also account for axonal loss and dysmyelination affecting diffusion parameters. Interestingly, some WM areas (including mostly callosal fibers) contralateral to the affected hemisphere also showed decreased FA, perhaps indicating Wallerian degeneration. This may be similar to findings from previous reports showing reduced anisotropy of the normal-appearing corticospinal tract remote from a cerebral infarct and interpreted as Wallerian degeneration (26). An alternative explanation could be the remote effect of the epilepsy itself.
Unilateral brain damage acquired early in life, as seen in SWS, may have an important impact on cognitive functions. Cortical injury in SWS plays a crucial role not only in cognitive but also in other neurological manifestations, such as seizures (6, 28). However, rapid progression of unilateral hemispheric demise in SWS may be associated with relatively preserved cognitive function, presumably due to more effective contralateral reorganization (4). As already mentioned, abnormal development or loss of WM may be a critical factor for cognitive decline in SWS (10). Our present data suggest that the degree of impairment of the (often normal-appearing) frontal WM including anterior callosal fibers may be crucial in cognitive outcome. Previous research has shown that region-specific maturational trajectories in the developing brain coincide with corresponding functional development (30, 31). Furthermore, age-related microstructural degradation of certain brain regions is associated with different aspects of cognitive decline (32). The observed correlation between IQ and DTI parameters in anterior and posterior WM may also be actual neuroanatomical substrates of distinct cognitive subdomains.
Not surprisingly, fine motor function of the hand contralateral to the affected hemisphere showed an inverse association with MD values of voxel clusters located in ipsilateral frontal WM encompassing callosal fibers, STR, CPT, CST and SLF tracts. Concordantly, our previous tractography study evaluating the corticospinal tract demonstrated increased MD values in SWS patients with more severe motor deficit (33). Lower N-acetyl-aspartate (NAA) levels in frontal lobe WM as well as GM are also associated with impaired motor function (8). Thus, the present study along with our previous results underlines that dexterity in the affected hand highly depends on the severity of damage to frontal motor pathways in SWS.
The fact that we could not identify any WM voxel-clusters with diffusion parameters correlating with the time of seizure onset or epilepsy duration suggest that epileptic activity is probably more associated with cortical pathology rather than WM damage. This notion is further supported by our previous MR-spectroscopy data showing that lower frontal lobe GM but not WM NAA was associated with earlier onset of seizures (8). The high metabolic demand of frequent seizures accompanied by an impairment of the cerebral hemodynamic response can worsen ischemic brain injury and lead to neurologic deterioration (34), especially in children with severe, intractable seizures. However, most of the children included in the present study had relatively well-controlled seizures, which no significant impact on progressive brain damage, including WM damage.
Methodological considerations
This is a cross-sectional study with limited number of patients. The small sample size precluded the analysis of sex effects. Antiepileptic medication may also influence cognitive function, but the variety of drugs would make it hard to control for such effects. Importantly, the study sample was not homogenous with respect to the side of the hemispheric involvement. Therefore, to achieve reasonable statistical power for group-analysis, the images of patients with right hemispheric involvement (smaller subgroup) were right-left flipped. As we know that WM hemispheric asymmetries exist in the developing brain (36), it could be argued that this step introduced potential confounding effects. However, a separate TBSS analysis of our control group (with the same parameters as for the patient analysis) did not show any significant left-right asymmetries in FA or MD, suggesting that this approach may not be sensitive to left-right flipping in relatively small study samples. Notably, we included only patients above the age of 3 years in order to obtain accurate, reliably comparable IQ scores measured by the Wechsler scales. However, even this selected patient group‘s age was lower than that of our control group. To minimize the potential confounding effect of brain development (37), age was included as a covariate in all design matrices.
Although TBSS is an objective, automatic procedure, there are still some limitations which have been discussed in detail by the group who developed the software (13). Notably, abnormalities at tract junctions or crossings should be interpreted carefully. One can also argue that non-linear registration of FA images of brains with regional atrophy to a template may not be accurate. However, the projection of individual subjects‘ aligned FA images onto the mean FA skeleton accounts for residual misalignments and makes the comparison of FA and MD values between groups reliable (13). Furthermore, as we applied general linear model analysis, which is designed to seek for linear associations, non-linear correlations between DTI parameters and clinical variables might have been missed. Finally, the group comparison is designed to identify regions commonly affected in a group level and cannot indicate individual abnormalities.
Conclusion
In conclusion, our data demonstrate widespread WM water diffusion abnormalities in patients with SWS suggesting significant microstructural brain tissue damage. WM abnormalities were present not only ipsilateral, but also to some extent, contralateral to the side of the apparent brain involvement. Nevertheless, cognitive functions appear to be associated with tissue damage of focal ipsilateral, but not contralateral, posterior and prefrontal WM. Dexterity of the hand opposite to the leptomeningeal angioma correlates inversely with diffusivity of frontal areas encompassing motor pathways. Future longitudinal studies will be useful to evaluate whether early diffusion abnormalities in these WM regions have prognostic value for the clinical course of neuro-cognitive functions.
ACKNOWLEDGEMENT
We thank Malek I. Makki PhD and Yang Xuan BS for their technical support in the MRI acquisition. We also thank Majid Khalaf MD, Anne Deboard RN and Jane Cornett RN for their assistance in sedation. We thank the Sturge-Weber Foundation for referring patients to us. We are grateful also to the families and children who participated in the study.
The study was supported by a grant from the National Institute of Neurological Disorders and Stroke (R01 NS041922 to C. Juhász).
Abbreviations
- DTI
diffusion tensor imaging
- FA
fractional anisotropy
- FDG
2-deoxy-2[18F]fluoro-D-glucose
- FSIQ
full-scale IQ
- MD
mean diffusivity
- MNI
Montreal Neurological Institute
- SWS
Sturge-Weber syndrome
- TBSS
tract based spatial statistics
- WM
white matter
REFERENCES
- 1.Bodensteiner JB, Roach ES. Sturge-Weber Syndrome. Sturge-Weber Foundation; Mt.Freedom, NJ: 1999. [Google Scholar]
- 2.Riela A, Roach E. Sturge-Weber syndrome. In: Roach E, Miller V, editors. Neurocutaneous disorders. Cambridge University Press; New York: 2004. pp. 179–185. [Google Scholar]
- 3.Pascual-Castroviejo I, Pascual-Pascual SI, Velazquez-Fragua R, Viano J. Sturge-Weber syndrome: study of 55 patients. Can J Neurol Sci. 2008;35:301–307. doi: 10.1017/s0317167100008878. [DOI] [PubMed] [Google Scholar]
- 4.Lee JS, Asano E, Muzik O, Chugani DC, Juhasz C, Pfund Z, Philip S, Behen M, Chugani HT. Sturge-Weber syndrome: correlation between clinical course and FDG PET findings. Neurology. 2001;57:189–195. doi: 10.1212/wnl.57.2.189. [DOI] [PubMed] [Google Scholar]
- 5.Juhasz C, Batista CE, Chugani DC, Muzik O, Chugani HT. Evolution of cortical metabolic abnormalities and their clinical correlates in Sturge-Weber syndrome. Eur J Paediatr Neurol. 2007;11:277–284. doi: 10.1016/j.ejpn.2007.02.001. [DOI] [PMC free article] [PubMed] [Google Scholar]
- 6.Maton B, Krsek P, Jayakar P, Resnick T, Koehn M, Morrison G, Ragheb J, Castellano-Sanchez A, Duchowny M. Medically intractable epilepsy in Sturge-Weber syndrome is associated with cortical malformation: Implications for surgical therapy. Epilepsia. 2010;51:257–267. doi: 10.1111/j.1528-1167.2009.02304.x. [DOI] [PubMed] [Google Scholar]
- 7.Juhasz C, Haacke EM, Hu J, Xuan Y, Makki M, Behen ME, Maqbool M, Muzik O, Chugani DC, Chugani HT. Multimodality imaging of cortical and white matter abnormalities in Sturge-Weber syndrome. AJNR Am J Neuroradiol. 2007;28:900–906. [PMC free article] [PubMed] [Google Scholar]
- 8.Batista CE, Chugani HT, Hu J, Haacke EM, Behen ME, Helder EJ, Juhasz C. Magnetic resonance spectroscopic imaging detects abnormalities in normal-appearing frontal lobe of patients with Sturge-Weber syndrome. J Neuroimaging. 2008;18:306–313. doi: 10.1111/j.1552-6569.2007.00207.x. [DOI] [PMC free article] [PubMed] [Google Scholar]
- 9.Arulrajah S, Ertan G, A MC, Tekes A, Lin DL, Huisman TA. MRI with diffusion-weighted imaging in children and young adults with simultaneous supra- and infratentorial manifestations of Sturge-Weber syndrome. J Neuroradiol. 2010;37:51–59. doi: 10.1016/j.neurad.2009.05.001. [DOI] [PubMed] [Google Scholar]
- 10.Juhasz C, Lai C, Behen ME, Muzik O, Helder EJ, Chugani DC, Chugani HT. White matter volume as a major predictor of cognitive function in Sturge-Weber syndrome. Arch Neurol. 2007;64:1169–1174. doi: 10.1001/archneur.64.8.1169. [DOI] [PubMed] [Google Scholar]
- 11.Riley JD, Franklin DL, Choi V, Kim RC, Binder DK, Cramer SC, Lin JJ. Altered white matter integrity in temporal lobe epilepsy: Association with cognitive and clinical profiles. Epilepsia. 2010;51:536–545. doi: 10.1111/j.1528-1167.2009.02508.x. [DOI] [PMC free article] [PubMed] [Google Scholar]
- 12.Voineskos AN, Rajji TK, Lobaugh NJ, Miranda D, Shenton ME, Kennedy JL, Pollock BG, Mulsant BH. Age-related decline in white matter tract integrity and cognitive performance: A DTI tractography and structural equation modeling study. Neurobiol Aging. 2010 doi: 10.1016/j.neurobiolaging.2010.02.009. doi:10.1016/j.neurobiolaging.2010.02.009. [DOI] [PMC free article] [PubMed] [Google Scholar]
- 13.Smith SM, Jenkinson M, Johansen-Berg H, Rueckert D, Nichols TE, Mackay CE, Watkins KE, Ciccarelli O, Cader MZ, Matthews PM, Behrens TE. Tract-based spatial statistics: voxelwise analysis of multi-subject diffusion data. Neuroimage. 2006;31:1487–1505. doi: 10.1016/j.neuroimage.2006.02.024. [DOI] [PubMed] [Google Scholar]
- 14.Govindan RM, Makki MI, Wilson BJ, Behen ME, Chugani HT. Abnormal water diffusivity in corticostriatal projections in children with Tourette syndrome. Hum Brain Mapp. 2010 doi: 10.1002/hbm.20970. DOI: 10.1002/hbm.20970. [DOI] [PMC free article] [PubMed] [Google Scholar]
- 15.Govindan RM, Behen ME, Helder E, Makki MI, Chugani HT. Altered water diffusivity in cortical association tracts in children with early deprivation identified with Tract-Based Spatial Statistics (TBSS) Cereb Cortex. 2010;20:561–569. doi: 10.1093/cercor/bhp122. [DOI] [PMC free article] [PubMed] [Google Scholar]
- 16.Wechsler D. Wechsler Preschool and primary Scale of Intelligence -III. The Psychological Corporation; San Antonio, TX: 2002. [Google Scholar]
- 17.Wechsler D. Manual for the Wechsler Intelligence Scale for Children. Third Edition The Psychological Corporation; San Antonio, TX: 1991. [Google Scholar]
- 18.Tiffin J, Asher EJ. The Purdue pegboard; norms and studies of reliability and validity. J Appl Psychol. 1948;32:234–247. doi: 10.1037/h0061266. [DOI] [PubMed] [Google Scholar]
- 19.Trites RL. Instruction/Owner‘s Manual. Lafayette Instrument Company; Lafayette, IN: 1989. Lafayette Grooved Pegboard Task. [Google Scholar]
- 20.Jiang H, van Zijl PC, Kim J, Pearlson GD, Mori S. DtiStudio: resource program for diffusion tensor computation and fiber bundle tracking. Comput Methods Programs Biomed. 2006;81:106–116. doi: 10.1016/j.cmpb.2005.08.004. [DOI] [PubMed] [Google Scholar]
- 21.Smith SM, Jenkinson M, Woolrich MW, Beckmann CF, Behrens TE, Johansen-Berg H, Bannister PR, De Luca M, Drobnjak I, Flitney DE, Niazy RK, Saunders J, Vickers J, Zhang Y, De Stefano N, Brady JM, Matthews PM. Advances in functional and structural MR image analysis and implementation as FSL. Neuroimage. 2004;23(suppl 1):S208–219. doi: 10.1016/j.neuroimage.2004.07.051. [DOI] [PubMed] [Google Scholar]
- 22.Mori S, Wakana S, Van Zijl P. MRI atlas of human white matter. Elsevier B.V.; Amsterdam, The Netherlands: 2005. [Google Scholar]
- 23.Jacoby CG, Yuh WT, Afifi AK, Bell WE, Schelper RL, Sato Y. Accelerated myelination in early Sturge-Weber syndrome demonstrated by MR imaging. J Comput Assist Tomogr. 1987;11:226–231. doi: 10.1097/00004728-198703000-00005. [DOI] [PubMed] [Google Scholar]
- 24.Adamsbaum C, Pinton F, Rolland Y, Chiron C, Dulac O, Kalifa G. Accelerated myelination in early Sturge-Weber syndrome: MRI-SPECT correlations. Pediatr Radiol. 1996;26:759–762. doi: 10.1007/BF01396195. [DOI] [PubMed] [Google Scholar]
- 25.Pfund Z, Kagawa K, Juhasz C, Shen C, Lee JS, Chugani DC, Muzik O, Chugani HT. Quantitative analysis of gray- and white-matter volumes and glucose metabolism in Sturge-Weber syndrome. J Child Neurol. 2003;18:119–126. doi: 10.1177/08830738030180021501. [DOI] [PubMed] [Google Scholar]
- 26.Puig J, Pedraza S, Blasco G, Daunis IEJ, Prats A, Prados F, Boada I, Castellanos M, Sanchez-Gonzalez J, Remollo S, Laguillo G, Quiles AM, Gomez E, Serena J. Wallerian Degeneration in the Corticospinal Tract Evaluated by Diffusion Tensor Imaging Correlates with Motor Deficit 30 Days after Middle Cerebral Artery Ischemic Stroke. AJNR Am J Neuroradiol. 2010 doi: 10.3174/ajnr.A2038. DOI 10.3174/ajnr.A2038. [DOI] [PMC free article] [PubMed] [Google Scholar]
- 27.Yu C, Zhu C, Zhang Y, Chen H, Qin W, Wang M, Li K. A longitudinal diffusion tensor imaging study on Wallerian degeneration of corticospinal tract after motor pathway stroke. Neuroimage. 2009;47:451–458. doi: 10.1016/j.neuroimage.2009.04.066. [DOI] [PubMed] [Google Scholar]
- 28.Comi AM. Pathophysiology of Sturge-Weber syndrome. J Child Neurol. 2003;18:509–516. doi: 10.1177/08830738030180080701. [DOI] [PubMed] [Google Scholar]
- 29.Behen ME, Juhász C, Helder E, Batista CEA, Chugani DC, Chugani HT. Cognitive function in Sturge-Weber syndrome: Effect of side and extent of severe hypometabolism on PET scanning [abstract] Ann Neurol. 2006;60(suppl 3):S122. [Google Scholar]
- 30.Gogtay N, Giedd JN, Lusk L, Hayashi KM, Greenstein D, Vaituzis AC, Nugent TF, 3rd, Herman DH, Clasen LS, Toga AW, Rapoport JL, Thompson PM. Dynamic mapping of human cortical development during childhood through early adulthood. Proc Natl Acad Sci U S A. 2004;101:8174–8179. doi: 10.1073/pnas.0402680101. [DOI] [PMC free article] [PubMed] [Google Scholar]
- 31.Nagy Z, Westerberg H, Klingberg T. Maturation of white matter is associated with the development of cognitive functions during childhood. J Cogn Neurosci. 2004;16:1227–1233. doi: 10.1162/0898929041920441. [DOI] [PubMed] [Google Scholar]
- 32.Kennedy KM, Raz N. Aging white matter and cognition: differential effects of regional variations in diffusion properties on memory, executive functions, and speed. Neuropsychologia. 2009;47:916–927. doi: 10.1016/j.neuropsychologia.2009.01.001. [DOI] [PMC free article] [PubMed] [Google Scholar]
- 33.Sivaswamy L, Rajamani K, Juhasz C, Maqbool M, Makki M, Chugani HT. The corticospinal tract in Sturge-Weber syndrome: a diffusion tensor tractography study. Brain Dev. 2008;30:447–453. doi: 10.1016/j.braindev.2007.12.009. [DOI] [PMC free article] [PubMed] [Google Scholar]
- 34.Aylett SE, Neville BG, Cross JH, Boyd S, Chong WK, Kirkham FJ. Sturge-Weber syndrome: cerebral haemodynamics during seizure activity. Dev Med Child Neurol. 1999;41:480–485. [PubMed] [Google Scholar]
- 35.Kossoff EH, Ferenc L, Comi AM. An infantile-onset, severe, yet sporadic seizure pattern is common in Sturge-Weber syndrome. Epilepsia. 2009;50:2154–2157. doi: 10.1111/j.1528-1167.2009.02072.x. [DOI] [PubMed] [Google Scholar]
- 36.Wilde EA, McCauley SR, Chu Z, Hunter JV, Bigler ED, Yallampalli R, Wang ZJ, Hanten G, Li X, Ramos MA, Sabir SH, Vasquez AC, Menefee D, Levin HS. Diffusion tensor imaging of hemispheric asymmetries in the developing brain. J Clin Exp Neuropsychol. 2009;31:205–218. doi: 10.1080/13803390802098118. [DOI] [PMC free article] [PubMed] [Google Scholar]
- 37.Lebel C, Walker L, Leemans A, Phillips L, Beaulieu C. Microstructural maturation of the human brain from childhood to adulthood. Neuroimage. 2008;40:1044–1055. doi: 10.1016/j.neuroimage.2007.12.053. [DOI] [PubMed] [Google Scholar]