Abstract
Precursor rRNA (pre-rRNA) is an intermediate stage in the formation of mature rRNA and is a useful marker for cellular metabolism and growth rate. We developed an electrochemical sensor assay for Escherichia coli pre-rRNA involving hybridization of capture and detector probes with tail sections that are spliced away during rRNA maturation. A ternary self-assembled monolayer (SAM) prepared on gold electrode surfaces by coassembly of thiolated capture probes with hexanedithiol and posttreatment with 6-mercapto-1-hexanol minimized the background signal and maximized the signal-to-noise ratio. Inclusion of internal calibration controls allowed accurate estimation of the pre-rRNA copy number per cell. As expected, the ratio of pre-rRNA to mature rRNA was low during stationary phase and high during log phase. Pre-rRNA levels were highly dynamic, ranging from 2 copies per cell during stationary phase to ∼1,200 copies per cell within 60 min of inoculation into fresh growth medium. Specificity of the assay for pre-rRNA was validated using rifampin and chloramphenicol, which are known inhibitors of pre-rRNA synthesis and processing, respectively. The DNA gyrase inhibitor, ciprofloxacin, was found to act similarly to rifampin; a decline in pre-rRNA was detectable within 15 min in ciprofloxacin-susceptible bacteria. Assays for pre-rRNA provide insight into cellular metabolism and are promising predictors of antibiotic susceptibility.
INTRODUCTION
There is an urgent need for the development of rapid and convenient methods for detection and identification of bacterial pathogens in clinical specimens to guide the diagnosis and treatment of infectious diseases. Electrochemical biosensors are molecular-sensing devices that intimately couple a biological recognition element to an electrode transducer. For example, the widely used handheld glucose sensors link substrate-dependent activity of glucose oxidase enzymes to an amperometric current readout (1). Similarly, electrochemical sensor assays are able to measure the number of DNA capture probe-target hybridization events on the sensor surface through the catalytic rate of redox enzymes linked to detector probes (2). This capture probe-target-detector probe sandwich assay approach has been adapted to species-specific identification of a broad array of bacterial pathogens using capture and detector probe combinations targeting rRNA (3–8), an approach which has been validated on human clinical urine specimens from patients with urinary tract infection (3, 5).
rRNA is an excellent target molecule for pathogen detection systems because of its abundance in the bacterial cell and because of the accessibility of species-specific signature sequences to probe hybridization (9). When combined with sensitive surface chemistry methods to minimize nonspecific background signals, such rRNA probe hybridization sensors are able to detect as few as 100 bacteria per milliliter (10–12). Estimations of bacterial density are possible because, within the dynamic range of the assay, there is a log-log correlation between the concentration of target rRNA molecules in the bacterial lysate and the amperometric current amplitude generated by the electrochemical sensor assay (4, 6). The accuracy of bacterial quantitation methods based on rRNA detection is mitigated by variations in the number of rRNA molecules per cell depending on the cell type and bacterial growth phase. In Escherichia coli, the rRNA copy number per cell has been estimated to vary from as high as 72,000 during log phase to less than 6,800 during stationary phase (13).
Electrochemical sensors have the potential to rapidly determine antibiotic susceptibility by monitoring the phenotypic response of bacteria to antibiotics. Cellular precursor rRNA (pre-rRNA) levels would be expected to fall as antibiotics shift the cellular metabolism of antibiotic-susceptible bacteria from log phase to stationary phase. The size of the pre-rRNA pool in the cell is determined by the synthesis and degradation rates, which are directly or indirectly affected by antibiotics (14). For this reason, we developed and validated an electrochemical assay for pre-rRNA determination. By calibrating sensor signal intensities with an internal standard, and correlating these signals with bacterial density, we were able to estimate the number of rRNA and pre-rRNA copies per cell. Our studies provide new insight into the kinetics of rRNA and pre-rRNA levels during bacterial growth phases, and in response to certain antibiotics. Of interest, we determined that pre-rRNA and/or rRNA levels rapidly respond to the quinolone antibiotic, ciprofloxacin, and the aminoglycoside antibiotic, gentamicin, in susceptible E. coli.
MATERIALS AND METHODS
Bacterial strains and media.
E. coli clinical urine isolate EC103 (Ampr) was obtained from the University of California—Los Angeles (UCLA) Clinical Microbiology Laboratory with approval from the UCLA and Veterans Affairs Institutional Review Boards and appropriate Health Insurance Portability and Accountability Act exemptions. EC103 was inoculated into Mueller-Hinton (MH) broth with 12% glycerol (Becton, Dickinson, Sparks, MD) and stored at −80°C. EC103 was cultured overnight in MH broth with 64 μg/ml ampicillin (Sigma, St. Louis, MO). EC103 was plated on Luria broth (LB) agar (MOBIO Laboratories Inc., Carlsbad, CA) for counting CFU.
EC103 growth and target copy number experiments.
Overnight cultures of EC103 were prepared by adding 5 μl of EC103 glycerol stock to 5 ml of MH broth with ampicillin and incubated at 37°C overnight, with shaking. The following day, the EC103 culture was diluted by adding 10 μl of the overnight culture to 100 ml of prewarmed and preshaken MH broth in a 500-ml flask, followed by incubation at 37°C, with shaking at 250 rpm. Every 30 min, including at 0 min and during the overnight culture itself, a 1-ml sample was taken for a measurement of an optical density at 600 nm (OD600) and 10-fold serial dilutions (100 μl into 900 μl) were performed in room temperature MH broth. Cell density was determined by plating serial dilutions in triplicate. At each time point, culture samples were transferred to an ice-water bath or centrifuged immediately at 4°C for 3 min at 14,000 rpm. The supernatants were then removed by aspiration, flash frozen in a dry ice-ethanol bath and stored at −80°C.
In certain growth experiments, one culture was spiked with one of the following antibiotics at either 150 or 210 min: 25 μg/ml rifampin (Sigma, St. Louis, MO), 25 μg/ml chloramphenicol (Sigma, St. Louis, MO), 4 μg/ml ciprofloxacin (Sigma, St. Louis, MO), or 16 μg/ml gentamicin (Sigma, St. Louis, MO). After the addition of antibiotics at 150 min, samples were collected every 15 min instead of every 30 min.
For experiments comparing preribosomal probe sensitivity and specificity, culture samples were taken from the overnight culture and the EC103 culture at log phase (OD600 = 0.1) and centrifuged immediately at 4°C for 5 min at 14,000 rpm. Supernatants were removed by aspiration. The pellets were flash frozen in a dry ice-ethanol bath and stored at −80°C.
Electrochemical detection.
Electrochemical detection of bacterial rRNA and pre-rRNA was performed as described previously for biotinylated (6) and thiolated capture probes (10, 11) immobilized on photolithographically prepared Au electrode arrays, with modifications.
The sensor response was evaluated with a sandwich-type hybridization assay, using fluorescein (FITC) as a tracer in the detector probe and anti-FITC-horseradish peroxidase (anti-FITC-HRP) as the reporter molecule. 3,3′5,5′-tetramethylbenzidine (TMB)–H2O2 was the selected substrate for the electrochemical measurement of the activity of the captured HRP reporter. All synthetic oligonucleotides used were purchased from Eurofins MWG Operon and are listed in Table 1. For thiolated capture probes, disposable 16-sensor bare Au electrode arrays were obtained from GeneFluidics (Irwindale, CA). Each sensor of the array consisted of a 2.5-mm diameter central working electrode, surrounded by an Au counter electrode and an Au pseudo-reference electrode. The sensor chip was driven by a computer-controlled Helios multichannel electrochemical workstation (GeneFluidics, Irwindale, CA). Washing steps were carried out after each application of reagents by applying a stream of deionized H2O to the sensor surface for approximately 2 to 3 s, followed by 5 s of drying under a stream of nitrogen. Prior to the addition of the first reagent, the bare gold chips were dried as described above. To functionalize the working sensor surface, a fresh mixture of 0.05 μM thiolated capture probe and 300 μM 1,6-hexanedithiol (96%; Sigma, St. Louis, MO) was prepared in 10 mM Tris-HCl, 1 mM EDTA, and 0.3 M NaCl (pH 8.0) and allowed to stand at room temperature for 10 min. Aliquots of 6 μl of this mixture were cast over each Au working electrode in the 16-sensor array and incubated overnight at 4°C in a humidified chamber. Unless otherwise stated, all subsequent steps were performed at room temperature. The following day, the mixed monolayer-modified Au sensors were subsequently treated with 6 μl of 1 mM 6-mercapto-1-hexanol (97%; Sigma, St. Louis, MO) in 10 mM Tris-HCl, 1 mM EDTA, and 0.3 M NaCl (pH 8.0) for 50 min to obtain the ternary monolayer interface.
Table 1.
DNA oligonucleotides used in this study
| Probe namea | Sequenceb |
|---|---|
| Pre16S 15 m 48D | 5′-TTTTTCGTCTTGCGA-F |
| Pre16S 15 m 63C | 5′-B-GAGACTTGGTATTCA |
| Pre16S 15 m R63D | 5′-F-GAGACTTGGTATTCA |
| Pre16S 15 m R48C | 5′-TTTTTCGTCTTGCGA-B |
| Pre16S 17 m R63D | 5′-F-TTGAGACTTGGTATTCA |
| Pre16S 17 m R46C | 5′-TTTTTCGTCTTGCGACG-B |
| Pre16S 19 m R63D | 5′-F-TCTTGAGACTTGGTATTCA |
| Pre16S 19 m R44C | 5′-TTTTTCGTCTTGCGACGTT-B |
| Pre16S 21 m R63D | 5′-F-ACTCTTGAGACTTGGTATTCA |
| Pre16S 21 m R42C | 5′-TTTTTCGTCTTGCGACGTTAA-B |
| Pre16S 17 m R60D | 5′-F-AGACTTGGTATTCATTT |
| Pre16S 17 m R43C | 5′-TTCGTCTTGCGACGTTA-B |
| Pre16S 19 m R60D | 5′-F-TGAGACTTGGTATTCATTT |
| Pre16S 19 m R41C | 5′-TTCGTCTTGCGACGTTAAG-B |
| Pre16S 21 m R60D | 5′-F-CTTGAGACTTGGTATTCATTT |
| Pre16S 21 m R39C | 5′-TTCGTCTTGCGACGTTAAGAA-B |
| Pre16S 17 m R66D | 5′-F-CTCTTGAGACTTGGTAT |
| Pre16S 17 m R49C | 5′-TCATTTTTCGTCTTGCG-B |
| Pre16S 19 m R66D | 5′-F-CACTCTTGAGACTTGGTAT |
| Pre16S 19 m R47C | 5′-TCATTTTTCGTCTTGCGAC-B |
| Pre16S 21 m R66D | 5′-F-TTCACTCTTGAGACTTGGTAT |
| Pre16S 21 m R45C | 5′-TCATTTTTCGTCTTGCGACGT-B |
| Pre16S 19 m 5′JxnD | 5′-TTTGATGCTCAAAGAATTA-F |
| Pre16S 21 m 5′JxnC | 5-S-TCAAACTCTTCAATTTAAAAG |
| Pre16S 21 m R5′JxnD | 5-F-TCAAACTCTTCAATTTAAAAG |
| Pre16S 19 m R5′JxnC | 5′-TTTGATGCTCAAAGAATTA-S |
| Pre16S 17 m 3′JxnD | 5′-GAGGTGATCCAACCGCA-F |
| Pre16S 20 m 3′JxnC | 5-S-GAACGCTTCTTTAAGGTAAG |
| Pre16S 20 m R3′JxnD | 5-F-GAACGCTTCTTTAAGGTAAG |
| Pre16S 17 m R3′JxnC | 5′-GAGGTGATCCAACCGCA-S |
| Pre23S 17 m 3′JxnDc | 5′-AAGCCTCACGGTTCATT-F |
| Pre23S 14 m 3′JxnCc | 5′-S-GGCGTTGTAAGGTT |
| Pre23S 14 m R3′JxnD | 5′-F-GGCGTTGTAAGGTT |
| Pre23S 17 m R3′JxnC | 5′-AAGCCTCACGGTTCATT-S |
| Mature rRNA 18 m 1484D | 5′-GTTACGACTTCACCCCAG-F |
| Mature rRNA 19 m 1502C | 5′-S-GTTCCCCTACGGTTACCTT |
| Synthetic target oligonucleotides | |
| Pre-rRNA 31 m | 5′-AATGAACCGTGAGGCTTAACCTTACAACGCC |
| Mature rRNA 37 m | 5′-CTGGGGTGAAGTCGTAACAAGGTAACCGTAGGGGAAC |
m, number of nucleotides; C, capture probe; D, detector probe; Jxn, splice site; R, reverse orientation.
F, FITC; B, biotin; S, thiol.
Capture and detector probe pair selected based on its high signal-to-noise ratio.
For biotinylated capture probes, 16-sensor Au electrode arrays precapped with a binary self-assembled monolayer (SAM) consisting of mercaptohexanol and mercaptoundecanoic acid in a 5:1 ratio were obtained from GeneFluidics (Irwindale, CA). Washing steps were carried out after each application of reagents by applying a stream of deionized H2O to the sensor surface for approximately 2 to 3 s, followed by 5 s of drying under a stream of nitrogen. To functionalize the sensor surface, the carboxylic terminal groups of the binary SAM were converted to amine-reactive esters by applying 4 μl of a NHS/EDC (50 mM N-hydroxysuccinimide, 200 mM N-3-dimethylaminopropyl-N-ethylcarbodiimide; Sigma, St. Louis, MO) solution in deionized H2O to the working electrode for 10 min. Activated sensors were incubated for 10 min with 4 μl of EZ-Link Amine-PEG2-Biotin (Pierce, Rockford, IL) at a concentration of 5 mg/ml in 50 mM sodium acetate, pH 5. Thirty microliters of 1 M ethanolamine, pH 8.5 (Sigma, St. Louis, MO), was applied to all three electrodes for 10 min in order to block the remaining reactive groups of the activated monolayer. Biotinylated sensors were incubated in 4 μl of 0.5 mg/ml of streptavidin (Pierce) in RNase-free H2O (catalog no. 821739; MP Biomedicals, Aurora, OH) for 10 min. Streptavidin-coated sensors were incubated with biotinylated capture probes (4 μl, 1 μM in 1 M phosphate buffer, pH 7.2) for 30 min. Electrodes were blocked for 10 min with 4 μl of 0.05% polyethylene glycol 3350 (PEG; Sigma, St. Louis, MO) in 1 M phosphate buffer, pH 7.2. All these incubation steps were performed in a glass petri dish.
For both capture probe types, lysis of bacterial cells was performed by resuspending the appropriate pellet in 10 μl of 1 M NaOH and incubating at room temperature for 5 min. Bacterial lysates were neutralized by addition of 50 μl of 0.25 μM FITC-modified detector probe in 1 M phosphate buffer (pH 7.2) with 2.5% bovine serum albumin (BSA) (Sigma, St. Louis, MO) and allowed to react for 10 min for homogeneous hybridization. Aliquots (4 μl) of this raw bacterial lysate target solution were cast onto each capture probe-modified sensor and incubated for 15 min. After washing and drying the array, 4 μl of a 0.5-U/ml anti-FITC-HRP Fab fragment (diluted in 0.5% casein in 1 M phosphate-buffered saline, pH 7.2; Roche) solution was deposited on each of the working electrodes for 15 min. After washing and drying, a prefabricated plastic 16-well manifold (GeneFluidics, Irwindale, CA) was bonded to the sensor array. The sensor array was put into the chip reader and 50 μl of the TMB-H2O2 solution (Enhanced K-Blue TMB substrate; Neogen, Lexington, KY) was placed on each of the sensors in the array, covering the three-electrode area. Chronoamperometric measurements were immediately and simultaneously taken for all 16 sensors by stepping the potential to −200 mV (versus the pseudo-Au reference electrode) and sampling the current at 60 s. For each array, negative-control (NC) sensors were tested, including the capture probe, FITC detector probe, and the buffer (2.5% BSA in 1 M phosphate buffer, pH 7.2) instead of bacterial lysate solution. Positive controls (PC) were included in all sensor arrays and consisted of a synthetic target oligonucleotide for either the mature rRNA or Pre23S 3′Jxn pre-rRNA probe pairs at 1 nM with the corresponding detector probe (see Table 1).
Including the synthetic target molecule served to normalize the electrochemical signal intensity and determine the ribosomal and preribosomal target molecule concentration because there is a linear log-log correlation between the concentration of the analyte and the electrochemical signal. The relation between the electrochemical signal generated and the number of synthetic target molecules tested was used to convert the electrochemical signal from samples at each time point into a number of target molecules per volume tested (concentration). This was then combined with the CFU/ml values determined by plating for each time point to generate measurements of target molecule numbers per CFU.
Cryo-EM of frozen-hydrated E. coli.
E. coli cultures (5 μl) were deposited onto a freshly glow-discharged holey carbon grid, blotted, and rapidly frozen in liquid ethane. The frozen-hydrated specimens were imaged at −170°C using a Polara G2 electron microscope (FEI Company, Hillsboro, OR) equipped with a field emission gun and a 4K by 4K charge-coupled device (CCD; TVIPS, GMBH, Germany). The microscope was operated at 300 kV, and cryo-electron microscopy (cryo-EM) images were recorded at a magnification of ×4,700 (3.76 nm/pixel) and ×31,000 (0.57 nm/pixel). Nine to 14 cells were selected at random for length and width measurements at different times after inoculation.
RESULTS
Development of capture and detector probes for pre-rRNA.
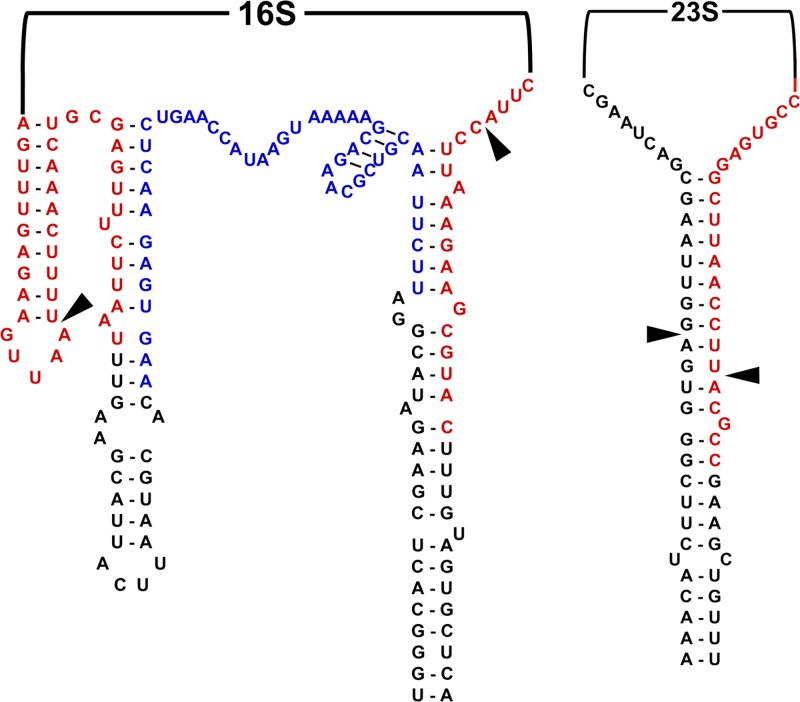
Probe pairs were developed for pre-rRNA tails that are removed during rRNA processing (Fig. 1). Initially, probe pairs of various lengths were designed for a region in the 5′ tail of 16S pre-rRNA predicted to be accessible for probe binding because it was relatively free of secondary structure. As shown in Fig. 2, some of these probe pairs demonstrated good sensitivity (high signal-to-noise ratio) for E. coli samples obtained during the log phase of growth. However, these 16S pre-rRNA probes generated unexpectedly low ratios of log-phase to stationary-phase signals when E. coli in different growth phases were tested (Fig. 2). These results indicated that such probes were not reliable markers for intact pre-rRNA molecules.
Fig 1.
Regions targeted by pre-rRNA probe pairs. The structures of the 16S and 23S pre-rRNA molecules are shown, including locations of mature rRNA termini (arrows) and regions targeted by electrochemical sensor probe pairs for the 16S 5′ tail (blue letters) and 16S and 23S splice sites (red letters).
Fig 2.
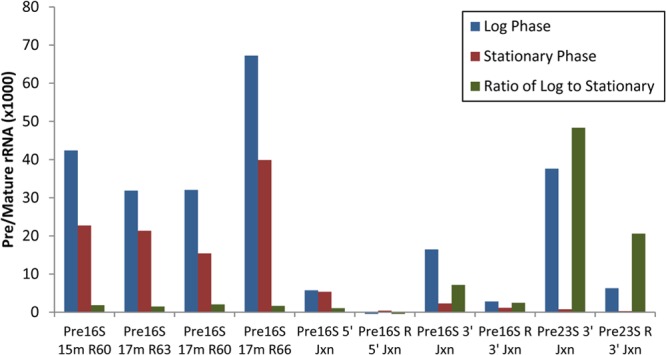
Comparison of pre-rRNA probe pairs. Probe pairs were tested for detection of E. coli in the log and stationary phases of growth. Log- and stationary-phase cells are expected to have high and low levels of pre-rRNA, respectively, yielding a high signal ratio for log-phase versus stationary-phase cells. Probe pairs for 16S pre-rRNA had good sensitivity for log-phase cells, but the signal ratio for log-phase versus stationary-phase cells was low. Some probe pairs targeting the splice sites at the termini of mature 16S and 23S rRNA had higher signal ratios for log-phase versus stationary-phase cells. The probe pair targeting the splice site at the 3′ terminus of 23S rRNA had the best combination of sensitivity and high signal ratio of log-phase versus stationary-phase cells.
Subsequently, probe pairs were designed to hybridize with splice sites between the pre-rRNA tails and mature rRNA so that the target sequences would only be present in intact pre-rRNA (Fig. 1). These target sequences are digested into two pieces during processing of pre-rRNA into mature rRNA such that after digestion, neither piece of the target sequence would bind the probe sufficiently well to generate a signal. Probe pairs were tested for binding to the 5′ and 3′ splice sites of 16S rRNA and the 3′ splice site of 23S rRNA. Probe pairs in both the capture-detector and detector-capture orientations were tested. As shown in Fig. 2, pre-rRNA probe pairs targeting the splice sites resulted in higher ratios of log- to stationary-phase signals. These results are consistent with those of Cangelosi et al. (14), who used a pre-rRNA sandwich hybridization assay in which their capture probe bound to the pre-rRNA tail and their detector probe bound to the mature rRNA region, providing specificity for intact pre-rRNA. One of the two probe pairs for the 3′ splice site of 23S rRNA produced a high signal with a relatively high signal ratio for log-phase cells compared to stationary-phase cells. This capture (Pre23S 14m 3′JxnC) and detector (Pre23S 17m 3′JxnD) probe pair was selected for subsequent measurements of pre-rRNA.
For mature rRNA determination, capture and FITC detector probes specified in Table 1 were used.
Growth phase comparison of mature rRNA versus pre-rRNA.
We compared signals for mature rRNA versus pre-rRNA for an overnight culture of E. coli before and after inoculation into fresh MH medium. Target rRNA and pre-rRNA concentrations were estimated by including known concentrations of synthetic artificial target oligonucleotides as internal calibration controls on each electrochemical sensor chip. These synthetic target oligonucleotides functioned by hybridizing with both the capture and detector probes. Copies per cell were calculated from the concentrations of the rRNA target number and the number of cells in the bacterial lysate. We found that variability in pre-rRNA and rRNA measurements could be reduced by chilling samples in an ice bath and centrifugation in a centrifuge refrigerated at 4°C. On the other hand, the cells were sensitive to cold shock, particularly during the lag and early log phases of growth. For this reason, accurate plate counts were obtained by dilution of the culture in room temperature medium rather than cold medium.
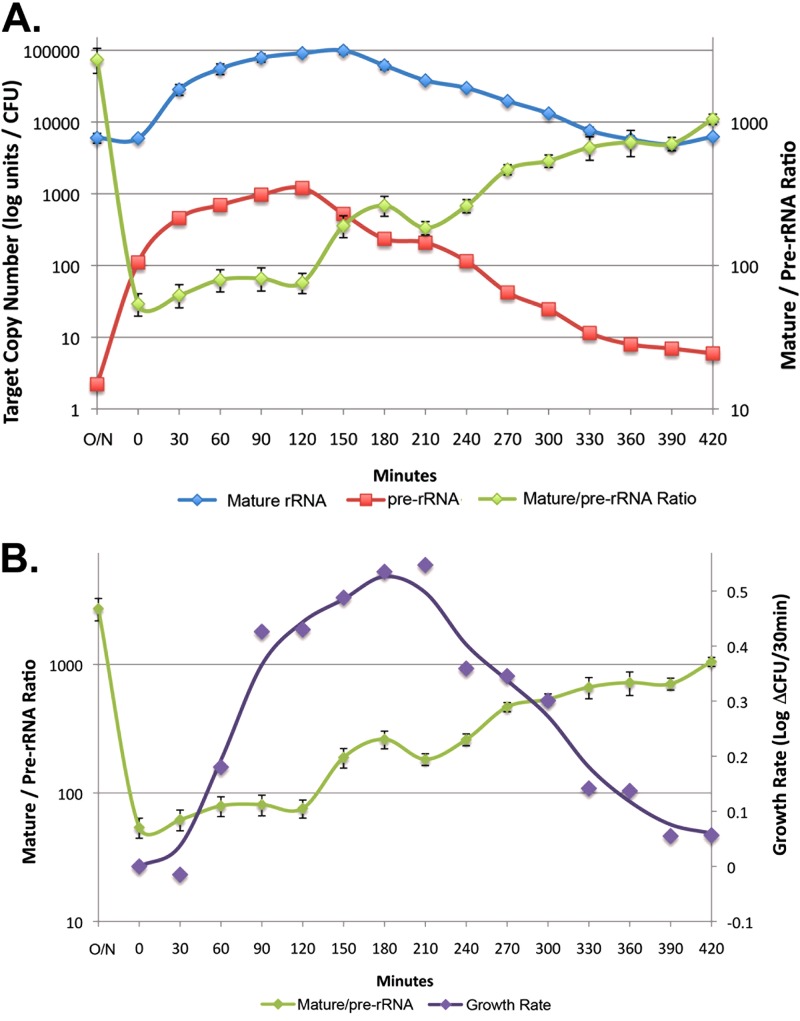
Immediately after inoculation of overnight culture into fresh growth medium (Table 2, time zero), there was a 55-fold increase in pre-rRNA from 2 copies per cell to 110 copies per cell, indicating a dramatic induction of rRNA synthesis. At that point, the ratio of mature rRNA to pre-rRNA reached a nadir of 54:1. As shown in Fig. 3, pre-rRNA levels continued to increase during the first 2 h of incubation, peaking at 120 min after incubation at 1,200 copies per cell. As pre-rRNA was converted to mature rRNA, copies of mature rRNA peaked at >98,000 copies per cell at 150 min after inoculation. Despite a gradual drop in both mature rRNA and pre-rRNA thereafter, the growth rate peaked at 210 min at 1.1-log-unit increases in cellular concentration per hour, which equals a doubling time of 16.5 min. During the later phases of growth, pre-rRNA copy numbers dropped more quickly than mature rRNA copy numbers, eventually leading to an increase in the ratio of mature rRNA to pre-rRNA of >1,000:1.
Table 2.
Pre-rRNA and mature rRNA quantitation during E. coli growth phases
| Time point (min) | OD600 | CFU/ml | Ratea | Doublingb | Generation time (min) | rRNAc | Pre-rRNAc | Ratio | Growth phase |
|---|---|---|---|---|---|---|---|---|---|
| Overnight culture | 2.307 | 6.67E + 09 | 6,009 | 2 | 2,720 | Stationary phase | |||
| 0 | 0 | 5.90E + 05 | 5,942 | 110 | 54 | Lag phase | |||
| 30 | 0 | 5.70E + 05 | 28,427 | 457 | 62 | ||||
| 60 | 0.003 | 8.63E + 05 | 0.18 | 1.20 | 50.08 | 55,278 | 696 | 79 | Log phase |
| 90 | 0.008 | 2.30E + 06 | 0.43 | 2.83 | 21.19 | 78,741 | 970 | 81 | |
| 120 | 0.024 | 6.20E + 06 | 0.43 | 2.86 | 21.00 | 91,049 | 1200 | 76 | |
| 150 | 0.068 | 1.91E + 07 | 0.49 | 3.24 | 18.51 | 98,782 | 523 | 189 | |
| 180 | 0.175 | 6.53E + 07 | 0.53 | 3.55 | 16.88 | 61,571 | 235 | 262 | |
| 210 | 0.409 | 2.30E + 08 | 0.55 | 3.64 | 16.50 | 38,033 | 208 | 183 | |
| 240 | 0.707 | 5.27E + 08 | 0.36 | 2.39 | 25.14 | 29,801 | 114 | 260 | Early stationary phase |
| 270 | 1.095 | 1.17E + 09 | 0.35 | 2.30 | 26.14 | 19,610 | 42 | 466 | |
| 300 | 1.466 | 2.33E + 09 | 0.30 | 2.00 | 30.00 | 13,162 | 25 | 536 | |
| 330 | 1.686 | 3.23E + 09 | 0.14 | 0.94 | 63.74 | 7,608 | 11 | 665 | Stationary phase |
| 360 | 1.834 | 4.43E + 09 | 0.14 | 0.91 | 65.87 | 5,734 | 8 | 723 | |
| 390 | 1.957 | 5.03E + 09 | 0.06 | 0.37 | 163.81 | 4,899 | 7 | 706 | |
| 420 | 2.051 | 5.73E + 09 | 0.06 | 0.38 | 159.68 | 6,230 | 6 | 1,049 |
Growth rate in log units per 30 min.
Doublings per hour.
Copies per cell.
Fig 3.
Variations in pre-rRNA and rRNA levels during E. coli growth. (A) Changes in mature rRNA, pre-rRNA, and their ratio were measured in overnight cultures that were subsequently inoculated into fresh MH growth medium and incubated for 7 h at 37°C. (B) Comparison of the mature/pre-RNA ratio and growth rate during different phases of growth. The growth rate curve is a weighted average determined from the change in CFU during each 30-min time period. Error bars estimated the standard deviations.
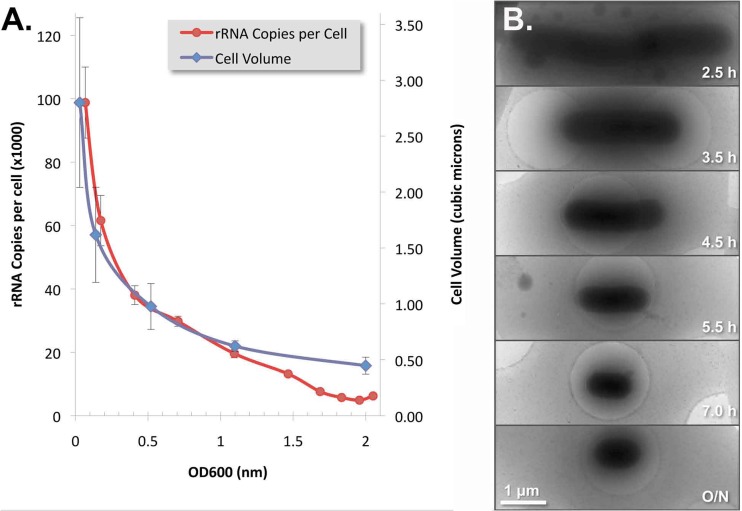
As shown in Fig. 4A, there was a good correlation between cell volume and rRNA copies per cell during log and late log phases of growth, indicating a relatively constant rRNA density in the cytoplasm. This correlation was lost at cell densities above an OD600 of 1.0, at which point the cell volume stabilized while the rRNA copy number continued to fall. Cryo-electron microscopy was performed to measure E. coli cell volumes at different growth phases. As shown in Fig. 4B, E. coli cells became progressively shorter and thinner as cells went from log phase to stationary phase. The peak average cell size was 2.8 μm3 (4.87 μm long by 0.85 μm wide), and the smallest average cell size was 0.45 μm3 (1.35 μm long by 0.65 μm wide).
Fig 4.
E. coli cell volume versus rRNA copy number during different growth phases. (A) Correlation between the cell volume and rRNA copy number per cell at densities below an OD600 of ≤1.0. (B) Electron micrographs demonstrating progressively smaller cells over incubation time from log phase (2.5 h) to stationary phase (7 h). Error bars estimated the standard deviations.
Effects of antibiotics on mature rRNA and pre-rRNA levels.
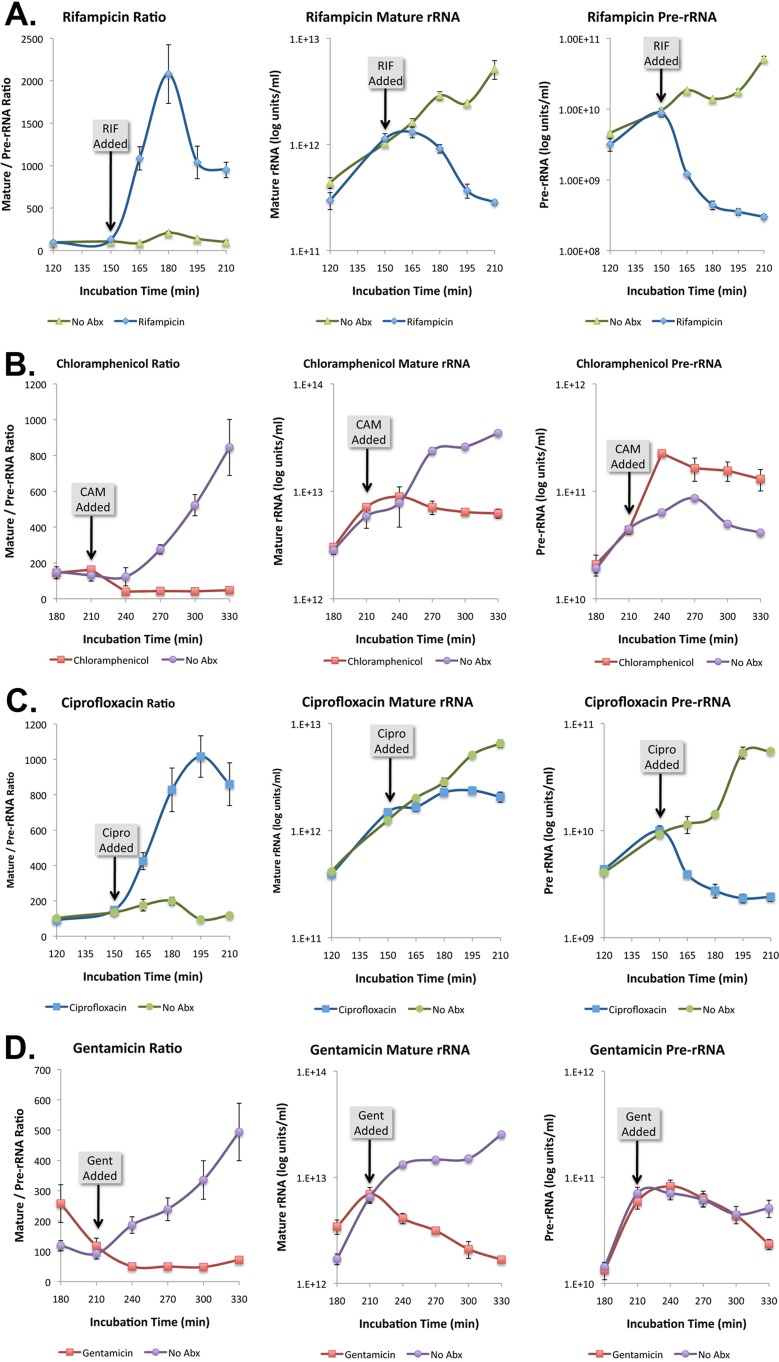
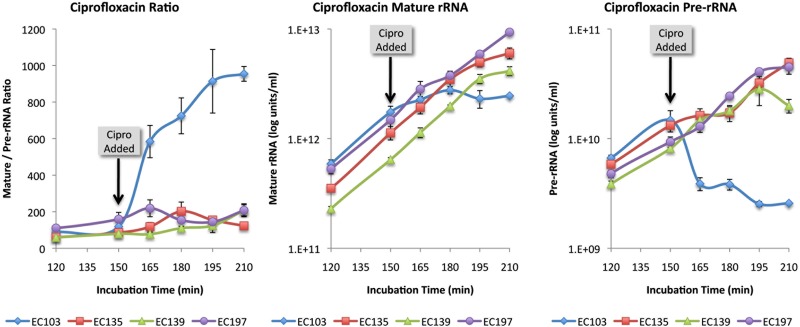
To confirm that the pre-rRNA capture and detector probes were selective for the desired target, we examined the effects of rifampin and chloramphenicol on pre-rRNA levels relative to mature rRNA. Consistent with a previous report (14), addition of rifampin caused a selective drop in pre-rRNA, while chloramphenicol caused a selective increase in pre-rRNA (Fig. 5A and B). The effects of ciprofloxacin and gentamicin on pre-rRNA and mature rRNA levels were also examined. As shown in Fig. 5C, ciprofloxacin had an effect similar to that of rifampin; pre-rRNA levels dropped significantly within 15 min while mature rRNA remained at control levels until 45 min after addition of the antibiotic. In contrast, there was no effect of this antibiotic on the pre-rRNA levels of ciprofloxacin-resistant organisms (Fig. 6). Addition of gentamicin resulted in a decrease in mature rRNA without affecting the level of pre-rRNA (Fig. 5D).
Fig 5.
(A to D) Response of mature rRNA and pre-rRNA to antibiotics. Antibiotics have differential effects on rRNA and pre-rRNA. Rifampin and ciprofloxacin selectively inhibited transcription of new pre-rRNA, while the addition of chloramphenicol and gentamicin resulted in a selective decrease in mature rRNA. Error bars estimated the standard deviations.
Fig 6.
Comparison of ciprofloxacin-susceptible and -resistant E. coli strains. rRNA and pre-rRNA were measured in cultures of an E. coli clinical isolate susceptible to ciprofloxacin (EC103) and three ciprofloxacin-resistant isolates (EC135, EC139, and EC197). The amount of pre-rRNA in strain EC103 was significantly lower than that of the ciprofloxacin-resistant isolates within 15 min after addition of the antibiotic. Error bars estimated the standard deviations.
DISCUSSION
In this report, we describe an electrochemical sensor assay for detection and quantitation of pre-rRNA. Pre-rRNA represents a labile pool of rRNA precursor molecules produced during rRNA transcription. Pre-rRNA differs from mature rRNA by the presence of 5′ and 3′ tails that are removed during the maturation process. Because pre-rRNA represents a relatively small fraction (0.1% to 10%) of total rRNA, a sensitive assay is required for its detection. To achieve the needed sensitivity, our electrochemical Au sensor assay relies on the use of a ternary interface involving hexanedithiol coimmobilized with a thiolated capture probe, followed by the incorporation of 6-mercapto-1-hexanol as diluent. This new interface has been shown to offer a greatly improved surface blocking and maximal hybridization efficiency allowing ultrasensitive electrochemical detection of target nucleic acids (10–12). Direct nucleic acid detection methods, such as our electrochemical sandwich hybridization assay, have inherent advantages over methods that require target amplification, such as quantitative reverse transcription-PCR (qRT-PCR). We were able to quantitate pre-rRNA during different E. coli growth phases and documented dramatic shifts in copy number, from 2 to 1,200 copies per cell in the stationary and log phases of growth, respectively. To our knowledge, this is the first time that pre-rRNA copy numbers per cell have been quantitated electrochemically. The 600-fold increase in pre-rRNA copy number that we observed is considerably larger than the 50-fold increase reported by Cangelosi et al. (14) using luminescence detection. Possible reasons for this difference include a low limit of detection and the E. coli strain type. Cangelosi et al. examined the E. coli type strain ATCC 11775, which was isolated in 1895 by Migula and may have undergone metabolic changes during passage. In contrast, our studies were performed on a recently isolated wild-type uropathogenic E. coli strain with a relatively fast peak doubling time of 16.5 min.
Antibiotics differ in their effects on pre-rRNA and mature rRNA. Rifampin is an inhibitor of prokaryotic DNA-dependent RNA polymerase. Because pre-rRNA is rapidly processed to mature rRNA, inhibiting transcription quickly reduces the pool of pre-rRNA, especially during the log phase of growth. In contrast, chloramphenicol and gentamicin are protein synthesis inhibitors. Chloramphenicol acts by binding to the 23S subunit of bacterial ribosomes to inhibit protein synthesis, whereas gentamicin acts by inhibiting the proofreading function of ribosomes, thereby introducing translation errors and premature peptide chain termination events. In either case, these protein synthesis inhibitors should not directly interfere with pre-rRNA synthesis. Accordingly, we observed a decrease in the pool of mature rRNA, presumably because of the loss of proteins required for ribosome formation and stability. In the case of chloramphenicol, inhibition of pre-rRNA processing resulted in not only a decrease of mature rRNA but an increase in pre-rRNA (Fig. 5B).
Ciprofloxacin is a quinolone antibiotic that inhibits the activity of DNA gyrase, the bacterial topoisomerase that introduces and relaxes DNA supercoils. Relaxing of supercoils is required for unpackaging of DNA prior to not only DNA replication but also RNA transcription (15). As in the case of rifampin, inhibition of RNA transcription by ciprofloxacin resulted in a rapid decrease in pre-rRNA, detectable within 15 min after addition of the antibiotic. Quinolone resistance typically results from gyrase mutations that prevent binding of the quinolone to the gyrase. As expected, addition of ciprofloxacin had no discernible effect of pre-rRNA levels in ciprofloxacin-resistant organisms (Fig. 6).
There is a considerable interest in methods for determining the susceptibility of bacteria in clinical specimens in a time frame sufficient to impact clinical decision making. A major drawback of current clinical bacteriology methods is the need to isolate bacteria on solid agar media when processing a clinical specimen. In the absence of expeditious antibiotic susceptibility testing, clinicians typically initiate “empirical” antibiotic treatment, meaning that antibiotics are chosen based on prior knowledge of potential organisms and their antibiotic resistance patterns. Empirical antibiotics for bacteremia are typically broad-spectrum to treat a wide variety of possible bacterial pathogens. This approach is especially problematic in the management of complex urinary tract infections where quinolone resistance rates are typically 20 to 30% (16). In addition, overuse of broad-spectrum antibiotics contributes to the emergence of antibiotic resistance by applying selective pressure to the patient's flora and favoring colonization by resistant organisms.
To address the need for antibiotic resistance data at the time of initial antibiotic selection, methods are needed to analyze the antibiotic susceptibility of organisms in clinical specimens. The electrochemical sensor assay has been validated on human clinical urine specimens from patients with urinary tract infection (3, 5). Electrochemical sensor assays for pre-rRNA would be expected to be useful for identifying bacteria that are susceptible to antibiotics such as rifampin and ciprofloxacin that directly or indirectly inhibit RNA transcription. It may be possible to extend this approach for antibiotic susceptibility testing to other drugs by first depleting pre-rRNA levels and then measuring the ability of the antibiotic to inhibit pre-rRNA replenishment (17). However, because antibiotics act by widely divergent mechanisms, various approaches may be necessary to achieve comprehensive antibiotic susceptibility testing. For example, we have successfully applied ATP bioluminescence to determine antimicrobial susceptibility of uropathogens within 120 min after inoculation of clinical urine specimens into growth medium with and without antibiotics (18). Application of such assays to bacteria in clinical specimens at the point of care would enable patient-specific antibiotic therapy.
ACKNOWLEDGMENTS
This study was supported by Cooperative Agreement Award AI075565 (to D.A.H.) from the National Institute of Allergy and Infectious Diseases and by the Wendy and Ken Ruby Fund for Excellence in Pediatric Urology Research. B.M.C. is the Judith and Robert Winston Chair in Pediatric Urology. B.H. and J.L. were supported by a grant from Welch Foundation (AU-1714).
Footnotes
Published ahead of print 10 December 2012
REFERENCES
- 1. Wang J. 2008. Electrochemical glucose biosensors. Chem. Rev. 108:814–825 [DOI] [PubMed] [Google Scholar]
- 2. Wang J. 2006. Analytical electrochemistry. J. Wiley, New York, NY [Google Scholar]
- 3. Liao JC, Mastali M, Gau V, Suchard MA, Moller AK, Bruckner DA, Babbitt JT, Li Y, Gornbein J, Landaw EM, McCabe ER, Churchill BM, Haake DA. 2006. Use of electrochemical DNA biosensors for rapid molecular identification of uropathogens in clinical urine specimens. J. Clin. Microbiol. 44:561–570 [DOI] [PMC free article] [PubMed] [Google Scholar]
- 4. Liao JC, Mastali M, Li Y, Gau V, Suchard M, Babbitt JT, Gornbein J, Landaw EM, McCabe ER, Churchill BM, Haake DA. 2007. Development of an advanced electrochemical DNA biosensor for bacterial pathogen detection. J. Mol. Diagn. 9:158–168 [DOI] [PMC free article] [PubMed] [Google Scholar]
- 5. Mach KE, Du CB, Phull H, Haake DA, Shih MC, Baron EJ, Liao JC. 2009. Multiplex pathogen identification for polymicrobial urinary tract infections using biosensor technology: a prospective clinical study. J. Urol. 182:2735–2741 [DOI] [PMC free article] [PubMed] [Google Scholar]
- 6. Mastali M, Babbitt JT, Li Y, Landaw EM, Gau V, Churchill BM, Haake DA. 2008. Optimal probe length and target location for electrochemical detection of selected uropathogens at ambient temperature. J. Clin. Microbiol. 46:2707–2716 [DOI] [PMC free article] [PubMed] [Google Scholar]
- 7. Sun CP, Liao JC, Zhang YH, Gau V, Mastali M, Babbitt JT, Grundfest WS, Churchill BM, McCabe ER, Haake DA. 2005. Rapid, species-specific detection of uropathogen 16S rDNA and rRNA at ambient temperature by dot-blot hybridization and an electrochemical sensor array. Mol. Genet. Metab. 84:90–99 [DOI] [PubMed] [Google Scholar]
- 8. Wu J, Chumbimuni-Torres KY, Galik M, Thammakhet C, Haake DA, Wang J. 2009. Potentiometric detection of DNA hybridization using enzyme-induced metallization and a silver ion selective electrode. Anal. Chem. 81:10007–10012 [DOI] [PMC free article] [PubMed] [Google Scholar]
- 9. Fuchs BM, Wallner G, Beisker W, Schwippl I, Ludwig W, Amann R. 1998. Flow cytometric analysis of the in situ accessibility of Escherichia coli 16S rRNA for fluorescently labeled oligonucleotide probes. Appl. Environ. Microbiol. 64:4973–4982 [DOI] [PMC free article] [PubMed] [Google Scholar]
- 10. Campuzano S, Kuralay F, Jesús Lobo-Castañón J, Bartošík M, Vyavahare K, Paleček E, Haake DA, Wang J. 2011. Ternary monolayers as DNA recognition interfaces for direct and sensitive electrochemical detection in untreated clinical samples. Biosens Bioelectron. 26:3577–3584 [DOI] [PMC free article] [PubMed] [Google Scholar]
- 11. Kuralay F, Campuzano S, Haake DA, Wang J. 2011. Highly sensitive disposable nucleic acid biosensors for direct bioelectronic detection in raw biological samples. Talanta 85:1330–1337 [DOI] [PMC free article] [PubMed] [Google Scholar]
- 12. Wu J, Campuzano S, Halford C, Haake DA, Wang J. 2010. Ternary surface monolayers for ultrasensitive (zeptomole) amperometric detection of nucleic acid hybridization without signal amplification. Anal. Chem. 82:8830–8837 [DOI] [PMC free article] [PubMed] [Google Scholar]
- 13. Bremner H, Dennis PP. 1996. Modulation of chemical composition and other parameters of the cell by growth rate, p 1553–1569 In Neidhardt FC. (ed), Escherichia coli and Salmonella, vol 2 ASM Press, Washington, DC [Google Scholar]
- 14. Cangelosi GA, Barbant WH. 1997. Depletion of pre-16S rRNA in starved Escherichia coli cells. J. Bacteriol. 179:4457–4463 [DOI] [PMC free article] [PubMed] [Google Scholar]
- 15. Willmott CJ, Critchlow SE, Eperon IC, Maxwell A. 1994. The complex of DNA gyrase and quinolone drugs with DNA forms a barrier to transcription by RNA polymerase. J. Mol. Biol. 242:351–363 [DOI] [PubMed] [Google Scholar]
- 16. Cullen IM, Manecksha RP, McCullagh E, Ahmad S, O'Kelly F, Flynn RJ, McDermott T, Murphy P, Grainger R, Fennell JP, Thornhill JA. 2011. The changing pattern of antimicrobial resistance within 42,033 Escherichia coli isolates from nosocomial, community and urology patient-specific urinary tract infections, Dublin, 1999–2009. BJU Int. 109:1198–1206 [DOI] [PubMed] [Google Scholar]
- 17. Cangelosi GA, Brabant WH, Britschgi TB, Wallis CK. 1996. Detection of rifampin- and ciprofloxacin-resistant Mycobacterium tuberculosis by using species-specific assays for precursor rRNA. Antimicrob. Agents Chemother. 40:1790–1795 [DOI] [PMC free article] [PubMed] [Google Scholar]
- 18. Ivancic V, Mastali M, Percy N, Gornbein J, Babbitt JT, Li Y, Landaw EM, Bruckner DA, Churchill BM, Haake DA. 2008. Rapid antimicrobial susceptibility determination of uropathogens in clinical urine specimens by use of ATP bioluminescence. J. Clin. Microbiol. 46:1213–1219 [DOI] [PMC free article] [PubMed] [Google Scholar]


