

Abstract
Proteus mirabilis is an opportunistic pathogen that is frequently associated with urinary tract infections. In the lab, P. mirabilis cells become long and multinucleate and increase their number of flagella as they colonize agar surfaces during swarming. Swarming has been implicated in pathogenesis; however, it is unclear how energetically costly changes in P. mirabilis cell morphology translate into an advantage for adapting to environmental changes. We investigated two morphological changes that occur during swarming—increases in cell length and flagellum density—and discovered that an increase in the surface density of flagella enabled cells to translate rapidly through fluids of increasing viscosity; in contrast, cell length had a small effect on motility. We found that swarm cells had a surface density of flagella that was ∼5 times larger than that of vegetative cells and were motile in fluids with a viscosity that inhibits vegetative cell motility. To test the relationship between flagellum density and velocity, we overexpressed FlhD4C2, the master regulator of the flagellar operon, in vegetative cells of P. mirabilis and found that increased flagellum density produced an increase in cell velocity. Our results establish a relationship between P. mirabilis flagellum density and cell motility in viscous environments that may be relevant to its adaptation during the infection of mammalian urinary tracts and movement in contact with indwelling catheters.
INTRODUCTION
Proteus mirabilis is a Gram-negative rod-shaped gammaproteobacterium that is commonly associated with urinary tract infections (1) and the biofouling of catheters (2–4). P. mirabilis may also be present in the human gut microflora (5) and is correlated with the incidence of colitis (6, 7). Broth-grown vegetative cells of P. mirabilis are characteristically ∼2 μm long and have a peritrichous distribution of ∼4 to 10 flagella. The flagella form a bundle that performs work on the surrounding fluid and propels cells forward via a mechanism that is similar to the motility system of Escherichia coli (8, 9).
Broth-grown vegetative cells of P. mirabilis in contact with the surface of agar gels infused with nutrients change their morphology, become “swarmers,” and colonize the surface by coordinating the movement of large groups of cells (i.e., “swarming”) (see Fig. 1A). P. mirabilis swarm colonies exhibit a terraced pattern of concentric rings (see Fig. S1 in the supplemental material) (10). These rings are produced by alternating phases of consolidation, during which the colony does not expand and cells are dedifferentiated into a vegetative cell-like morphology, and swarming, during which cells are motile and differentiated (11). Motility occurs predominantly at the swarm front and decreases with increasing distance from the front; cells near the center of the swarm are nonmotile. Swarming has several characteristics, including the following: (i) the inhibition of cell division to produce long (10- to 70-μm) multinucleate cells, (ii) an increase in the surface density of flagella, (iii) the secretion of biomolecules that alter the surface tension of water and extract a thin layer of fluid from the gel, and (iv) the movement of cells in close physical proximity within the thin layer of fluid (11–14). In this work, we investigated whether cell length and flagellum density confer an advantage for swarm cell motility.
Fig 1.
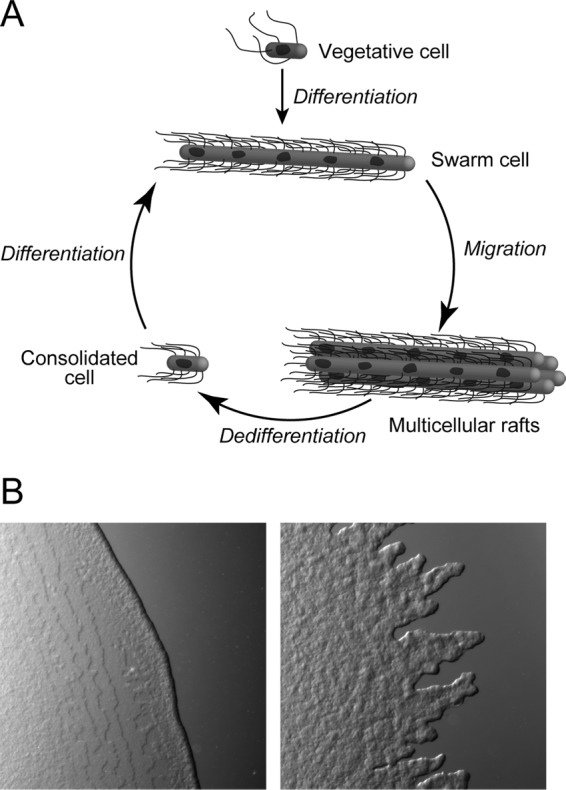
(A) A cartoon of a current model for the P. mirabilis swarming life cycle (adapted from Soft Matter (12) with permission of the publisher). Vegetative cells in contact with an agar surface morphologically differentiate into swarm cells, assemble into multicellular rafts, and move across the surface cooperatively. Swarm cells dedifferentiate into consolidated cells. (B) Bright-field microscopy images of the leading edge of a P. mirabilis swarm colony during migration (left panel) and consolidation (right panel).
Bacteria live at a low Reynold's number, where viscous forces play a central role in motility (15), and flagella enable P. mirabilis cells to move through fluids at a relatively high energetic cost to the cell (∼2% of the total energy of the cell) (16). The motility of vegetative bacterial cells increases as the dynamic viscosity of the surrounding fluid increases; above a threshold that varies for different species of bacteria, cell velocity decreases rapidly (17–23). The viscosity required for complete inhibition of motility varies widely, with values ranging from 0.06 to ∼1 Pa · s (17). The relationship between velocity and viscosity can be explained in part by treating the liquid as a loose, quasirigid network that increases the resistance to cell movement in the direction normal to the cell body (24). P. mirabilis vegetative cell motility in viscous liquids has been investigated (25); however, little is known about the effect of increasing viscosity on the motility of swarm cells of bacteria, including P. mirabilis.
In this work, we quantified the connection between motility, cell length, and the surface density of flagella on P. mirabilis cells. We tested the hypothesis that these phenotypes convey an advantage for the movement of P. mirabilis swarm cells through viscous fluids, including the extracellular environment found in swarms (26, 27). We isolated and characterized populations of P. mirabilis cells with the following combinations of cell length and flagellum density: (i) short cells with a normal density of flagella (vegetative cells), (ii) long cells with a normal density of flagella (elongated vegetative cells), (iii) long cells with a high density of flagella (swarm cells), and (iv) short cells with a high density of flagella (consolidated cells). We quantitatively measured the motility of individual cells of each of these categories in liquids that had a range of viscosities. These experiments enabled us to determine the roles of cell length and flagellum density in bacterial cell motility in viscous environments.
Additionally, we examined the effect of overexpressing flhDC, a well-established regulator of swarming, on cell motility. Transient upregulation of the flhDC genes during swarming contributes to the high density of flagella on P. mirabilis cells and may be involved in regulation of cell division (28, 29). We hypothesized that the additional expression of flhDC may increase the density of flagella compared to that of wild-type (WT) cells and convey an advantage in cell motility relative to wild-type swarm or vegetative cells.
In this work, we demonstrated that the motility of P. mirabilis cells in viscous fluids is correlated with the surface density of flagella. Not only are swarm cells (long and hyperflagellated) faster than vegetative cells; importantly, FlhDC-overexpressing vegetative cells (short and hyperflagellated) are also faster than wild-type vegetative cells with a normal flagellum density. These results suggest that an increase in flagellum density is important for P. mirabilis motility in viscous fluids and provide insight into the movement of P. mirabilis cell types in the viscous environment of swarming colonies.
MATERIALS AND METHODS
Bacterial strains and cell culture.
P. mirabilis strain HI4320, a clinical strain isolated from a patient with urinary catheter-associated bacteriuria, was used for all of the cell motility studies in this work (30). The plasmid pflhDC contains the flhDC genes from P. mirabilis inserted into pACYC184 (a plasmid with a p15A origin and 10 to 12 copies per cell) and encodes the expression of FlhD and FlhC, which are affinity tagged with FLAG and His-6, respectively. We transformed plasmid pflhDC into wild-type strain HI4320 via electroporation and selected transformants on LB agar plates (3% [wt/vol]) containing chloramphenicol (34 μg/ml). We grew bacteria in nutrient medium consisting of 1% (wt/vol) peptone (Becton, Dickinson, Sparks, MD), 0.5% (wt/vol) yeast extract (Becton, Dickinson), and 1% (wt/vol) NaCl (Fisher Scientific, Fairlawn, NJ) at 30°C in a shaking incubator. We used liquid nutrient medium containing 1.5% (wt/vol) Difco agar (Becton, Dickinson) for swarming assays.
Harvesting samples with different morphologies.
We prepared culture medium for isolating swarm and consolidated P. mirabilis cells by inoculating cells onto the surface of a 1.5% (wt/vol) Bacto Difco agar gel infused with nutrient broth. Specifically, we pipetted 50 ml of hot swarm agar into 150- by 15-mm petri dishes (Becton, Dickinson), solidified the agar at 25°C for 30 min, and removed excess liquid from the surface by storing the plates in a laminar flow hood for 20 min with the covers of the dishes ajar. We inoculated each plate with 4 μl of a suspension of ∼4 × 10⁵ P. mirabilis cells/ml. Following the absorption of the inoculum liquid into the swarm agar (∼20 min), plates were incubated at 30°C at 90% relative humidity in a static incubator.
After 15 h of incubation, we harvested swarm cells from the smooth leading edge of a migrating colony on an agar plate (see Fig. 1B) by removing them carefully using a 1-μl calibrated inoculation loop (220215; Becton, Dickinson). We harvested consolidated cells from the leading edge of a colony that had a “fingered” appearance after 19 h of incubation. Cells were rinsed from the inoculation loop into 500 μl of motility buffer (0.01 M KPO4, 0.067 M NaCl, 10−4 M EDTA, pH 7.0, containing 0.1 M glucose and 0.001% Brij-35) and centrifuged for 10 min at 1,500 × g. The cell pellet was then resuspended as required for the various assays described below.
Vegetative cells were prepared by growing P. mirabilis overnight at 30°C in a shaking incubator. Saturated overnight cultures were diluted 100-fold in 11 ml of fresh nutrient medium and grown in 150-ml Erlenmeyer flasks at 30°C in a shaking incubator at 200 rpm. We observed that the highest swimming velocity of vegetative cells occurred during stationary phase, so vegetative cells were harvested at an absorbance (λ = 600 nm) of ∼3.2 and centrifuged. We harvested elongated vegetative cells by diluting saturated overnight cultures 100-fold in 5 ml of fresh nutrient medium and growing them at 30°C in a shaking incubator at 200 rpm to an absorbance (λ = 600 nm) of ∼1.1. Cells were diluted 5-fold with fresh nutrient medium, aztreonam was added to a final concentration of 10 μg/ml, and cells were grown at 30°C in a shaking incubator at 200 rpm for 70 min. Cells were harvested and centrifuged.
Quantitative Western blotting.
Samples of the eight different cell morphologies of interest were harvested as described above. Samples were then diluted in fresh medium to an absorbance of 0.75. Cells were lysed using Novagen BugBuster master mix (Darmstadt, Germany) according to the manufacturer's instructions, and cell lysate was aliquoted and stored at −80°C until use. One aliquot was used to determine the total protein concentration using the Pierce bicinchoninic acid (BCA) protein assay kit (Rockford, IL). Immediately prior to use, all samples were thawed and diluted to a concentration of 500 μg/ml. To ensure that samples were within the range of the calibration curve, WT, pACYC, and pflhDC swarm samples were further diluted by a factor of 20. WT consolidated and pflhDC vegetative samples were further diluted by a factor of 5. To account for a nonlinear response of the detector, a range of dilutions (from 1:5 to 1:200) of the 500-μg/ml WT swarm sample were also run on each gel as a calibration curve. All samples were mixed 1:1 with Laemmli sample buffer (Bio-Rad, Hercules, CA) and subjected to electrophoresis in triplicate on three 12% polyacrylamide gels. Proteins were transferred to nitrocellulose for 1.5 h at 100 V. The nitrocellulose was rinsed several times with distilled water (dH2O) and blocked overnight at 4°C in 5% nonfat dry milk in TBST (20 mM Tris, 137 mM NaCl, 1% [vol/vol] Tween 20, pH 7.6). Blots were washed 3 times, 5 min each, in TBST. Primary antibody against FliC was diluted 1:20,000 in 5% bovine serum albumin (BSA) in TBST, and blots were incubated in this solution for 1 h. Blots were washed three times, 5 min each, in TBST. Goat anti-rabbit IgG secondary antibody conjugated to horseradish peroxidase (HRP) was diluted 1:75,000 in 2.5% nonfat dry milk in TBST, and blots were incubated in this solution for 1 h. Blots were washed 3 times, 5 min each, in TBST. The surface of each blot was then incubated in ECL Plus reagent (GE Healthcare) for 2 min, and blots were imaged using the ECL Plus setting on a Typhoon FLA 900 scanner (GE Healthcare). Band volumes were quantified using ImageQuant (GE Healthcare). The data from each gel was corrected using the calibration curve specific to that gel. Two identical gels were run in parallel for each of three biological replicates.
Immunofluorescence microscopy of P. mirabilis flagella.
We isolated flagella from HI4320 cells to generate a polyclonal antibody to the FliC1 protein. Flagella were removed and purified, following the methodology of Ibrahim et al. (31). The flagellin prep was lyophilized, and the presence of FliC1 was confirmed via mass spectrometry (MSBioworks, LLC, Ann Arbor, MI). Flagellin was sent to Rockland Immunochemicals, Inc. (Gilbertsville, PA), for the immunization of rabbits and the production of polyclonal antibody. The antibody was purified from serum by first performing a buffer exchange using Zeba desalt spin columns (Pierce Biotechnology, Rockford, IL) and then purifying IgG using a Melon gel IgG purification kit (Pierce Biotechnology) according to the manufacturer's instructions.
We performed immunostaining using a procedure modified from that described by Wozniak et al. (32). Slides and coverslips were cleaned using RCA solution, dried under a stream of nitrogen, and assembled into chambers as described. Twenty microliters of poly-l-lysine was added to each chamber, and the slide chambers were inverted for 3 min. Fifteen microliters of culture, harvested as described above, was added twice to each chamber, and the slide chambers were inverted for 3 min. Twenty microliters of 1% formaldehyde in 1× phosphate-buffered saline (PBS) was added to one side of the chamber (“side 1”), and the slide chambers were inverted for 10 min. Twenty microliters of 1% formaldehyde in 1× PBS was added to the other side of the chamber (“side 2”), and the slide chambers were inverted for 10 min. Twenty microliters of blocking buffer (3% BSA and 0.2% Triton X-100 in 1× PBS) was added to side 1 of the chamber. The slide chambers were inverted onto wooden dowels placed in 150-mm petri dishes. The inner edges of the petri dishes were surrounded with damp Kimwipes, and the petri dishes were covered, parafilmed, and stored at 4°C overnight. The following day, primary antibody was diluted 1:100 in blocking buffer. Twenty microliters of antibody solution was added to side 1 of the chamber, and the slide chambers were inverted for 1 h. Twenty microliters of antibody solution was added to side 2 of the chamber, and the slide chambers were inverted for 1 h. Twenty microliters of washing buffer (0.2% BSA plus 0.05% Triton X-100 in 1× PBS) was added to side 1 of the chamber. Secondary antibody (Alexa Fluor 488 goat anti-rabbit IgG; Invitrogen, Grand Island, NY) was diluted 1:50 in blocking buffer. Twenty microliters of antibody solution was added to side 1 of the chamber, and the slide chambers were inverted for 30 min. Twenty microliters of antibody solution was added to side 2 of the chamber, and the slide chambers were inverted for 30 min. Twenty microliters of washing buffer was added to side 1 of the chamber, followed by 20 μl of 1× PBS. Slides were sealed with VALAP (equal parts Vaseline, lanolin, and paraffin wax) and imaged.
Following background subtraction, images were thresholded and masks were created to block out the fluorescence from the cell bodies. The flagellum-associated fluorescence (i.e., the total fluorescence within a certain distance from the cell) was then determined. Finally, the dimensions of the cell were used to normalize the resulting data for surface area. To validate our method, the flagella on each cell in the wild-type vegetative samples were counted. Plotting fluorescence intensity per surface area as a function of the number of flagella per surface area produced a linear relationship with an r-squared value of 0.66.
Quantitative PCR.
Samples of the eight different cell morphologies of interest were harvested as described above. Two biological replicates of each sample were collected and analyzed in triplicate technical replicates. Cells were diluted in an ice-cold ethyl alcohol (EtOH)-phenol stop solution (5% water-saturated phenol) and immediately spun at 8,000 × g for 5 min at 4°C. After aspiration of the medium, the cell pellets were resuspended in Tris-EDTA (TE) buffer (pH 8.0) containing lysozyme and sodium dodecyl sulfate and heated at 64°C for 2 min. Following cell lysis, total RNA was isolated using a hot phenol extraction followed by a chloroform extraction step and finally an ethanol precipitation step. Samples were then treated with DNase I to remove contaminating DNA before the reverse transcriptase reaction. Isolation of total RNA was completed by sequentially performing the following steps: one phenol extraction, one phenol-chloroform (50:50) extraction, two chloroform extractions, and finally an EtOH precipitation. Total RNA from each sample was quantified using a Nanodrop spectrophotometer (Thermo Scientific, Wilmington, DE). An aliquot of each sample was subsequently diluted to 100 μg/ml in diethyl pyrocarbonate (DEPC)-treated water. RNA was converted to cDNA using the Bio-Rad Laboratories iScript cDNA synthesis kit (catalog number 170-8890). Quantitative PCR was performed using the Bio-Rad iQ SYBR green supermix kit (catalog number 170-8880) and the primers M316 (5′-TTTGCTTTTGGCGCAGAG-3′) and M317 (5′-GTGCATCAGCCATAGAATCG-3′) for detection of flhD mRNA and M319 (5′-GCGAAAGATATTCGCCTAGC-3′) and M320 (5′-AACGCCCTCGACTTAATTGC-3′) for flhC mRNA. PCR and sample analysis were performed using a Bio-Rad CFX96 Touch real-time PCR detection system and the CFX Manager software program, respectively.
Preparation of PVP K90 solutions and rheology measurements.
We prepared a stock solution (∼20% [wt/vol]) of polyvinylpyrrolidone (PVP) K90 (average molecular mass = 360 kDa; Wako Pure Chemical Industries, Ltd., Osaka, Japan) by dissolving 200 g of PVP K90 in glucose-free motility buffer while heating and stirring vigorously. The solution was filtered to remove colloidal material. We prepared solutions with lower concentrations of PVP K90 (∼10, 5, 2, 1, 0.5, 0.25, and 0.125% [wt/vol]) by diluting the stock solution in glucose-free motility buffer. PVP K90 solutions were autoclaved and cooled to room temperature, after which glucose was added to a concentration of 0.1 M. Due to the difficulty of accurately measuring large volumes of high-viscosity solutions, we performed loss-on-drying experiments to determine the actual weight percentage of PVP K90 in each solution. The results of these measurements are presented in Table S1 in the supplemental material.
We measured the viscosity of PVP samples at 25°C using a small sample adapter on a Brookfield DVIII rheometer. The polymer solutions were approximately Newtonian and had a flow index coefficient of 0.9, as determined by fitting the data with a power law model. We used a spindle/chamber set that produced a torque above variance. The results of the viscosity measurements are tabulated in Table S1 in the supplemental material.
Measuring viscosity of PVP solutions by fluorescent bead diffusion.
Fluoro-Max-dyed red aqueous fluorescent particles (Thermo Fisher Scientific Inc., Waltham, MA) with a diameter of 100 nm were diluted 1:1,000 from the stock into motility buffer. We then added 1 μl of the particle solution to 50 μl of PVP solution. Samples were pipetted onto a glass slide in the center of a grease ring, covered with a no. 1.5 glass coverslip, and imaged at 25°C on a Nikon Eclipse 80i upright microscope equipped with a black-and-white Andor LucaS electron-multiplying charge-coupled-device (EMCCD) camera (Andor Technology, South Windsor, CT). Images were acquired using an X60 ELWD oil objective (Nikon plan fluor 60/1.40 oil Ph3 DM). Motility videos consisting of 150 to 500 frames were collected with a 33-ms exposure time (30 frames per second). Images were collected using the Metamorph software program (version 7.5.6.0; MDS Analytical Technologies, Downington, PA). We determined the distance traveled by particles between two consecutive frames using the Mosaic plugin (http://www.mosaic.ethz.ch/Downloads/ParticleTracker) for the ImageJ software program (http://rsbweb.nih.gov/ij/) and calculated the viscosity of each solution via the Stokes-Einstein equation.
Measuring viscosity of swarming fluid.
We prepared and inoculated swarm plates as described above. After 16 and 18 h of incubation, we examined the plates by microscopy to find a region of the swarm where cells were no longer moving. Fluoro-Max-dyed red aqueous fluorescent particles with a diameter of 100 nm were diluted 1:1,000 from the stock into motility buffer, and ∼0.1 μl of this solution was pipetted onto a nonmotile region of the swarm. The spot was covered with a no. 1.5 glass coverslip and imaged at 25°C on a Nikon Eclipse 80i upright microscope equipped with a black-and-white Andor LucaS EMCCD camera. Images were acquired using an X60 ELWD oil objective. Videos consisting of 150 to 500 frames were collected with a 33-msec exposure time (30 frames per second). Images were collected using the Metamorph software program, version 7.5.6.0. We determined the distance traveled by particles between two consecutive frames and calculated the viscosity of each solution as described above.
Sample preparation for motility studies.
Samples of the different cell morphologies of interest were harvested as described above. Following centrifugation, we removed the supernatant and suspended the cell pellet in solutions of PVP K90 in motility buffer for cell velocity measurements. We used positive-displacement pipettes (Rainin Instruments LLC, Oakland, CA) to dispense PVP solutions. Approximately 10 μl of a suspension of cells was placed within a thin ring of Apiezon M grease (Apiezon Products M&I Materials Ltd., Manchester, United Kingdom) on a precleaned glass slide and sealed with a no. 1.5 glass coverslip. We measured the velocity of these cells as described in the section below. We found no difference in cell velocity with precleaned glass slides and coverslips compared to that with slides and coverslips treated with a 0.1% (wt/vol) solution of BSA. Therefore, all experiments were performed using untreated glass.
Imaging P. mirabilis cells in viscous solutions.
We imaged cells at 25°C on a Nikon Eclipse 80i upright microscope equipped with a black-and-white Andor LucaS EMCCD camera (Andor Technology, South Windsor, CT). Images were acquired using an X40 ELWD dry objective (Nikon Plan Fluor 40/0.60 dry Ph2 DM). Motility videos consisting of 300 frames were collected with the EM gain off and with a 33-ms exposure time (30 frames per second). Images of cells were collected using Metamorph.
Velocity data analysis.
We measured the velocity of individual cells using a particle-tracking algorithm. Microscopy data were analyzed using the MATLAB computing environment (Mathworks) by identifying the centroid of each bacterium in successive frames and grouping those points together to create a cell trajectory. We combined the position of the cell at each interval in a cell track with the EMCCD frame rate to determine cell velocity. Using this script, we determined the length of each cell and the average cell velocity over the entire track. Tracks that were shorter than 30 frames (1 s) or had a cell displacement of <3 mm were generally discarded, with the exception of those in the 8.34-Pa · s solution, in which cells moved only very short distances.
Analysis of percentage of motile cells in a population.
Videos gathered for tracking individual cells for velocity analysis were also used for determining the number of motile and nonmotile cells in a population. We marked and counted all of the cells in the first frame of each video using ImageJ. The video was played to determine whether the cells marked in the first frame were motile (i.e., the cell actively swam in the viscous motility buffer) or nonmotile (i.e., the cell exhibited only Brownian motion). The percentage of motile cells was calculated by dividing the number of motile cells by the total number of cells marked in the first frame of the video.
RESULTS
Isolating populations of different cell morphologies.
Previous studies have concluded that P. mirabilis swarming involves a “life cycle” consisting of three morphologically distinct cell types: vegetative cells, swarm cells, and consolidated cells (Fig. 1). To quantitatively determine how P. mirabilis cell morphology influences motility, we analyzed the correlation between surface density of flagella and cell velocity in these different types of cells. We therefore isolated populations of P. mirabilis vegetative cells—short cells with a low density of flagella—by growing cells to stationary phase in nutrient broth. Cells grown under these conditions had a mean length of 2.5 ± 0.6 μm (see Fig. S2 and Table S2 in the supplemental material). Swarm cells—long cells with a high density of flagella—isolated from the edge of swarming colonies had a mean length of 19.4 ± 6.2 μm; ∼96% of the isolated cells were ≥10 μm long (see Fig. S2) (33).
Because we were interested primarily in the effect of flagellum density on motility, we needed to control for the difference in the lengths of cells with these two phenotypes. To create filamentous cells with a low surface density of flagella and a length that was similar to that of swarming cells, we treated vegetative P. mirabilis cells with aztreonam, an antibiotic that specifically inhibits penicillin-binding protein 3 and arrests bacterial cell division (34). The elongated vegetative cells we isolated and studied had a mean length of 19.4 ± 5.7 μm; 99% of the cell population had a length of ≥10 μm, which made it consistent with the length of P. mirabilis swarm cells in our studies (see Fig. S2 in the supplemental material). Consolidated cells are predicted to have a length similar to that of vegetative cells (35). We found that consolidated cells isolated from the edges of colonies had a mean length of 5.3 ± 2.6 μm; ∼95% of the cells were <10 μm long (see Fig. S2) (33).
Manipulating flagellum density.
P. mirabilis consolidated cells were longer than we had anticipated. Consequently, we sought a method of producing cells with a high surface density of flagella and a length that more closely matched that of vegetative cells. To increase the density of flagella on vegetative P. mirabilis cells, we controlled the expression of FlhD4C2, the master regulator of flagellum biosynthesis. FlhD and FlhC form a heteromeric complex (36) that activates class II flagella genes, including the alternative sigma factor σ28, and leads to expression of class III flagellum genes (37–39). FlhD4C2 also regulates the expression of genes that are not related to flagellum biogenesis, including cell division and aspects of metabolism (29, 40–45).
We isolated vegetative and swarm cells of P. mirabilis harboring a low-copy-number plasmid containing flhDC (pflhDC). pflhDC-containing vegetative cells from broth cultures had an average length of 3.0 ± 1.0 μm. Swarm cells containing pflhDC were harvested from agar plates and had an average length of 23.3 ± 12.3 μm; 88% of the swarm pflhDC cells were ≥10 μm long (see Fig. S2 in the supplemental material). Both vegetative and swarm cells harboring pflhDC were slightly longer than the corresponding cell types that did not contain pflhDC. pflhDC-containing P. mirabilis cells colonized surfaces in a continuous swarming phase and produced a colony with a structure that lacked the usual terraced pattern of concentric rings (see Fig. S1). This change in the community structure prevented us from isolating cells in the middle of a defined swarming phase. Instead, we harvested pflhDC-containing cells at the same time as wild-type swarm cells. The lack of a defined swarm phase complicated the isolation of a reproducible population of P. mirabilis swarm cells containing pflhDC and may have increased the variability of cell length.
Measuring surface density of flagella.
To characterize the morphologies of the different cell types, we performed quantitative Western blotting and measured the amount of FliC—the primary protein forming the flagellar filament—in P. mirabilis cells. As expected, the concentration of FliC in elongated vegetative cells was approximately equal to that in wild-type vegetative cells. The concentration of FliC in swarm and consolidated cells was 46-fold and 14-fold greater, respectively, than that in vegetative cells (Fig. 2A; see also Table S2 in the supplemental material). Surprisingly, these data revealed that consolidated cells have a concentration of FliC that is greater than that of vegetative cells but lower than that of swarm cells. Vegetative and swarm cells overexpressing flhDC had 18- and 53-fold more FliC, respectively, than wild-type vegetative cells. Vegetative and swarm cells containing the empty vector pACYC184 were the same as their wild-type phenotypes (P > 0.05). Vegetative pflhDC cells have higher levels of flhDC mRNA than wild-type swarm cells (see Fig. S3), and yet they express less FliC. This observation suggests that other factors may play a role in regulating flagellum biosynthesis during swarming.
Fig 2.
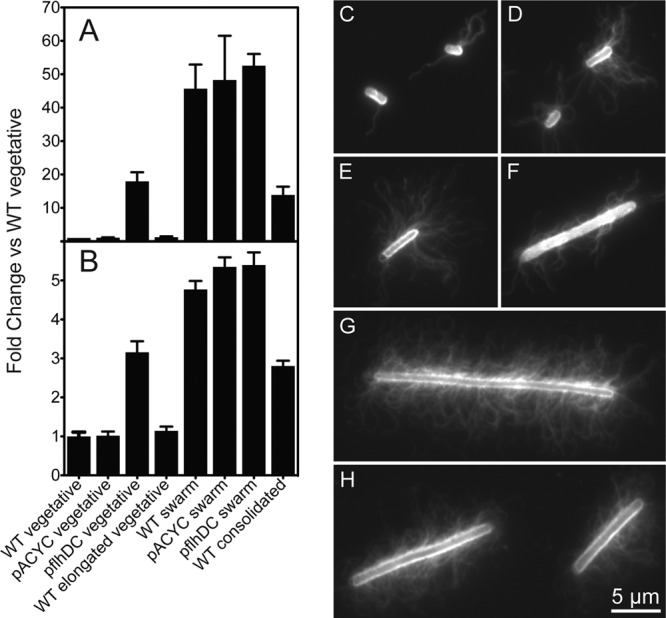
P. mirabilis swarm cells have a significantly greater flagellum density than vegetative cells; consolidated cells have an intermediate density of flagella. (A) Quantitative Western blot data. Equivalent amounts of total protein were loaded for each sample. Each bar represents the mean for 3 independent biological replicates. Error bars represent the standard errors of the means. (B) Immunofluorescence data. Fluorescence data were normalized by cell surface area to represent the surface density of flagella. Each bar represents the mean of 48 to 135 measurements. Error bars represent the standard errors of the means. (C to H) Representative images of cells labeled with an anti-FliC primary antibody and an Alexa Fluor 488-conjugated secondary antibody: wild-type vegetative (C), pflhDC vegetative (D), wild-type consolidated (E), wild-type elongated vegetative (F), wild-type swarm (G), or pflhDC swarm (H).
To confirm the Western blotting results, we quantitatively measured the surface density of flagella using immunofluorescence microscopy (Fig. 2B to H). The density of flagella on the surfaces of swarm cells made it difficult for us to resolve the number of flagella using conventional epifluorescence microscopy techniques. Instead, we used a MATLAB-based image analysis script to quantify the total fluorescence of labeled flagella. The script normalized fluorescence intensity according to the total surface area of each cell, enabling us to measure flagellar surface density. The data supported the trends we observed by quantitative Western blotting. The density of flagella on elongated vegetative cells was nearly identical to that on wild-type vegetative cells. Swarm cells had a 4.8-fold increase in the density of flagella compared to that of vegetative cells; consolidated cells had a 2.8-fold increase in flagella relative to that of vegetative cells (Fig. 2B). As with the Western blot data, these results reveal that consolidated cells do not have the same flagellum density as swarm cells. P. mirabilis cells harboring the control empty vector pACYC184 displayed no change in flagellum density from that of wild-type vegetative cells (P = 1.0), while P. mirabilis vegetative cells transformed with pflhDC had a surface density of flagella that was 3.2-fold greater than that for vegetative cells not harboring the plasmid. As observed by Western blotting, pflhDC did not affect the surface density of flagella on swarm cells (P = 0.36; Fig. 2B). An approximately 10-fold increase in flhDC mRNA (see Fig. S3 in the supplemental material) did not cause a detectable increase in FliC.
Viscosity of the swarm.
To determine how the viscosity of the fluid environment of a swarming colony relates to the range of viscosities in our study, we added 100-nm-diameter fluorescent polystyrene particles to a nonmotile region of the swarm (to avoid movement of the particles due to motile cells) and tracked their movement. We fit the mean square displacement to the Stokes-Einstein equation and determined that the swarm fluid had a viscosity of 0.061 Pa · s. There were no significant differences between data acquired from different plates, in different nonmotile regions of the swarm, or at different time points. This value is in good agreement with data demonstrating that the surfactant layer in an E. coli swarm has a viscosity approximately 10-fold larger than that of water (46). The viscosity of the swarm (0.061 Pa · s) is similar to the viscosity of a 5% (wt/vol) PVP solution (0.08 Pa · s) (see Table S1 in the supplemental material), and thus the range of viscosities that we tested includes a value that is relevant to an environment that P. mirabilis encounters during swarming on agar.
Measuring the velocities of different cell morphologies.
We determined the velocities of the different P. mirabilis phenotypes in fluids with various viscosities using microscopy and particle-based cell tracking algorithms. To manipulate the viscosity of the fluid, we used the linear polymer polyvinylpyrrolidone (PVP), which has been used frequently to control the microviscosity of fluids around bacterial cells (18, 47). We varied the concentration of PVP from 0 to 20% (wt/vol) in motility buffer to produce fluids with viscosities ranging from 0.009 to 8.34 Pa · s. By comparing the velocities of the different cell types, each with a different combination of length and flagellum density, we determined the effects of both of these parameters on P. mirabilis cell velocity in viscous fluids. Imaging was typically completed within 30 min after sample preparation; on this time scale, we did not observe the differentiation of vegetative cells (48) or the dedifferentiation of swarm cells in different PVP solutions.
We did not find an obvious relationship between cell velocity and cell length for the cell morphologies and fluid viscosities that we studied (Fig. 3). Analysis of the r-squared values for the correlation between velocity and length under different conditions revealed very small correlations in most cases (see Table S3 in the supplemental material). However, for unknown reasons, the wild-type vegetative cell type at 0.009 Pa · s, pflhDC vegetative type at 0.83 Pa · s, and pflhDC swarm type at 0.001 and 0.077 Pa · s had r-squared values of ≥0.25.
Fig 3.

Scatter plots showing the relationship between cell length and velocity for each of the cell morphologies used in this study. The symbols represent data acquired in the following viscosity buffers: 0.001 Pa · s (☐), 0.009 Pa · s (+), 0.077 Pa · s (▲), 0.83 Pa · s (●), and 8.34 Pa · s (◊).
The velocities of all cell types peaked at 0.009 Pa · s. However, the mean velocity of wild-type swarm cells was significantly greater than those of all other cell morphologies in solutions ranging from 0.009 to 0.83 Pa · s (P < 0.0001). Swarm cells were motile at 8.34 Pa · s, while wild-type vegetative, elongated vegetative, and consolidated cells were not (Fig. 4A). Swarm cells were slower than vegetative and elongated vegetative cells only in motility buffer that did not contain PVP (viscosity = 0.001 Pa · s). We observed no statistically significant differences between the mean velocities of vegetative, elongated vegetative, and consolidated cells in solutions ranging from 0.009 to 0.83 Pa · s (Fig. 4A).
Fig 4.
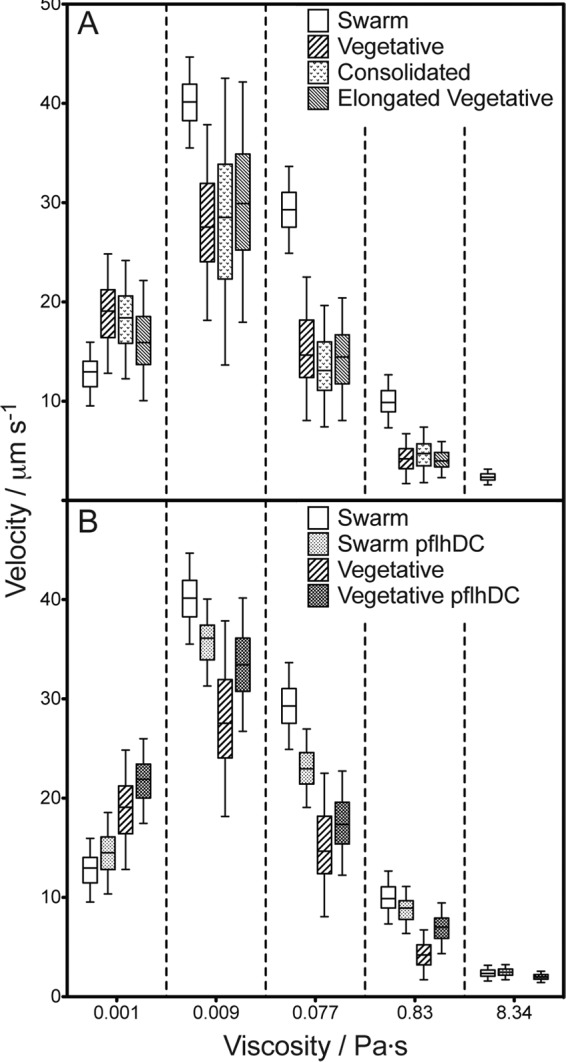
(A) Plot depicting the swimming velocities of various wild-type P. mirabilis HI4320 cell morphologies in motility buffer adjusted with various concentrations of PVP to modify the viscosity. The lone data point at 8.34 Pa · s represents swarm cells; the other cell morphologies were not motile at this viscosity. Swarm cells were significantly faster (P < 0.0001) than all of the other morphologies in solutions ranging from 0.009 to 0.83 Pa · s. (B) Plot depicting the swimming velocities of P. mirabilis HI4320 swarm and vegetative cells with and without the plasmid pflhDC. The data points at 8.34 Pa · s are arranged left to right in the same order as those for the other viscosities. A data point is not included for wild-type vegetative cells at 8.34 Pa · s, since the cells were not motile at this viscosity. The velocities of all cell types were significantly different (P < 0.001) from that of each of the other cell types at viscosities of <8.34 Pa · s. For both panels, data are displayed as box-and-whisker plots, with a box representing the range from the 25th to the 75th velocity percentile and a horizontal line within the box representing the median. The bars denote 1.5 times the interquartile distance. Each data point represents measurements of 100 individual cells.
In solutions with a viscosity of <8.3 Pa · s, an increase in FlhD4C2 increased the velocity of vegetative cells by 15 to 61% relative to that of the wild type. As a control, we examined cells transformed with the empty vector pACYC184 and found that their velocity was not statistically different from that of wild-type cells (P = 0.24) in fluids with a viscosity of 0.009 Pa · s. Importantly, overexpression of FlhD4C2 rescued vegetative cell motility at 8.3 Pa · s (Fig. 4B). Swarm cells containing pflhDC were either the same as or slower than wild-type P. mirabilis swarm cells (Fig. 4B). As with wild-type P. mirabilis cells, swarm cells containing pflhDC were motile in fluids with a viscosity of 8.3 Pa · s. In conjunction with quantitative Western and immunofluorescence data, the motility studies demonstrate that increasing flagellum density on vegetative cells increases their velocity.
In addition to affecting the velocity of the motile cells in a population of vegetative cells, we observed that overexpression of FlhD4C2 affected the percentage of motile cells in the population. To quantify this effect, we analyzed the number of motile cells present in the first frame of the cell velocity videos. We discovered that FlhDC overexpression dramatically increased the percentage of motile vegetative cells in all of the PVP solutions we tested. Motile vegetative cells increased by between 43 and 321% when P. mirabilis cells contained pflhDC (Fig. 5), making the percentage of motile vegetative cells approximately equivalent to the percentage of motile swarm cells in all viscosities that we tested. Our imaging experiments support these results, since we observed that a large number of wild-type vegetative cells lacked flagella. Transformation of vegetative cells with pflhDC produced a population in which the majority of cells had flagella. Consistent with our observation that overexpression of FlhDC has no effect on swarm cell flagellum density (Fig. 2), we observed that it has a minimal effect on the percentage of motile swarm cells at higher viscosities (≥0.83 Pa · s) and no effect at lower viscosities (0.001 to 0.077 Pa · s). These data suggest that an increase in intracellular levels of FlhD4C2 produces a population of vegetative cells that is optimized for motility.
Fig 5.
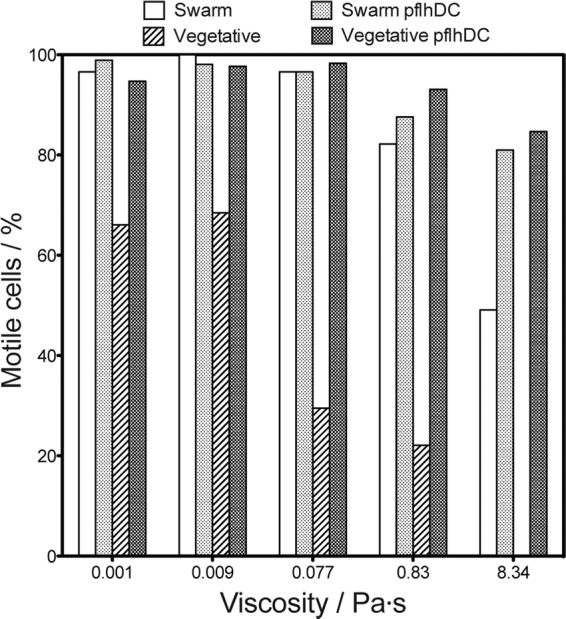
Plot depicting the percentages of motile cells for swarm and vegetative cells with and without pflhDC in a range of viscous solutions. This graph demonstrates that the overexpression of flhDC increases the percentages of motile cells, independent of viscosity, for the vegetative morphology. Overexpression of flhDC also increases the percentage of motile swarm cells in higher-viscosity solutions.
DISCUSSION
P. mirabilis cells inoculated on agar become morphologically differentiated from vegetative cells. Genes required for swarming motility and differentiation of P. mirabilis have been studied over the last 2 decades (11, 33, 49, 50); however, the adaptive value of this transformation has received less attention. The synthesis, assembly, and actuation of flagella are energetically expensive and require the expression of ∼40 genes (8, 39). In E. coli, much of this energy is required for the synthesis of the flagella, which represents ∼8% of the total protein synthesized by the cell (51). The increase in the surface density of flagella on swarm cells suggests that this energetic cost is presumably greater than that for vegetative cells. Increasing the energetic burden on cells by increasing the density of flagella should be supported by an adaptive advantage. One hypothesis is that this phenotype facilitates cell motility in viscous environments.
To test this hypothesis, we compared the motility of swarm cells to that of vegetative cells. We examined the velocities of different cell morphologies, encompassing several combinations of cell length and flagellum density, in solutions with a range of viscosities (0.001 to 8.34 Pa · s). The swimming velocity data revealed two interesting observations: (i) wild-type P. mirabilis swarm cells are faster than cells with other wild-type morphologies in liquids with a viscosity above 0.001 Pa · s, and (ii) wild-type P. mirabilis swarm cells are motile at 8.34 Pa · s, which represents a viscosity that inhibits the motility of the other wild-type cell morphologies that we tested (Fig. 4A). There was no obvious correlation between cell length and motility, which suggests that cell length is not a dominant factor that influences swarm cell motility (Fig. 3). To test whether increased flagellum density increased cell velocity, we transformed cells with a plasmid (pflhDC) that constitutively expresses flhD and flhC, the genes that encode the master regulator of expression of the flagellar gene hierarchy (14, 39, 52). We found that vegetative cells harboring pflhDC express higher levels of FliC (Fig. 2A) and have more flagella (Fig. 2B). Importantly, these pflhDC vegetative cells are faster than wild-type vegetative cells in all of the viscous solutions we tested (Fig. 4B). Furthermore, these pflhDC-overexpressing vegetative cells remained motile at 8.34 Pa · s, and the percentage of motile cells in the population increased at all of the viscosities that we studied.
A range of values has been reported for the number of flagella on P. mirabilis cells in different environments (49, 53, 54). However, it is unclear whether the reported values refer to the total number of flagella or to flagellum density (i.e., the number of flagella per unit surface area). Swarm cells are often reported to have a density of flagella that is 50-fold greater than that of vegetative cells; however, this value is based on Western blot analysis of FliC expression levels and the assumed correlation between the total concentration of FliC and the number of extracellular flagella (55–58). We report the first direct measurement of flagellum density using quantitative immunofluorescence microscopy. An ideal approach to comparing flagellum density on swarm and vegetative cells would be to count individual flagella on the different cell types. We found it challenging to count flagella on P. mirabilis swarm cells and therefore developed an image-processing algorithm that quantified the total fluorescence of fluorescently labeled flagella. Our estimation of flagellum density by Western blotting and immunofluorescence microscopy highlights the challenges of drawing conclusions about flagellum surface density from measurements of total protein levels. The trends that we observed by Western blotting—swarm cells have the highest concentration of FliC, followed by consolidated cells and pflhDC-expressing vegetative cells—match our immunofluorescence data (Fig. 3A and B).
We have demonstrated that swarm P. mirabilis cells have an increased density of flagella compared to that of vegetative cells (Fig. 2A and B). The magnitudes of the fold changes we observed were different for the two techniques we used to determine flagellum density. We found a 4.8-fold increase in flagellum density on swarm cells compared to that of vegetative cells using immunofluorescence microscopy and image analysis. In contrast, quantitative Western blots demonstrated a 46-fold increase in flagellum density, which is similar to previous reports (58). This discrepancy may be partially explained by our Western blots quantifying total FliC (both intra- and extracellular), whereas our immunofluorescence experiments measured only FliC on the outer cell surface. We used an excess of anti-FliC antibody in our immunofluorescence experiments; however, it is possible that the close spatial proximity of flagella on cells with a high density of flagella prevented us from saturating the binding of antibodies to FliC. Steric constraints may reduce the binding of antibodies to FliC on cells with a high density of flagella and artificially decrease the fold change compared to vegetative cells. Furthermore, it is possible that a single antibody binds to a single flagellum when flagellum density is low but binds to two adjacent flagella when flagellum density is high, which would also decrease the observed fold change of flagella on swarm cells relative to that of vegetative cells. Additionally, we normalized the Western blots by loading an equal amount of total protein in each lane; however, ∼50% of the wild-type vegetative cells lack flagella, which reduces the amount of FliC/total protein by approximately 2-fold. This artifact thus inflates our calculation of the amount of FliC for the other cell types by approximately 2-fold.
The differences in velocity between different cell types may be explained by differences in flagellum density. In solutions with a viscosity of 0.009 Pa · s or greater, swarm cells, i.e., the cells with the highest flagellum density, were significantly faster (P < 0.0001) than all of the other wild-type cell morphologies that we examined. Vegetative cells harboring pflhDC had in increased flagellum density and displayed an increase in cell velocity at all viscosities relative to wild-type vegetative cells but did not attain the velocity of P. mirabilis swarm cells (except at 0.001 Pa · s). In addition to flagellum density, other factors may be important for cell motility. (i) The amount of torque generated by flagellar motors on swarm cells may be greater than that on vegetative cells. (ii) The formation of multiple bundles along the length of the P. mirabilis swarm cell, rather than a single bundle of flagella, may be important for motility in viscous fluids. (iii) Differences in the expression of genes that code for proteins involved in other processes besides flagella may be responsible for the velocity of swarm cells (M. F. Copeland and D. B. Weibel, unpublished microarray data) (33, 59, 60). (iv) Differences in flagellum length may also be important; however, we did not observe any obvious differences in flagellum length between the different cell types that we studied.
In a broader context, it is possible that the motility advantages displayed by P. mirabilis swarm cells in this study apply to other species of swarming bacteria. We analyzed the motility of E. coli strain MG1655 swarm and vegetative cells and observed that swarm cells were significantly faster than vegetative cells in liquids with a viscosity between 0.0024 and 0.0067 Pa · s (P < 0.0001) (see Fig. S4 in the supplemental material). Interestingly, E. coli cells were motile only in the lowest-viscosity motility buffers we used in P. mirabilis studies (i.e., 0.001 to 0.009 Pa · s). These results are not surprising, since the fluid viscosity required to inhibit cell motility varies between species and even between different isolates or phenotypes of the same species (17, 20, 61).
Looking beyond E. coli and P. mirabilis, an analysis of the literature for 14 bacterial species that are known to swarm revealed that cells increase their number of flagella during surface migration (with the exception of Yersinia enterocolitica) (see Table S4 in the supplemental material). Of particular interest are several organisms, including members of Aeromonas, Azospirillum, Pseudomonas, Rhodospirillum, and Vibrio, that transform from using a single polar flagellum during swimming to using multiple peritrichous flagella during swarming. These data highlight the importance of an increase in flagellar number rather than density; however, they do imply that an increase in flagella is required, or at least advantageous, for swarming motility. Studies of the motility of these organisms in viscous environments may provide insight into adaptive advantages of this phenotype.
Our results raise questions about the role of the morphological changes that occur during swarming. The movement of swarm cells is ∼2-fold faster than that of consolidated cells in fluids that have a viscosity (0.080 Pa · s) that approximates our measurement of the extracellular environment during swarming (0.061 Pa · s). The differential rates of swarm and consolidated cell motility at this viscosity may be important for establishing the structure and organization of cells in swarming colonies. Since flagellum density is apparently sufficient to enhance motility in viscous fluids, it is unclear why P. mirabilis cells become long. One possibility is that cell length influences and coordinates swarm cell motion (62, 63). We found that longer cells had straighter trajectories during their movement through fluids, which we presume is due to a decrease in rotational diffusion as cell length increases (see Fig. S5 in the supplemental material). Elongated bacterial cells are also more resistant to the host immune response during infection (64). Studies of the regulation of bacterial cell division may provide insight into the role and advantage of cell length during swarming. Framed upon the data in this article, studies of the role of cell length regulation will enhance our understanding of the reasons for the dramatic changes in cell morphology that occur during P. mirabilis swarming.
Supplementary Material
ACKNOWLEDGMENTS
Funding for this work was provided by the NSF (awards DMR-1121288 and MCB-1120832), the USDA (WIS01366), and the Alfred P. Sloan Foundation (fellowship to D.B.W.). H.H.T. received support from NIH National Research Service Award T32 GM07215. M.F.C. received support from a Wisconsin Alumni Research Foundation Research Assistant Award.
We thank Michael Weibel for performing rheology measurements, Dan Klingenberg and Michael Graham for discussions of bead diffusion assays, Saverio Spagnolie for discussions of fluid dynamics, Philip Rather (Emory University School of Medicine, Atlanta, GA) for the plasmid pflhDC, and Nicholas Frankel for assistance with MATLAB-based cell tracking.
Footnotes
Published ahead of print 9 November 2012
Supplemental material for this article may be found at http://dx.doi.org/10.1128/JB.01537-12.
REFERENCES
- 1. Sivick KE, Mobley HLT. 2010. Waging war against uropathogenic Escherichia coli: winning back the urinary tract. Infect. Immun. 78: 568– 585 [DOI] [PMC free article] [PubMed] [Google Scholar]
- 2. Jones BV, Young R, Mahenthiralingam E, Stickler DJ. 2004. Ultrastructure of Proteus mirabilis swarmer cell rafts and role of swarming in catheter-associated urinary tract infection. Infect. Immun. 72: 3941– 3950 [DOI] [PMC free article] [PubMed] [Google Scholar]
- 3. Stickler D, Hughes G. 1999. Ability of Proteus mirabilis to swarm over urethral catheters. Eur. J. Clin. Microbiol. Infect. Dis. 18: 206– 208 [DOI] [PubMed] [Google Scholar]
- 4. Stickler DJ, Lear JC, Morris NS, Macleod SM, Downer A, Cadd DH, Feast WJ. 2006. Observations on the adherence of Proteus mirabilis onto polymer surfaces. J. Appl. Microbiol. 100: 1028– 1033 [DOI] [PubMed] [Google Scholar]
- 5. Candela M, Consolandi C, Severgnini M, Biagi E, Castiglioni B, Vitali B, De Bellis G, Brigidi P. 2010. High taxonomic level fingerprint of the human intestinal microbiota by ligase detection reaction-universal array approach. BMC Microbiol. 10: 116. [DOI] [PMC free article] [PubMed] [Google Scholar]
- 6. Misra V, Misra SP, Singh PA, Dwivedi M, Verma K, Narayan U. 2009. Significance of cytomorphological and microbiological examination of bile collected by endoscopic cannulation of the papilla of vater. Indian J. Pathol. Microbiol. 52:328– 331 [DOI] [PubMed] [Google Scholar]
- 7. Garrett WS, Gallini CA, Yatsunenko T, Michaud M, DuBois A, Delaney ML, Punit S, Karlsson M, Bry L, Glickman JN, Gordon JI, Onderdonk AB, Glimcher LH. 2010. Enterobacteriaceae act in concert with the gut microbiota to induce spontaneous and maternally transmitted colitis. Cell Host Microbe 8: 292– 300 [DOI] [PMC free article] [PubMed] [Google Scholar]
- 8. Berg HC. 2003. The rotary motor of bacterial flagella. Annu. Rev. Biochem. 72: 19– 54 [DOI] [PubMed] [Google Scholar]
- 9. Turner L, Ryu WS, Berg HC. 2000. Real-time imaging of fluorescent flagellar filaments. J. Bacteriol. 182: 2793– 2801 [DOI] [PMC free article] [PubMed] [Google Scholar]
- 10. Rauprich O, Matsushita M, Weijer CJ, Siegert F, Esipov SE, Shapiro JA. 1996. Periodic phenomena in Proteus mirabilis swarm colony development. J. Bacteriol. 178: 6525– 6538 [DOI] [PMC free article] [PubMed] [Google Scholar]
- 11. Morgenstein RM, Szostek B, Rather PN. 2010. Regulation of gene expression during swarmer cell differentiation in Proteus mirabilis. FEMS Microbiol. Rev. 34: 753– 763 [DOI] [PubMed] [Google Scholar]
- 12. Copeland MF, Weibel DB. 2009. Bacterial swarming: a model system for studying dynamic self-assembly. Soft Matter 5: 1174– 1187 [DOI] [PMC free article] [PubMed] [Google Scholar]
- 13. Harshey RM. 2003. Bacterial motility on a surface: many ways to a common goal. Annu. Rev. Microbiol. 57: 249– 273 [DOI] [PubMed] [Google Scholar]
- 14. Patrick JE, Kearns DB. 2012. Swarming motility and the control of master regulators of flagellar biosynthesis. Mol. Microbiol. 83: 14– 23 [DOI] [PMC free article] [PubMed] [Google Scholar]
- 15. Purcell E. 1997. The efficiency of propulsion by a rotating flagellum. Proc. Natl. Acad. Sci. U. S. A. 94: 11307– 11311 [DOI] [PMC free article] [PubMed] [Google Scholar]
- 16. Macnab RM. 1996. Flagella and motility, p 123–143 In Neidhardt FC. (ed), Escherichia coli and Salmonella: cellular and molecular biology, 2nd ed, vol 1 ASM Press, Washington, DC [Google Scholar]
- 17. Greenberg EP, Canale-Parola E. 1977. Motility of flagellated bacteria in viscous environments. J. Bacteriol. 132: 356– 358 [DOI] [PMC free article] [PubMed] [Google Scholar]
- 18. Schneider WR, Doetsch RN. 1974. Effect of viscosity on bacterial motility. J. Bacteriol. 117: 696– 701 [DOI] [PMC free article] [PubMed] [Google Scholar]
- 19. Shoesmith J. 1960. The measurement of bacterial motility. Microbiology 22: 528– 535 [Google Scholar]
- 20. Atsumi T, Maekawa Y, Yamada T, Kawagishi I, Imae Y, Homma M. 1996. Effect of viscosity on swimming by the lateral and polar flagella of Vibrio alginolyticus. J. Bacteriol. 178: 5024– 5026 [DOI] [PMC free article] [PubMed] [Google Scholar]
- 21. Fujinami S, Terahara N, Lee S, Ito M. 2007. Na(+) and flagella-dependent swimming of alkaliphilic Bacillus pseudofirmus OF4: a basis for poor motility at low pH and enhancement in viscous media in an “up-motile” variant. Arch. Microbiol. 187: 239– 247 [DOI] [PubMed] [Google Scholar]
- 22. Ito M, Terahara N, Fujinami S, Krulwich T. 2005. Properties of motility in Bacillus subtilis powered by the H+-coupled MotAB flagellar stator, Na+-coupled MotPS or hybrid stators MotAS or MotPB. J. Mol. Biol. 352: 396– 408 [DOI] [PMC free article] [PubMed] [Google Scholar]
- 23. Nakamura S, Adachi Y, Goto T, Magariyama Y. 2006. Improvement in motion efficiency of the spirochete Brachyspira pilosicoli in viscous environments. Biophys. J. 90: 3019– 3026 [DOI] [PMC free article] [PubMed] [Google Scholar]
- 24. Magariyama Y, Kudo S. 2002. A mathematical explanation of an increase in bacterial swimming speed with viscosity in linear-polymer solutions. Biophys. J. 83: 733– 739 [DOI] [PMC free article] [PubMed] [Google Scholar]
- 25. Manos J, Artimovich E, Belas R. 2004. Enhanced motility of a Proteus mirabilis strain expressing hybrid FlaAB flagella. Microbiology 150: 1291– 1299 [DOI] [PubMed] [Google Scholar]
- 26. Stahl SJ, Stewart KR, Williams FD. 1983. Extracellular slime associated with Proteus mirabilis during swarming. J. Bacteriol. 154: 930– 937 [DOI] [PMC free article] [PubMed] [Google Scholar]
- 27. Gygi D, Rahman MM, Lai HC, Carlson R, Guard-Petter J, Hughes C. 1995. A cell-surface polysaccharide that facilitates rapid population migration by differentiated swarm cells of Proteus mirabilis. Mol. Microbiol. 17: 1167– 1175 [DOI] [PubMed] [Google Scholar]
- 28. Claret L, Hughes C. 2000. Rapid turnover of FlhD and FlhC, the flagellar regulon transcriptional activator proteins, during Proteus swarming. J. Bacteriol. 182: 833– 836 [DOI] [PMC free article] [PubMed] [Google Scholar]
- 29. Furness RB, Fraser GM, Hay NA, Hughes C. 1997. Negative feedback from a Proteus class II flagellum export defect to the flhDC master operon controlling cell division and flagellum assembly. J. Bacteriol. 179: 5585– 5588 [DOI] [PMC free article] [PubMed] [Google Scholar]
- 30. Mobley HL, Warren JW. 1987. Urease-positive bacteriuria and obstruction of long-term urinary catheters. J. Clin. Microbiol. 25: 2216– 2217 [DOI] [PMC free article] [PubMed] [Google Scholar]
- 31. Ibrahim GF, Fleet GH, Lyons MJ, Walker RA. 1985. Method for the isolation of highly purified Salmonella flagellins. J. Clin. Microbiol. 22: 1040– 1044 [DOI] [PMC free article] [PubMed] [Google Scholar]
- 32. Wozniak CE, Chevance FFV, Hughes KT. 2010. Multiple promoters contribute to swarming and the coordination of transcription with flagellar assembly in Salmonella. J. Bacteriol. 192: 4752– 4762 [DOI] [PMC free article] [PubMed] [Google Scholar]
- 33. Pearson MM, Rasko DA, Smith SN, Mobley HLT. 2010. Transcriptome of swarming Proteus mirabilis. Infect. Immun. 78: 2834– 2845 [DOI] [PMC free article] [PubMed] [Google Scholar]
- 34. Sykes RB, Wells JS, Parker WL, Koster WH, Cimarusti CM. 1986. Aztreonam: discovery and development of the monobactams. N. J. Med. 1986: 8– 15 [PubMed] [Google Scholar]
- 35. Fraser G, Hughes C. 1999. Swarming motility. Curr. Opin. Microbiol. 2: 630– 635 [DOI] [PubMed] [Google Scholar]
- 36. Wang S, Fleming RT, Westbrook EM, Matsumura P, McKay DB. 2006. Structure of the Escherichia coli FlhDC complex, a prokaryotic heteromeric regulator of transcription. J. Mol. Biol. 355: 798– 808 [DOI] [PubMed] [Google Scholar]
- 37. Claret L, Hughes C. 2000. Functions of the subunits in the FlhD2C2 transcriptional master regulator of bacterial flagellum biogenesis and swarming. J. Mol. Biol. 303: 467– 478 [DOI] [PubMed] [Google Scholar]
- 38. Claret L, Hughes C. 2002. Interaction of the atypical prokaryotic transcription activator FlhD2C2 with early promoters of the flagellar gene hierarchy. J. Mol. Biol. 321: 185– 199 [DOI] [PubMed] [Google Scholar]
- 39. Chevance FFV, Hughes KT. 2008. Coordinating assembly of a bacterial macromolecular machine. Nat. Rev. Microbiol. 6: 455– 465 [DOI] [PMC free article] [PubMed] [Google Scholar]
- 40. Kapatral V, Campbell JW, Minnich SA, Thomson NR, Matsumura P, Prüss BM. 2004. Gene array analysis of Yersinia enterocolitica FlhD and FlhC: Regulation of enzymes affecting synthesis and degradation of carbamoylphosphate. Microbiology 150: 2289– 2300 [DOI] [PubMed] [Google Scholar]
- 41. Prüss B, Markovic D, Matsumura P. 1997. The Escherichia coli flagellar transcriptional activator flhD regulates cell division through induction of the acid response gene cadA. J. Bacteriol. 179: 3818– 3821 [DOI] [PMC free article] [PubMed] [Google Scholar]
- 42. Prüss BM, Campbell JW, Van Dyk TK, Zhu C, Kogan Y, Matsumura P. 2003. FlhD/FlhC is a regulator of anaerobic respiration and the Entner-Doudoroff pathway through induction of the methyl-accepting chemotaxis protein Aer. J. Bacteriol. 185: 534– 543 [DOI] [PMC free article] [PubMed] [Google Scholar]
- 43. Prüss BM, Liu X, Hendrickson W, Matsumura P. 2001. FlhD/FlhC-regulated promoters analyzed by gene array and lacZ gene fusions. FEMS Microbiol. Lett. 197: 91– 97 [DOI] [PubMed] [Google Scholar]
- 44. Sule P, Horne SM, Logue CM, Pruss BM. 2011. Regulation of cell division, biofilm formation, and virulence by FlhC in Escherichia coli O157:H7 grown on meat. Appl. Environ. Microbiol. 77: 3653– 3662 [DOI] [PMC free article] [PubMed] [Google Scholar]
- 45. Townsend MK, Carr NJ, Iyer JG, Horne SM, Gibbs PS, Prüss BM. 2008. Pleiotropic phenotypes of a Yersinia enterocolitica flhD mutant include reduced lethality in a chicken embryo model. BMC Microbiol. 8: 12 doi:10.1186/1471-2180-8-12 [DOI] [PMC free article] [PubMed] [Google Scholar]
- 46. Zhang R, Turner L, Berg HC. 2010. The upper surface of an Escherichia coli swarm is stationary. Proc. Natl. Acad. Sci. U. S. A. 107:288– 290 [DOI] [PMC free article] [PubMed] [Google Scholar]
- 47. Greenberg EP, Canale-Parola E. 1977. Relationship between cell coiling and motility of spirochetes in viscous environments. J. Bacteriol. 131: 960– 969 [DOI] [PMC free article] [PubMed] [Google Scholar]
- 48. Belas R, Suvanasuthi R. 2005. The ability of Proteus mirabilis to sense surfaces and regulate virulence gene expression involves FliL, a flagellar basal body protein. J. Bacteriol. 187: 6789– 6803 [DOI] [PMC free article] [PubMed] [Google Scholar]
- 49. Belas R, Erskine D, Flaherty D. 1991. Proteus mirabilis mutants defective in swarmer cell differentiation and multicellular behavior. J. Bacteriol. 173: 6279– 6288 [DOI] [PMC free article] [PubMed] [Google Scholar]
- 50. Rather P. 2005. Swarmer cell differentiation in Proteus mirabilis. Environ. Microbiol. 7: 1065– 1073 [DOI] [PubMed] [Google Scholar]
- 51. Zhao K, Liu M, Burgess RR. 2007. Adaptation in bacterial flagellar and motility systems: from regulon members to ‘foraging’-like behavior in E. coli. Nucleic Acids Res. 35: 4441– 4452 [DOI] [PMC free article] [PubMed] [Google Scholar]
- 52. Chilcott GS, Hughes KT. 2000. Coupling of flagellar gene expression to flagellar assembly in Salmonella enterica serovar Typhimurium and Escherichia coli. Microbiol. Mol. Biol. Rev. 64: 694– 708 [DOI] [PMC free article] [PubMed] [Google Scholar]
- 53. Allison C, Hughes C. 1991. Bacterial swarming: an example of prokaryotic differentiation and multicellular behaviour. Sci. Prog. 75: 403– 422 [PubMed] [Google Scholar]
- 54. Williams FD, Schwarzhoff RH. 1978. Nature of the swarming phenomenon in Proteus. Annu. Rev. Microbiol. 32: 101– 122 [DOI] [PubMed] [Google Scholar]
- 55. Allison C, Hughes C. 1991. Closely linked genetic loci required for swarm cell differentiation and multicellular migration by Proteus mirabilis. Mol. Microbiol. 5: 1975– 1982 [DOI] [PubMed] [Google Scholar]
- 56. Allison C, Lai H, Hughes C. 1992. Co-ordinate expression of virulence genes during swarm-cell differentiation and population migration of Proteus mirabilis. Mol. Microbiol. 6: 1583– 1591 [DOI] [PubMed] [Google Scholar]
- 57. Gygi D, Bailey MJ, Allison C, Hughes C. 1995. Requirement for FlhA in flagella assembly and swarm-cell differentiation by Proteus mirabilis. Mol. Microbiol. 15: 761– 769 [DOI] [PubMed] [Google Scholar]
- 58. Hay NA, Tipper DJ, Gygi D, Hughes C. 1997. A nonswarming mutant of Proteus mirabilis lacks the Lrp global transcriptional regulator. J. Bacteriol. 179: 4741– 4746 [DOI] [PMC free article] [PubMed] [Google Scholar]
- 59. Inoue T, Shingaki R, Hirose S, Waki K, Mori H, Fukui K. 2007. Genome-wide screening of genes required for swarming motility in Escherichia coli K-12. J. Bacteriol. 189: 950– 957 [DOI] [PMC free article] [PubMed] [Google Scholar]
- 60. Wang Q, Frye JG, McClelland M, Harshey RM. 2004. Gene expression patterns during swarming in Salmonella typhimurium: genes specific to surface growth and putative new motility and pathogenicity genes. Mol. Microbiol. 52: 169– 187 [DOI] [PubMed] [Google Scholar]
- 61. Strength WJ, Isani B, Linn DM, Williams FD, Vandermolen GE, Laughon BE, Krieg NR. 1976. Isolation and characterization of Aquaspirillum fasciculus sp. nov., a rod-shaped, nitrogen-fixing bacterium having unusual flagella. Int. J. Syst. Bacteriol. 26: 253– 268 [Google Scholar]
- 62. Copeland MF, Flickinger ST, Tuson HH, Weibel DB. 2010. Studying the dynamics of flagella in multicellular communities of Escherichia coli by using biarsenical dyes. Appl. Environ. Microbiol. 76: 1241– 1250 [DOI] [PMC free article] [PubMed] [Google Scholar]
- 63. Turner L, Zhang R, Darnton NC, Berg HC. 2010. Visualization of flagella during bacterial swarming. J. Bacteriol. 192: 3259– 3267 [DOI] [PMC free article] [PubMed] [Google Scholar]
- 64. Justice SS, Hunstad DA, Seed PC, Hultgren SJ. 2006. Filamentation by Escherichia coli subverts innate defenses during urinary tract infection. Proc. Natl. Acad. Sci. U. S. A. 103: 19884– 19889 [DOI] [PMC free article] [PubMed] [Google Scholar]
Associated Data
This section collects any data citations, data availability statements, or supplementary materials included in this article.