

Abstract
Fast synaptic transmission requires tight colocalization of Ca2+ channels and neurotransmitter vesicles. It is generally thought that Ca2+ channels are expressed abundantly in presynaptic active zones, that vesicles within the same active zone have similar release properties, and that significant vesicle depletion only occurs at synapses with high release probability. Here we show, at excitatory CA3→CA1 synapses in mouse hippocampus, that release from individual vesicles is generally triggered by only one Ca2+ channel and that only few functional Ca2+ channels may be spread in the active zone at variable distances to neighboring neurotransmitter vesicles. Using morphologically realistic Monte Carlo simulations, we show that this arrangement leads to a widely heterogeneous distribution of release probability across the vesicles docked at the active zone, and that depletion of the vesicles closest to Ca2+ channels can account for the Ca2+ dependence of short-term plasticity at these synapses. These findings challenge the prevailing view that efficient synaptic transmission requires numerous presynaptic Ca2+ channels in the active zone, and indicate that the relative arrangement of Ca2+ channels and vesicles contributes to the heterogeneity of release probability within and across synapses and to vesicle depletion at small central synapses with low average release probability.
Introduction
The number and relative location of Ca2+ channels (CaVs) and neurotransmitter vesicles within the presynaptic active zone are critical determinants of synaptic function, yet are unknown at most synapses. At the frog neuromuscular junction and the rodent calyx of Held, vesicles and CaVs in the active zone are thought to be abundant (Heuser et al., 1974; Borst and Sakmann, 1996), although probably not as much as initially hypothesized (Shahrezaei et al., 2006; Luo et al., 2011). It has been suggested that, in the developing calyx of Held, neurotransmitter vesicles reside at 30–300 nm from neighboring CaV clusters (Meinrenken et al., 2002), and that the coupling distance between vesicles and CaVs becomes shorter as the animal matures (Fedchyshyn and Wang, 2005). Small central synapses, on average, have fewer vesicles docked at the active zone (Schikorski and Stevens, 1997), but even here CaVs are thought to be numerous, to ensure efficient synaptic transmission. The short latency between Ca2+ entry and neurotransmitter release (Sabatini and Regehr, 1996) has been interpreted to indicate that CaVs must be very close to synaptic vesicles and recent work identifies specific molecules that link the two together (Kaeser et al., 2011). It remains unclear, however, whether every vesicle in the readily releasable pool (RRP) is stereotypically coupled to one or more CaVs. If every vesicle in the active zone expressed similar Ca2+-sensitive molecules and was tethered to one or more CaVs, each would likely exhibit a similar vesicle release probability (Pv) and the release probability of the whole synapse would be very high (i.e., 1 − Πi=1RRPsize(1 − Pvi)). If only a subset of the vesicles in the active zone were tethered to CaVs, each of these vesicles would exhibit similar Pv, but the release probability of the whole synapse would be lower due to the smaller size of the RRP. If, on the other hand, only a few CaVs were distributed randomly within the active zone, the release probability of the whole synapse would be low but Pv would vary widely across vesicles. In the latter case, the vesicles closest to CaVs would mediate a disproportionately large fraction of release and undergo significant depletion, influencing the ability of the synapse to respond to repetitive stimulations. Here we combine electrophysiological and imaging experiments with theoretical models to distinguish between these different scenarios and estimate the number of functional CaVs triggering release at Schaffer collateral synapses, and gain insight into how the local arrangement of functional CaVs and neurotransmitter vesicles affects release and short-term plasticity at small, central excitatory synapses.
Materials and Methods
Electrophysiology and data analysis.
Wild-type C57BL/6 mice of either sex from postnatal days 14 to 21 (P14–P21) were deeply anesthetized with isoflurane and decapitated, in accordance with the National Institute of Neurological Disorders and Stroke Animal Care and Use Committee guidelines. Transverse hippocampal slices (250 μm thick) were prepared using a vibrating blade microtome (VT1000S; Leica). The slicing solution (4°C, continuously bubbled with a mixture of 95% O2-5% CO2) contained the following (in mm): 119 NaCl, 2.5 KCl, 0.5 CaCl2, 1.3 MgSO4·7H2O, 4 MgCl2, 26.2 NaHCO3, 1 NaH2PO4, and 22 glucose, 320 mOsm, pH 7.4. After cutting, slices were kept in this solution in a submersion chamber at 34°C for 30 min and at room temperature for up to 5 h. Unless otherwise stated, the recording solution contained the following (in mm): 119 NaCl, 2.5 KCl, 1.5 CaCl2, 1.3 MgSO4·7H2O, 1 MgCl2, 26.2 NaHCO3, 1 NaHPO4, and 22 glucose, 300 mOsm, pH 7.4, saturated with 95% O2-5% CO2. In the experiments where the extracellular Ca2+ concentration ([Ca2+]o) was changed, the extracellular magnesium concentration ([Mg2+]o) was adjusted to maintain a constant total divalent concentration of 3.8 mm. All recordings were performed at 34−36°C. The following drugs were routinely added to the recording solution to block GABAA, GABAB, GluN, mGluRII, mGluRIII, and A1 adenosine receptors (in μm): 100 picrotoxin, 5 3-[[(3,4-dichlorophenyl)methyl] amino] propyl] diethoxymethyl)phosphinic acid (CGP 52432), 10 (RS)-3-(2-carboxypiperazin-4-yl)-propyl-1-phosphonic acid (CPP), 1 2-[(1S,2S)-2-carboxycyclopropyl]-3-(9H-xanthen-9-yl)-d-alanine (LY341495), 100 (R,S)-α-methylserine-O-phosphate (MSOP), and 1 8-cyclopentyl-1,3-dipropylxanthine (DPCPX). To evoke field EPSCs (fEPSCs; see Fig. 1F,G) and EPSCs mediated by AMPA-type glutamate receptors (GluA-EPSCs; Figs. 1–5), we delivered constant voltage electrical stimuli (50 μs) through bipolar stainless steel electrodes (115 μm pole spacing; Frederick Haer Company) positioned in stratum radiatum. For field recordings, the stimulating electrode was placed ∼200 μm away from the recording electrode and the stimulus intensity was set to ∼30% of that required to elicit a population spike in [Ca2+]o = 1.5 mm; for patch recordings, the stimulating electrode was placed ∼100 μm away from the recorded CA1 pyramidal cell. Extracellular stimuli were delivered every 5 s. Glass electrodes for field and patch recordings (#0010 glass; World Precision Instruments) had tip resistances of 1 and 2.5 MΩ, respectively. fEPSCs were recorded with glass pipettes filled with artificial CSF(ACSF) and positioned in stratum radiatum. The field and patch-clamp recordings were obtained using the same voltage-clamp amplifier (Axopatch 1D, Molecular Devices). The field responses were recorded under voltage-clamp configuration (without applying any voltage command). In this configuration, we could monitor the electrode resistance with a voltage step (−0.5 mV) before each stimulus trial. The changes in fEPSC amplitude observed when varying extracellular Ca2+ were not biased by changes in the resistance of the recording electrode. The amplitude and time course of fEPSCs, scaled to millivolts according to the amplitude of the current response to the test voltage step, matched the amplitude and time course of fEPSPs recorded in the current-clamp configuration (I = 0), as previously shown by (Diamond et al., 1998; Scimemi et al., 2009). The average electrode resistance for the field recordings was ∼1.5 MΩ so a scaling factor of 1.5 μV/pA allows a rough calculation of fEPSP amplitude. Pyramidal cells in hippocampal area CA1 were identified under infrared-differential interference contrast using an upright fixed-stage microscope (Axioskop 2FS; Zeiss). Whole-cell, voltage-clamp recordings from pyramidal cells were made with patch pipettes containing the following (in mm): 120 CsCH3SO3, 10 EGTA, 20 HEPES, 2 MgATP, 0.2 NaGTP, 5 QX-314Br, and 5 NaCl, 290 mOsm, pH 7.2. To record Ca2+ currents from CA3 pyramidal cells (see Fig. 4A,B,D), the following drugs were added to the extracellular solution (in μm): 1 octahydro-12-(hydroxymethyl)-2-imino-5,9:7,10a-dimethano-10aH-[1,3]dioxocino[6,5-d]pyrimidine-4,7,10,11,12-pentol citrate, 100 4-aminopyridine, and 10 nimodipine. In these experiments, the internal solution contained the following (in mm): 120 CsCH3SO3, 0.2 EGTA, 20 HEPES, 2 MgATP, 0.2 NaGTP, 5 QX-314Br, 5 NaCl, 10 N,N,N,N-tetraethylammonium chloride, and 5 4-aminopyridine, 290 mOsm, pH 7.2. Chemicals were purchased from Sigma-Aldrich and Tocris Bioscience. Toxins were purchased from Tocris Bioscience, Peptides International, and Ascent Scientific. No difference among different batches of drugs and distributors were observed, so data were pooled.
Figure 1.
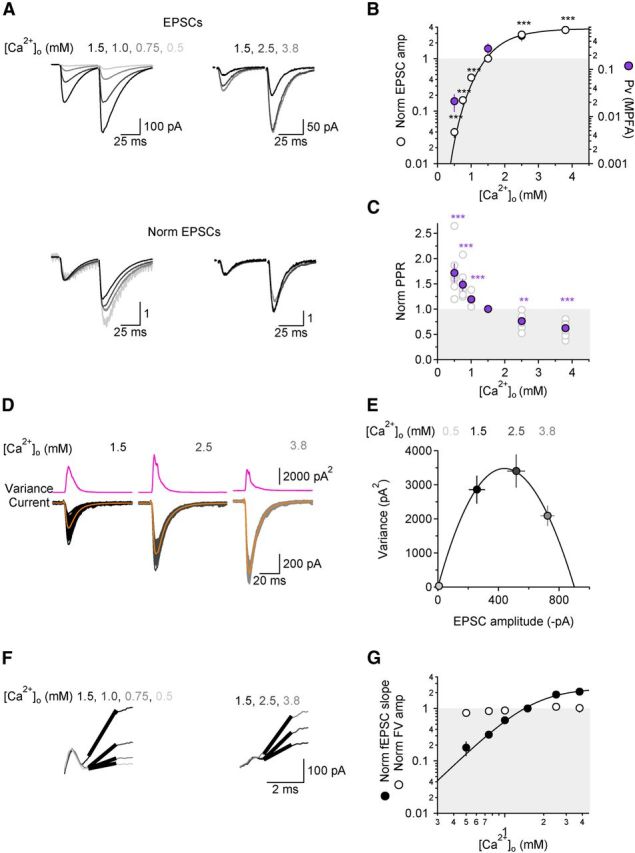
Ca2+ dependence of neurotransmitter release from Schaffer collateral synapses. A, Top, Examples of GluA-EPSCs recorded in different [Ca2+]o and evoked by two consecutive stimuli, 50 ms apart. Bottom, GluA-EPSCs normalized by the peak amplitude of the first response. B, The relationship between GluA-EPSC amplitude (open symbols) and [Ca2+]o is fitted with a Hill equation with EC50 = 1.91 ± 0.10 mm and N = 3.72 ± 0.44. The right axis shows the range of Pv measured at different [Ca2+]o. The filled purple symbols represent the value of Pv estimated with MPFA at 0.5, 1.5, 2.5, and 3.8 mm [Ca2+]o (n = 9). C, Ca2+ dependence of PPR, normalized by the value of PPR in [Ca2+]o = 1.5 mm. D, Example of GluA-EPSCs recorded in three different [Ca2+]o (1.5, 2.5, and 3.8 mm) for MPFA. One hundred GluA-EPSCs are superimposed for each condition. Averaged GluA-EPSCs (orange downward traces) are superimposed to the raw traces. The top traces (pink upward traces) represent the variance of the GluA-EPSCs recorded at each [Ca2+]o. E, Variance-mean plot of GluA-EPSC amplitude. The parabola represents the fit of the experimental data for one representative cell. F, Varying [Ca2+]o alters the slope of fEPSCs but not the amplitude of the FV. The traces represent an expanded view of FVs and fEPSCs monitored when decreasing or increasing [Ca2+]o stepwise from 1.5 to 0.5 mm (n = 6; left) and from 1.5 to 3.8 mm (n = 8; right), respectively. An fEPSC amplitude of 100 pA corresponds to an fEPSP amplitude of ∼150 μV. The thick black lines represent line fits of the fEPSC slope. G, Summary graph of the Ca2+ dependence of the fEPSC slope (filled black circles) and Ca2+-independence of the FV amplitude (open circles). Varying [Ca2+]o does not change the threshold for Schaffer collateral activation.
Figure 2.

Only fast-dissociating CaV antagonists increase PPR. A, Examples of GluA-EPSCs recorded in control conditions (black) and after application of Mn2+ (light green; top) or Cd2+ (light blue; bottom). Each trace is the average of 20 consecutive traces. Right, Shows peak-normalized traces. B, Summary plot of the effect of Mn2+ and Cd2+ on GluA-EPSC amplitude and PPR. Only Mn2+ (n = 19; light green symbol), not Cd2+ (n = 34; light blue symbol), increases PPR. The effect of Mn2+ is similar to that observed when reducing [Ca2+]o from 1.5 to 0.75 mm (n = 7; filled purple symbol).
Figure 3.
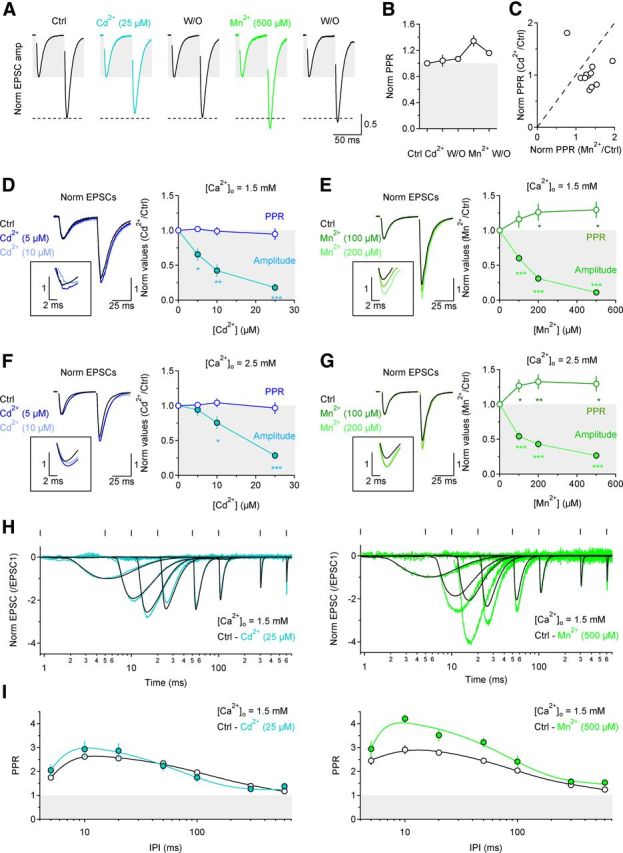
The different effect of Cd2+ and Mn2+ on GluA-EPSC PPR persists under various experimental conditions. A, Traces showing within-cell comparison of Cd2+ and Mn2+ effects on PPR. Each trace is the average of 20 consecutive traces. B, Summary plot of the effect of Cd2+ and Mn2+ on PPR, for the experiments described in A (n = 11). C, Scatter plot for the effects of Cd2+ and Mn2+ on GluA-EPSC PPR. In 10/11 cells only Mn2+ increases PPR. D, Increasing concentrations of Cd2+ (5–25 μm) progressively reduce the GluA-EPSC amplitude but not PPR (n = 8). E, Increasing concentrations of Mn2+ (100–500 μm) progressively reduce GluA-EPSC amplitude and increase PPR (n = 13). F, Cd2+ does not change PPR even when [Ca2+]o is raised from 1.5 to 2.5 mm (n = 10). G, Mn2+ increases PPR even at [Ca2+]o = 2.5 mm (n = 14). Each trace represents the average of 20 consecutive trials. The insets in D--G show the peak of the second GluA-EPSC on an expanded scale. H, Examples of GluA-EPSCs evoked at different interpulse intervals, in control conditions (black), Cd2+ (light blue, left) or Mn2+ (light green, right). Each trace represents normalized GluA-EPSCs after subtraction of single GluA-EPSCs (each trace is the average of 10 consecutive trials). I, Summary graphs of the GluA-EPSC PPR in control and in Cd2+ (left; n = 15) or Mn2+ (right; n = 10). Data in H and I are plotted on a semilogarithmic scale to show the profile of GluA-EPSCs evoked over a large range of interpulse intervals.
Figure 4.
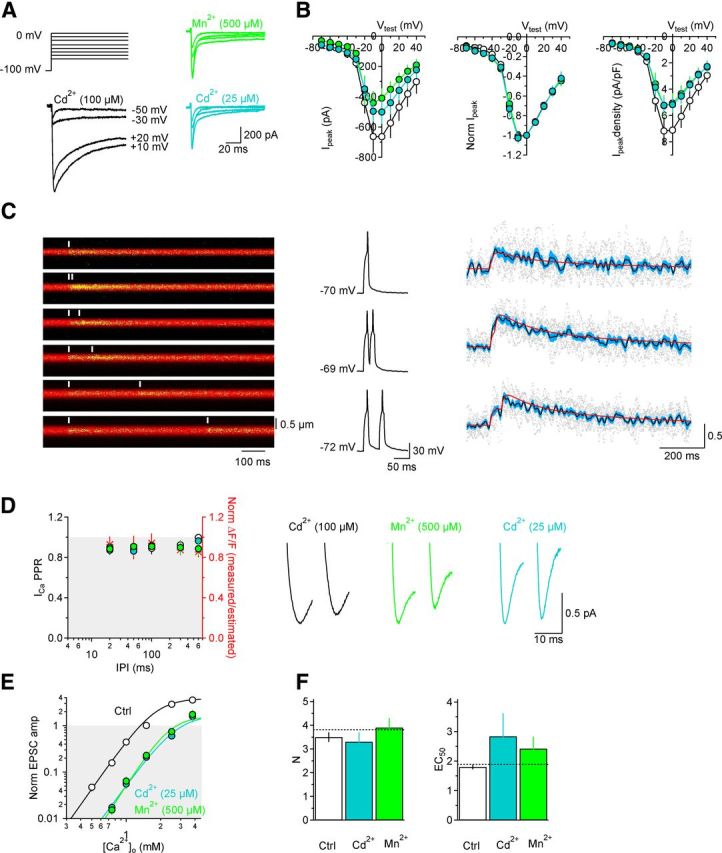
Cd2+ and Mn2+ block a similar proportion of the Ca2+ current and do not induce short-term changes in presynaptic Ca2+ currents and do not alter the Ca2+ dependence of release. A, Top left, Example of the voltage protocol applied to CA3 pyramidal cells to record Ca2+ currents sensitive to high Cd2+ (100 μm; bottom left, black traces), low Cd2+ (25 μm; bottom right, light blue traces), and Mn2+ (500 μm; top right, light green traces). B, Left and middle, The Cd2+- and Mn2+-sensitive currents have the same I/V profile (Cd2+ 100 μm[scap], n = 9; Cd2+ 25 μm[scap], n = 10; Mn2+ 500 μm[scap], n = 12). The middle shows the I/V curves normalized by the current values measured with voltage steps to 0 mV. Right: I/V profile of the peak current density in all the experimental conditions described in A. The current density measures are obtained by dividing each I-profile analyzed for B, right, by the corresponding cell capacitance value (100 ± 18 pF in Cd2+ (100 μm), n = 9; 97 ± 10 pF in Cd2+ (25 μm), n = 10; 85 ± 14 pF in Mn2+ (500 μm), n = 12). This calculation allowed us to avoid potential bias in monitoring the effect of Cd2+/Mn2+ on Ca2+ currents due to the presence of larger Ca2+ currents in larger cells. Cd2+ (25 μm; light blue filled symbols) and Mn2+ (500 μm; light green filled symbols) block the same proportion of the Cd2+ (100 μm)-sensitive Ca2+ current (open symbols). C, Left, Example line scans from presynaptic boutons in CA3 pyramidal cells recorded when triggering two consecutive individual action potentials at different interpulse intervals (IPIs; 0–600 ms). Middle and right, Example of action potentials and corresponding ΔF/F measurements in single boutons. The gray dots represent 10 consecutive trials. The average measured ΔF/F is shown in black and the corresponding error (SEM) is shown in light blue. The red line in the top on the right represents the fit of the average ΔF/F (black), evoked by one action potential, with the equation . The other red lines on the right represent the estimated ΔF/F obtained by summing two of the “one action potential fits” at different IPIs. The ratio between the estimated and measured ΔF/F (i.e., paired-pulse depression of presynaptic Ca2+ influx) is plotted in D. D, PPR of presynaptic Ca2+ signals (n = 5) and Ca2+ currents evoked at different IPIs. The effect on the Ca2+ currents sensitive to Cd2+ (100 μm; n = 8), Cd2+ (25 μm; n = 8), and Mn2+ (500 μm; n = 8) are represented as open, filled, light blue, and green symbols, respectively. The red asterisks represent the ratio between the measured (peak of the ΔF/F) and estimated (peak of the red curve) presynaptic Ca2+ influx obtained in the two-photon imaging experiments (C). Example traces of Ca2+ currents from CA3 pyramidal cells are shown on the right. E, Effect of Cd2+ and Mn2+ on the Ca2+ dependence of the GluA-EPSC amplitude. F, Summary plot: Cd2+ and Mn2+ do not change the slope of the Hill fits of the GluA-EPSC amplitude (N; left), but increase the EC50 of the fits (right). Ctrl (n = 7–11), Cd2+ (n = 7–10), and Mn2+ (n = 7–9).
Figure 5.
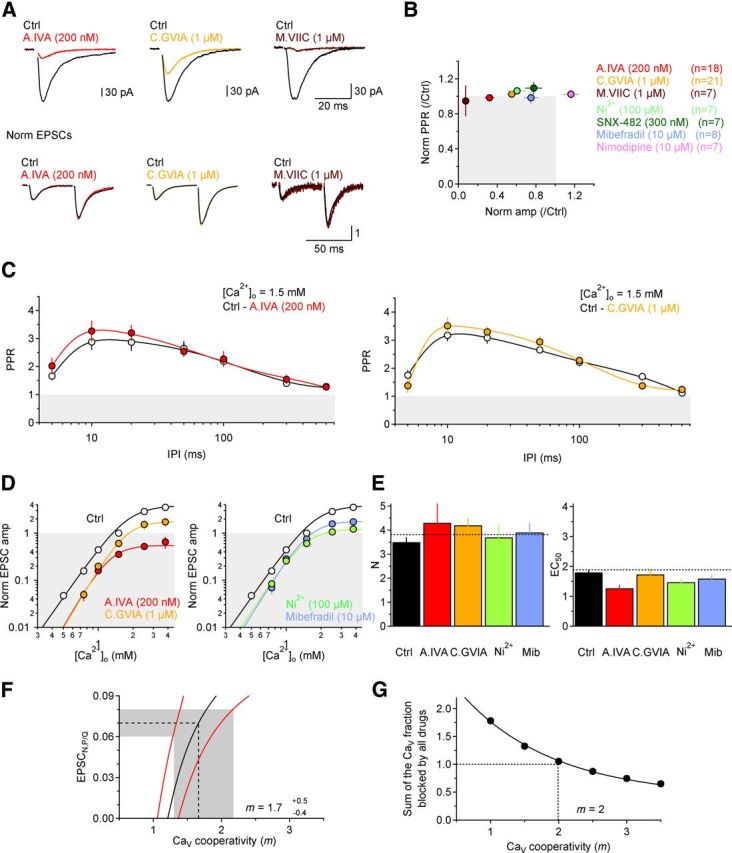
Pharmacological sensitivity of GluA-EPSC amplitude and PPR and initial estimates of CaV cooperativity (m). A, Pharmacological sensitivity of GluA-EPSC amplitude and PPR to antagonists of P/Q-type (red; ω-agatoxin IVA), N-type (orange; ω-conotoxin GVIA), or both P/Q- and N-type CaVs (brown; ω-conotoxin MVIIC). Top, Shows single GluA-EPSCs. Bottom, Pairs of GluA-EPSCs evoked with 50 ms interpulse interval and normalized by the peak amplitude of the first GluA-EPSC. Each trace represents the average of 20 consecutive trials. B, Summary plot of the effect of different CaV antagonists on GluA-EPSC amplitude and PPR. No drug increases PPR. C, PPR measure over a wide range of interpulse intervals (5–600 ms) does not change when blocking P/Q (left; n = 11) or N-type CaVs (right; n = 10). D, Effect of different CaV antagonist on the Ca2+ dependence of the GluA-EPSC amplitude. E, Summary plot: the antagonists do not significantly alter the Hill fits of the GluA-EPSC amplitude (N; left) or the EC50 (right) A.IVA (n = 6–7), C.GVIA (n = 5), Ni2+ (n = 5–12), and mibefradil (n = 5–7). F, Estimate of m based on a comparison of the effect of ω-agatoxin IVA, ω-conotoxin GVIA, and ω-conotoxin MVIIC on the GluA-EPSC amplitude (see Results). The mean estimated value of m is 1.7−0.4+0.5. G, Estimate of m obtained by comparing the fractional CaV block by a broader group of CaV antagonists.
All recordings were acquired with an Axopatch 1D voltage-clamp amplifier using a 5 kHz lowpass filter (Molecular Devices), digitized at 10 kHz and analyzed off-line with software written in IgorPro 6.21 (A.S.; Wavemetrics). The series resistance was monitored using a −0.5 or −3 mV step command (for fEPSC or GluA-EPSC recordings, respectively) and data were discarded if the series resistance changed >20%. To record GluA-EPSCs, CA1 pyramidal cells were voltage-clamped at VH = −70 mV. The paired-pulse ratio (PPR) of GluA-EPSCs was calculated by subtracting single from paired GluA-EPSCs averaged across 20 traces, after first peak normalization. Data averages are presented as mean ± SEM, unless indicated otherwise. Statistical significance was determined by Student's paired or unpaired t test, or two-way ANOVA for repeated measures, as appropriate (GraphPad). Differences were considered significant at p < 0.05 (*p < 0.05; **p < 0.01; ***p < 0.001).
The relation between GluA-EPSC amplitude in Figure 1B and [Ca2+]o was fit according to (Reid et al., 1998), using the Hill equation:
 |
where EPSC = GluA-EPSC amplitude normalized by that obtained in [Ca2+]o = 1.5 mm; S = scaling factor (3.82 ± 0.21); EC50 = [Ca2+]o giving half of the maximal synaptic response (1.91 ± 0.10 mm); and N = Hill coefficient, an empirical value related to the Ca2+ ion cooperativity underlying the dose–response relationship (3.72 ± 0.44). To avoid any potential bias in the estimate of N due to saturation of Ca2+ influx at high [Ca2+]o, we also estimated N by fitting the data at low [Ca2+]o (i.e., 0.5–1.5 mm) with the power function:
In this case N = 3.46 ± 0.29, very similar to the value of N estimated with the Hill fits. This suggests that our estimates of N were not biased by potential saturation of presynaptic Ca2+ influx at high [Ca2+]o.
Multiple probability fluctuation analysis (MPFA) was performed according to (Saviane and Silver, 2007). We evoked GluA-EPSCs in CA1 pyramidal cells by extracellular stimulation of Schaffer collaterals with a bipolar electrode placed in stratum radiatum, as described above. GluA-EPSCs were recorded in the presence of γ-d-glutamylglycine (1 mm), to prevent any bias in the estimate of Pv due to postsynaptic receptor saturation when one or more vesicles are being released (Saviane and Silver, 2007; Scimemi et al., 2009). GluA-EPSCs were evoked every 3 s, in the presence of four different [Ca2+]o (0.5, 1.5, 2.5, and 3.8 mm). We used fEPSCs to verify that the stimulation threshold did not change at different [Ca2+]o (Fig. 1F,G). Accordingly, the fEPSC slope (reflecting the amplitude of postsynaptic responses) increased progressively with [Ca2+]o, whereas the amplitude of the fiber volley (FV; reflecting the number of activated Schaffer collaterals) did not (Fig. 1F,G). A series of 100 GluA-EPSCs was analyzed in each [Ca2+]o. Each trace was baseline subtracted using a 1 ms time window before the stimulus artifact, 10 ms before the peak of the average GluA-EPSC. The synaptic response amplitude and the background noise were measured in two 1 ms time windows centered around the peak of the average GluA-EPSC and 20 ms before that, respectively (the baseline window was therefore equidistant from the two measurement windows). In each trial, the GluA-EPSC and background noise amplitude were calculated from the mean of the points within the two measurement windows. For each cell, we plotted the variance (σ2) versus the mean GluA-EPSC amplitude (I) at different [Ca2+]o. The resulting data, each weighted by the reciprocal of their variance, were fitted with the parabola as follows:
 |
where QP is the mean quantal size at the time of the peak of the mean synaptic response, CVQI and CVQII represent the intrasite and intersite variability of the synaptic response, NRS is the number of functional release sites, and a is a factor that corrects for nonuniform distribution of Pv across different sites (Saviane and Silver, 2007). We measured the total quantal variability from stimulus-aligned successful GluA-EPSCs in [Ca2+]o = 0.5 mm, when the probability of multiquantal events is negligible. Successful GluA-EPSCs were detected using a threshold criterion, when the amplitude of each event in a 1 ms time window centered around the peak was at least three times the SD of the noise. Under these conditions, the failure rate was 76 ± 22% and at least 17 successes were analyzed in each recording. Since our stimulation protocol does not allow activating individual release sites, we set CVQI = CVQII and estimated the value of CVQI, CVQII from CVQT (CVQT = 0.74 ± 0.05; CVQI = CVQII = 0.52 ± 0.04, (n = 9)). This approximation is likely to introduce little error in the estimate of NRS, QP, and Pv from MPFA (Clements, 2003; Silver, 2003; Saviane and Silver, 2007). The values of NRS and QP derived from the MPFA were NRS = 76 ± 22 and QP = 8 ± 1 pA (n = 9). A close comparison with other estimates of NRS obtained by other groups is complicated by technical differences in the experimental design (e.g., electrical characteristics of the stimulating electrode, age and species of the animals used for the experiments, etc.). Our estimates of QP are in perfect agreement with those previously reported at hippocampal excitatory synapses (Hsia et al., 1998; Stricker et al., 1999; O'Connor et al., 2007).
The error on the sum of the effect of ω-agatoxin IVA and ω-conotoxin GVIA (1.13 ± 0.05; see Results, The number of CaVs triggering release from individual neurotransmitter vesicles) was calculated as the quadratic sum of the errors as follows:
The time course of PPR (see Figs. 3I, 5C) was fit with the following equation:
 |
where A2 = 1.14; tfast = 100 ms; tslow = 2 s; and A1, trise, and n represent the following Ca2+-dependent terms:
 |
These parameters were derived by monitoring PPR at 5–600 ms interpulse intervals at different [Ca2+]o (data not shown). There was no mechanistic basis for the choice of this fitting function, although it provided an accurate fit of the experimental data.
Two-photon imaging.
Imaging experiments were performed using a two-photon laser scanning microscope (Prairie-Technologies) and a Ti:sapphire laser (Chameleon; Coherent) tuned to λ = 810 nm and a 40× 0.8 NA objective (Olympus). A 562 dichroic mirror (Semrock FF562-DiO3) was used to separate green and red fluorescence. BGG22(2) colored glass filter and 680 nm shortpass emission filter were placed in the green and red pathways, respectively. All experiments were performed at ∼34°C, using an external solution with [Ca2+]o = 3.8 mm. The following drugs were routinely added to the ACSF to isolate Ca2+ signals mediated by presynaptic CaVs (in μm): 100 picrotoxin, 5 CGP52432, 10 NBQX, 10 CPP, 1 LY341415, 100 MSOP, 1 DPCPX, and 10 nimodipine. The patch solution contained the following (in mm): 128 KCH3SO3, 10 HEPES, 10 phosphocreatine disodium salt, 4 MgATP, 0.4 Na2GTP, and 3 l-ascorbic acid and was added with the Ca2+-insensitive fluorophore Alexa Fluor 594 (50 μm; Invitrogen A10438) and the Ca2+-sensitive fluorophore Oregon Green BAPTA-1 (100 μm; Invitrogen O6806). Neurons were filled through the patch pipette for at least 1 h before imaging to ensure the concentration of all drugs and dyes reached equilibrium. Using the Alexa Fluor 594 fluorescence, axons were identified by their thin diameter, lack of spines, and their typical string-of-pearls appearance with neighboring boutons spaced a few micrometers away from each other. Individual boutons were identified as varicosities with diameter >1.5 times that of the adjacent axon. The spacing between adjacent varicosities was consistent with that previously reported for CA3 pyramidal cells (Shepherd et al., 2002). No detectable morphological deterioration of the imaged bouton was observed at the end of the line scans. We focused our analysis on boutons located 100–300 μm from the cell body, in areas CA1–3. The amplitude of the Ca2+ signals was independent of the bouton's location and was generated in response to a variable number of action potentials evoked by injecting short, positive current steps through the patch pipette (∼20 pA for 5–100 ms). Only boutons that showed a clear separation between failures (i.e., no action potential) and successes (i.e., one action potential) were included in the analysis. Ca2+ signals were detected in line scan mode (∼500 Hz; 60–90 pixel per line), using a laser power of <5%. Analysis of ΔF/F was performed in Igor Pro (Wavemetrics) with custom-made software (A.S.). For every scan, the background fluorescence was subtracted from the baseline fluorescence of the Ca2+ signal in the bouton. The change in the ratio of the fluorescent signal was then measured with respect to its baseline value. In a subset of experiments (n = 7), we compared the evoked Ca2+ signal with a maximal signal in a pipette filled with the imaging internal solution plus a saturating concentration of CaCl2 (2 mm), placed near the recorded bouton and scanned with the same settings used when measuring Ca2+ influx in the bouton. The ΔF/F elicited by three action potentials in the boutons was ∼46% of the ΔF/F measured in the pipette containing CaCl2 (2 mm). Different CaV antagonists had similar effects on the ΔF/F elicited by 1–3 action potentials, suggesting that the measured effects were not significantly biased by saturation of the Ca2+ indicator. The sublinear increase in Ca2+ influx detected in the imaging experiments when triggering multiple action potentials (see Fig. 6C) may be due to the slight depression of Ca2+ currents observed in CA3 pyramidal cells with repetitive stimulations (Fig. 4C,D). Time-dependent control experiments were performed to estimate the rundown of presynaptic Ca2+ signals occurring during the course of our experiments (0.23; n = 7). The effect of rundown and of various CaV antagonists on presynaptic Ca2+ signals evoked by 1–3 action potentials was measured by using the least-square method across all data points. The data presented in the text and shown in Fig. 6C have all been corrected for rundown. This means that even the small effect of C.GIVA on Ca2+ influx is not confounded by rundown. In the experiments where we measured the effect of different CaV antagonists on ΔF/F, after correcting for rundown, we used the least-squares method across all data points to calculate the effect of each CaV antagonist. Briefly, we calculated what constant fraction of the ΔF/F values evoked by 1–3 action potentials at the beginning of the experiments minimized the sum of the squared deviations with the ΔF/F values evoked by 1–3 action potentials in the presence of the CaV antagonists. Finally, to correct these values for any Ca2+ rise that may occur in the bouton but that is not necessarily coupled to vesicle release, we expressed the effect of ω-agatoxin IVA and ω-conotoxin GVIA on presynaptic Ca2+ influx as a fraction of the effect of ω-conotoxin MVIIC. The same approach was used to analyze the effect of these antagonists on GluA-EPSCs (Fig. 5A,B), so even here the effect of ω-agatoxin IVA and ω-conotoxin GVIA was compared with that of ω-conotoxin MVIIC. These normalized values were used to calculate m (Fig. 6D).
Figure 6.

Effect of P/Q- and N-type CaV antagonists on action potential-evoked, presynaptic Ca2+ signals. A, Two-photon z-stack projection of a CA3 pyramidal cell filled with Alexa Fluor 594 (50 μm) and Oregon Green BAPTA 1 (100 μm). The enlarged diagrams show examples of axonal tracts with multiple presynaptic boutons. The yellow dashed lines represent the direction of the line scans used for image acquisition. B, Left, Example of voltage recordings elicited by brief positive current injections in CA3 pyramidal cell bodies. Middle, Example of line scans from Schaffer collateral boutons in response to 0, 1, 2, and 3 action potentials. Right, ΔF/F analysis of the line scans (middle). The gray dotted lines represent individual line scan analysis (10 trials are superimposed), the black line represents the mean ΔF/F, and light blue shaded area represents SEM. C, Left, Summary graph of the ΔF/F measures from individual boutons in control (Ctrl, black) and in the presence of ω-agatoxin IVA (200 nm). The blue dashed line represents a scaled version of the control data that best fits the ω-agatoxin IVA data. ω-agatoxin IVA reduces the control ΔF/F to 0.72 of the value observed in control (see Materials and Methods). Right, Same analysis shown in the right, but in the presence of ω-conotoxin GVIA (1 μm). The toxin reduces the ΔF/F to 0.84 of the value observed in control. D, The CaV cooperativity m was derived by comparing the effect of these toxins relative to that of ω-conotoxin MVIIC (1 μm) on presynaptic Ca2+ signals and GluA-EPSCs, according to Equation 34. AP, action potential.
Error propagation analysis.
The data presented in Figures 5F and G and 6D provide an estimate of the number of CaVs that contribute Ca2+ to trigger the release of a single neurotransmitter vesicle (m). The following approach was used to calculate the error on m (Fig. 5F,G). According to a previous report (Takahashi and Momiyama, 1993), the GluA-EPSC fraction remaining after blocking a particular CaV subtype (EPSCX) depends on the fraction of the Ca2+ influx mediated by that CaV subtype and the number of CaVs contributing cooperatively to release. Equations 29–32 (see Results) show that the GluA-EPSC remaining after blockade of both P/Q and N-type CaVs can be described as follows:
If, for simplicity, we call EPSCN,P/Q = y, EPSCN = a EPSCP/Q = b, then this expression can be rewritten as follows:
 |
which is equivalent to the following:
 |
By including into this equation the error associated with each variable, we obtain the following:
 |
Here, however, we want to estimate the error on contributed by each variable taken separately. For example, if we want to obtain the error on due to errors in y, then we can write the following:
 |
By Taylor expanding this expression up to first order we obtain the following:
 |
All terms that are not associated with an error (δ) can be canceled out. From the remaining terms, we can calculate the relative error on due to errors on y, which we call . Accordingly:
 |
Since , we obtain the following:
 |
This is the error on m due to the error on y. If we use the same approach to estimate the error on m due to errors on a or b (which we call and , respectively), then we obtain the following:
 |
 |
Our experimental design allows us to consider , and as errors that are not correlated to each other (i.e., a larger error on does not generate a predictable larger or smaller error on , for example). Consequently, by summing in quadrature, we can express as the following:
 |
The red curves in Figure 5F were obtained by taking into account the error on m (i.e., on the x-axis) as described by Equation 17. The numerical values of the error on m reported (see Results) represent the minimum and the maximum of the intercepts between y = 0.07 ± 0.01 and the two red curves. The notation 1.7−0.4+0.5 indicates that m can vary between the values of 1.7–0.4 = 1.3 and 1.7 + 0.5 = 2.2.
Modeling in IgorPro.
We designed the membrane of the presynaptic terminal as a circle of radius = 345 nm, centered at the origin of a Cartesian coordinate system (see Fig. 7). A random number-generating function was used to obtain a uniformly distributed series of numbers in the range of ±110 nm for setting the x-coordinate of vesicles docked at the active zone, and in the range ±110 nm or ±330 nm (i.e., 345 nm terminal radius–15 nm vesicle radius) for setting the x-coordinate of CaVs, depending on whether we simulated CaVs distributed only in the active zone (Fig. 7A–C) or throughout the entire presynaptic membrane (Fig. 7F–H). The y-coordinate was chosen as a uniformly distributed random number within the range ± , where r is the radius of the active zone or of the whole presynaptic terminal (Fig. 7, compare A–C, F–H). Vesicles did not overlap, as their distance was set to be greater than the vesicle diameter. The [Ca2+] at each vesicle was calculated according to (Neher, 1998):
 |
where iCa is the single CaV current at 0 mV [0.13 pA (Li et al., 2007)], F = Faraday constant, DCa = diffusion coefficient of free Ca2+ [(220 μm2/s (Allbritton et al., 1992)], r = CaV-vesicle distance, and λ = length constant defined as follows:
 |
Here, Kon = rate of Ca2+ binding to free buffer and [B]free = free buffer concentration, a value related to the total buffer concentration ([B]tot) by the following:
 |
It is important to note that Equation 18 provides a steady-state approximation of [Ca2+] at a given vesicle and does not implement any time dependence of [Ca2+]. The equation assumes that at short CaV-vesicle distances Ca2+ equilibrates within a few microseconds. A more detailed analysis of the time dependence of [Ca2+] at each vesicle is obtained with the MCell models. In our simulations, [B]tot = 410 μm, Kon = 5 · 108 m−1 s−1, KD = 10 μm, and [Ca2+]basal = 0.1 μm (Klingauf and Neher, 1997). The results presented represent the average of 600 simulations. The mean ± SD of the obtained measures did not change significantly when the simulations were repeated >100 times.
Figure 7.
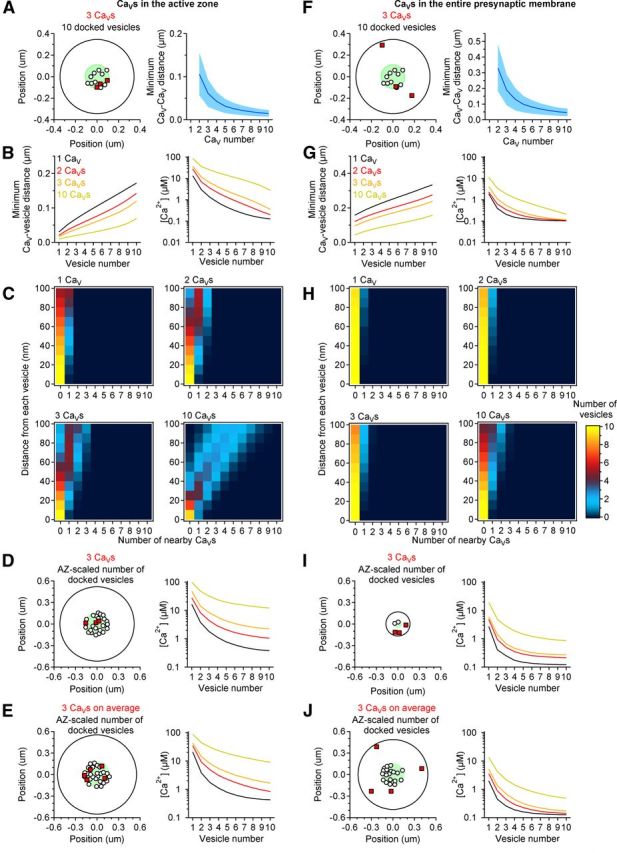
A small number of CaVs randomly distributed in the active zone leads to heterogeneous CaV–CaV, CaV-vesicle, and vesicular [Ca2+] distributions. A, Left, Example of the spatial organization of terminals with 10 vesicles (small open circles) and 3 CaVs (red squares) randomly distributed in the active zone (green circle) of a presynaptic terminal (large black circle). Right, Minimum distance between two CaVs (mean ± SD) in simulations with an increasing number of presynaptic CaVs (x-axis). B, Left, Minimum CaV distance from each vesicle. Vesicles are ranked according to their shortest average distance from all CaVs. Right, There is a heterogeneous distribution of [Ca2+] at each vesicle, which reaches values up to hundreds of μm. C, Graphs showing the number of vesicles (color coding on the right) that has any given number of CaVs (x-axis) at different distances from them (y-axis). Most vesicles are close to 0–1 CaV only when <10 CaVs are present in the active zone (i.e., the yellow-red pixels occur for x-axis, CaV values of 0–1). Instead, when the active zone contains 10 CaVs, there are many vesicles that are close to multiple CaVs, a scenario that is not consistent with the experimental results shown in Figs. 2–6. D, Left, Example of the spatial arrangement of terminals with three CaVs (red squares). The exact size of the terminal and of the active zone is set to vary within the range observed in anatomical studies (presynaptic terminal radius = 0.155–0.5735 μm; active zone radius (green circle) = 0.050–0.185 μm; see Materials and Methods; Schikorski and Stevens, 1997). The number of vesicles (small open circles) is set to vary in the range 2–27 and scales with the size of the terminal and of the active zone (more vesicles in larger terminals and active zones). In the example shown in this figure, 22 vesicles are randomly distributed in the active zone. Right, [Ca2+] detected by each vesicle under the simulation scenario represented in the left. Color coding as in B. E, Left, Example of the spatial arrangement of terminals where the number of docked vesicles (small open circles) and of CaVs (red squares) randomly distributed in the active zone (green circle), scales to the size of the presynaptic terminal and active zone. In the simulations described here, the size of the presynaptic terminal and of the active zone is randomly varied within the range described by (Schikorski and Stevens, 1997). We then set the average number of CaVs to be either 1, 2, 3, or 10. In the example described in this figure, 5 CaVs and 24 vesicles are spread randomly in the active zone. Right, [Ca2+] detected by each vesicle under the simulation scenario represented on the left. F–J, As in A–E, with CaVs randomly distributed in the whole presynaptic membrane. In this case most vesicles would not be close to any CaV and would detect values of [Ca2+] up to tens of μm. AZ, active zone.
In the simulations where we varied the size of the presynaptic membrane and kept fixed the number of CaVs (Fig. 7D,I), we used the following approach. As shown by (Schikorski and Stevens, 1997), there is a linear relation between the number of the docked vesicles (DVs) and the area of the active zone (AZarea). A linear fit of the data presented in [Schikorski and Stevens (1997), their Fig. 4C] gives the following:
and
where AZradius is the radius of the active zone and int defines the nearest integer value of the product within the parenthesis. Since the number of vesicles docked at hippocampal synapses varies in the range 2–27, then AZradius varies in the range 0.050–0.185. For an average synapse, the radius of the presynaptic terminal (PREradius) is approximately:
Therefore, in each simulation we generated a random number in the range 0.050–0.185 (representing AZradius) and calculated DVs and PREradius according to the formulas described above.
In the simulations where we varied the size of the presynaptic membrane, the number of docked vesicles and also the average number of CaVs (Fig. 7E,J), we used the following approach. AZradius varied in the range 0.050–0.185 and the number of docked vesicles was calculated as described previously (i.e., more vesicles at larger terminals). The number of CaVs was also scaled to the size of the active zone and varied according to the following relation:
 |
where CaV is the average number of CaVs specified in the labels of Figure 7E and J. This function returns an integer number drawn from a uniform distribution in the range [1,2CaV − 1].
Modeling in MCell.
The geometry of the presynaptic terminal was created in silico with an open source program (Blender 249.2), imported in a 3D Monte Carlo simulation environment (MCell v.3.1.944) and rendered with visualization software (DReAMM v.4.1.7). The simulations were run within a spherical space (world) of radius r = 365 nm. The presynaptic terminal was simulated as a hemisphere with radius r = 345 nm (i.e., the radius of an average hippocampal presynaptic bouton; Schikorski and Stevens, 1997), placed at the center of the world (see Fig. 8). Its inner surface reflected any diffusing molecule everywhere except in a 68 nm wide region at the top of the hemisphere, which mimicked the bouton neck. The basal [Ca2+] in the terminal was continuously clamped at 100 nm with MCell algorithms. The active zone (the region of the presynaptic terminal with docked vesicles) had a radius r = 110 nm (Schikorski and Stevens, 1997). Ten docked vesicles with radius r = 15 nm (Schikorski and Stevens, 1997) were randomly distributed in the active zone, 1 nm above the presynaptic membrane. A reserve pool of 260 vesicles was distributed throughout the whole presynaptic terminal (Schikorski and Stevens, 1997) (Fig. 8A). A custom-made program written in Python (A.S.) was used to randomize the 3D coordinates of vesicles and CaVs each time the simulation was iterated, and ensured that there was no spatial overlap between the vesicles or between the vesicles and the presynaptic membrane. Accordingly, the origin coordinates of each vesicle were set to be >30 nm (i.e., twice the vesicle radius) from the origin coordinates of all other vesicles and >15 nm (i.e., one vesicle radius) from the edges of the presynaptic terminal. All simulations were run with 10,000 time steps of 10 μs (except the simulations with 10 CaVs where [Ca2+]o = 3.8 mm, which were run with 2000 time steps of 50 μs), and iterated 40 times.
Figure 8.

Geometry of presynaptic terminals used for the Monte Carlo simulations and validation of the model. A, Each presynaptic bouton was simulated as a 345 nm radius hemisphere (volume = 0.086 μm3) with a 100 nm radius active zone (green area). An RRP of 10 vesicles (yellow) was spread in the active zone, with their bottom edge placed 1 nm above the presynaptic membrane. Each vesicle had a diameter of 30 nm. A reserve pool of 260 vesicles (blue) was scattered in the volume of the whole terminal (left). There was no overlap between neighboring vesicles and between vesicles and the membrane of the bouton. All surfaces were reflective to diffusing Ca2+ except for a 50 nm radius disk at the apex of the bouton that mimicked the bouton neck. The surface of this disk was absorptive for Ca2+. The basal Ca2+ concentration was clamped to 100 nm. The anatomy of this bouton reproduced the anatomy of average synaptic boutons at hippocampal synapses as described by (Schikorski and Stevens, 1997). Diffusion parameters were set as in (Klingauf and Neher, 1997; see Materials and Methods). B, Left, Scatter plot of the [Ca2+] and number of Ca2+ hits at each vesicle, for 40 simulation iterations, with different numbers of CaVs randomly distributed within the active zone. The open circles represent the mean ± SD. An overall linear relation between [Ca2+] and hits is observed. Right, The filled purple symbols represent the average value of Pv obtained experimentally with MPFA (Fig. 1B). Each open symbol represents the value of Pv at different [Ca2+]o obtained with the MCell simulations, with 1–10 CaVs. Pv for simulations with 1, 2, 3, and 10 CaVs are color coded with black, red, orange, and olive green open circles, respectively. C, As in B for synapses with nonrandom CaVs distributions.
In an initial series of simulations we verified that the presence of the reserve pool did not alter the time course of the Ca2+ transient in the whole terminal, or the number and time course of Ca2+ collisions onto each docked vesicle (data not shown). This result is not surprising because the volume of each vesicle (1.41e-05 μm3) is small compared with the volume of the terminal (0.086 μm3). Therefore, the volume occupied by 10 and 270 vesicles (0.14e-03 μm3 and 3.8e-03 μm3, respectively) does not change significantly the volume fraction of the terminal that is not occupied by obstacles (αg) and that remains available for Ca2+ diffusion (αg = 1, αg = 0.998 and αg = 0.956 for a terminal with 0, 10, and 270 vesicles, respectively), or the geometrical tortuosity of the terminal ((; λg = 1.00, λg = 1.00, and λg = 1.01 for a terminal with 0, 10, and 270 vesicles, respectively). The simulations presented in this paper were performed with 270 vesicles in the terminal (10 docked, 260 in the reserve pool) to match the morphological arrangement observed in anatomical studies (Schikorski and Stevens, 1997).
We modeled two different scenarios, whereby 1–10 CaVs were distributed either randomly (“Random”; see Fig. 9A,B) or nonrandomly within the active zone (“Nonrandom”; Fig. 9C,D) to mimic two different types of arrangement and coupling of CaVs and docked vesicles. In the latter case the CaVs were placed in the presynaptic membrane, right underneath the docked vesicles. The terminal was filled with mobile and immobile Ca2+ buffers, according to (Klingauf and Neher, 1997). Briefly:
 |
 |
 |
 |
 |
 |
 |
 |
The diffusion coefficient of Ca2+ was set to 220 μm2/s (Allbritton et al., 1992). The CaVs were modeled according to the kinetic reaction scheme for P/Q-type CaVs by (Li et al., 2007). Similar results were observed when the kinetic model for N-type CaVs was used (Li et al., 2007) (see Fig. 10A). Unless otherwise stated, we used the single channel current reported by the authors (0.13 pA at [Ca2+]o = 2 mm). The Ca2+ dependence of the single channel conductance (γ) at different [Ca2+]o was modeled according to (Weber et al., 2010), using the following Hill equation:
 |
Here, γ = single channel conductance, γmin = 0, γmax = 11 pS, KD = 4.7 mm, N = 1.3. The corresponding value of γ for [Ca2+]o = 0.5, 1.5, 2.0, and 3.8 mm, was γ = 0.57, 2.03, 2.73, and 4.74 pS. These measures were normalized by the value of γ for [Ca2+]o = 2 mm. For all [Ca2+]o, we calculated the driving force DF = Vm − ECa (for Vm = 0 mV and [Ca2+]i = 100 nm), and normalized this value by DF in [Ca2+]o = 2 mm. The product of γ and DF (i.e., i) was normalized such that the single CaV current at [Ca2+]o = 2 mm and Vm = 0 mV was 0.13 pA (Li et al., 2007). The single channel current for [Ca2+]o = 0.5, 1.5, 2.0, and 3.8 mm, was i = 0.023, 0.094, 0.13, and 0.241 pA, respectively. Voltage-dependent forward (αi, αI,0) and backward rates (βI, βI,0) for different state transitions were calculated according to (Li et al., 2007) as follows:
where αi,0 and βi,0 are the forward and backward rates at Vm = 0 mV, ki is the slope factor, and i identifies the state of the CaV. At t = 0 ms, Vm = −70 mV and at t = 1 ms Vm was stepped to 0 mV for 1 ms, to mimic the action potential presynaptic depolarization. The rates of CaVs gating were changed accordingly. In somatic I-clamp recordings, the resting membrane potential of CA3 pyramidal cells was −72 ± 1 mV and the action potential had the following biophysical characteristics: peak = 29 ± 5 mV, 20–80% rise time = 0.28 ± 0.02 ms, full-width at half-maximum = 1.38 ± 0.07 ms (n = 16). Therefore, the presynaptic voltage step used in the simulations provides a reasonable approximation of the somatic action potential in these cells.
Figure 9.
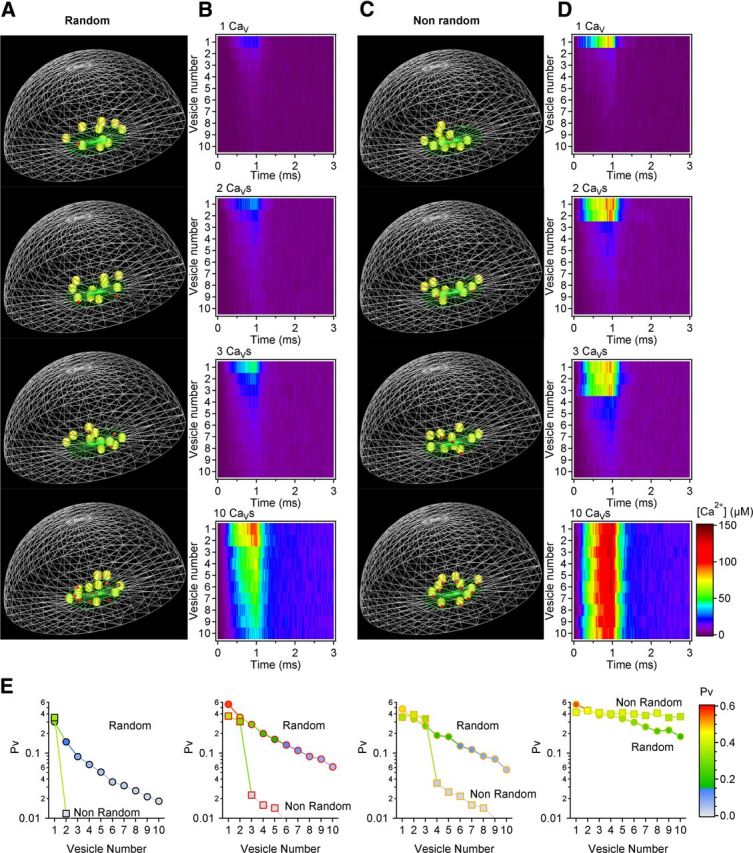
Modeling Ca2+ diffusion in presynaptic terminals shows the effects of the presence of few presynaptic CaVs on the distribution of Pv within a synapse. A, Example of the simulated 3D organization of a presynaptic terminal (gray wireframes), with 10 vesicles (yellow spheres) and 1–10 CaVs (red cubes) randomly distributed in the active zone (green wireframe; Random CaV distribution). The reserve pool of 260 vesicles is omitted for the clarity of illustration, but is included in the simulations (Fig. 8A). B, Time course of the Ca2+ hits onto each synaptic vesicle for the synaptic environments described in A. C, Example of the 3D organization of presynaptic terminals with 10 vesicles and 1–10 CaVs tethered to one or all vesicles (Nonrandom CaV distribution). D, As in B, for the Nonrandom simulation scenarios illustrated in C. E, Pv distribution at synapses with a variable number of CaVs randomly (circles) or nonrandomly distributed (squares) within the active zone.
Figure 10.
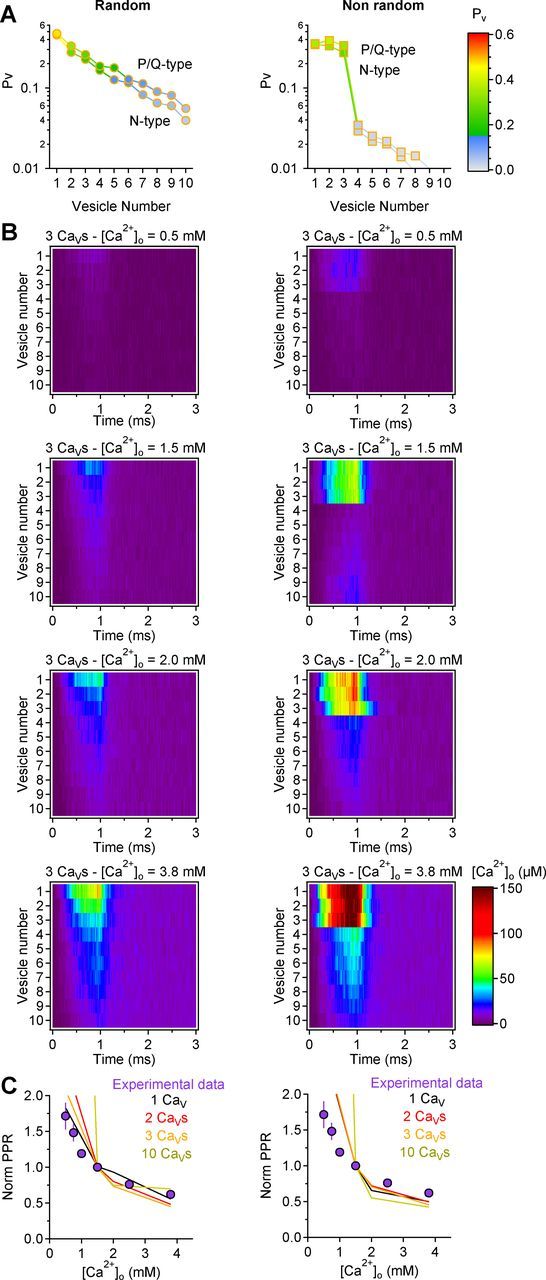
The Ca2+ dependence of PPR can be accounted for by the presence of three CaVs spread in the active zone. A, Comparison of the Pv distribution at synapses with three P/Q- or N-type CaVs (Li et al., 2007), either randomly spread in the active zone (left) or each tethered to a different synaptic vesicle (right). The results do not change appreciably between the two groups. B, Time course of the [Ca2+] at each vesicle when changing [Ca2+]o from 0.5 to 3.8 mm, at synapses with three CaVs randomly distributed in the active zone (left) or each one tethered to a synaptic vesicle. C, Comparison of the Ca2+ dependence of the normalized PPR derived experimentally (purple filled symbols; Fig. 1C) and with simulations at random (left) and nonrandom synapses (right).
We used custom-made Python scripts (A.S.) to rank the docked vesicles according to their distance from the CaVs (the docked vesicle ranked as number 1 was the closest to a CaV, whereas vesicle 10 was the farthest). In each simulation, we measured the time course of the number of Ca2+ collisions onto each vesicle (hits). We used hits as a measure of the [Ca2+] at each docked vesicle (Kerr et al., 2008, their Eq. 5.4; see Materials and Methods). Hits represents the number of Ca2+ collisions on the vesicle surface calculated at every time step of our simulations. This value is proportional to [Ca2+] at the vesicle surface averaged since the beginning of the simulation, calculated by MCell as the inverse of the Smoluchowski equation for rate encounter between particles of known concentration onto a surface of known area. From the average concentration (C(t)), one can then calculate the instantaneous [Ca2+] at a given vesicle (c̄(ti→tj)) as follows:
 |
Figure 8, B and C (left), shows the relation between the maximum number of hits calculated over a 1.1 ms time window, 0.2 ms after the onset of the depolarizing pulse, and the corresponding value of instantaneous [Ca2+]. Given the proportionality of hits and c̄(ti→tj), for simplicity, we based our derivation of Pv on a Hill function of hits, rather than c̄(ti→tj). In these calculations, the coefficient S was set to 1 (i.e., the maximum value of Pv could only vary between 0 and 1), N was set as the value that best described the Ca2+ dependence of Pv derived with MPFA (Fig. 1B), whereas the value of EC50 was derived through an iterative procedure, which minimized the difference between the value of Pv derived with the simulations at different [Ca2+]o (i.e., the average value of Pv measured across the vesicles in the RRP of the simulated synapses) and the corresponding value of Pv derived through the experiments shown in Figure 1B. The derived EC50 values were 28–84 μm and 54–73 μm for random and nonrandom CaV distributions, respectively. This approach allowed us to calculate Pv without relying on specific statistical descriptions of Pv distribution within each synapse, molecular characterization of all the reactions involved in triggering neurotransmitter release (e.g., Ca2+ binding to synaptotagmin C2A/B domains; Striegel et al., 2012), and without excluding the occurrence of multivesicular release events (the probability of multivesicular release varied from 0 when [Ca2+]o = 0.5 mm to 0.24 when [Ca2+]o = 3.8 mm). In the Nonrandom simulations, the size of the RRP corresponded to the number of vesicles coupled with a CaV (i.e., 1, 2, 3, and 10, when 1, 2, 3, and 10 CaVs were present in the active zone). In the Random simulations, the size of the RRP corresponded to the number of vesicles that had at least one CaV within a radius of <60 nm (Augustine et al., 1987; Adler et al., 1991) (i.e., 2, 3, 4, and 9 when 1, 2, 3, and 10 CaVs were present in the active zone). This analysis was performed with custom software (A.S.) written in Python and IgorPro 6.21 (Wavemetrics).
Modeling facilitation.
We used an iterative model generating random numbers between 0 and 1. For every iteration, at each vesicle, we set Pv on the second pulse (Pv2) to be zero if the random number was smaller than Pv on the first pulse (Pv1), to reproduce vesicle release, depletion, and lack of replenishment. If the random number was larger than Pv1, then Pv2 was set to be facilitated with respect to Pv1. In this case, Pv2 was set to vary with the number of hits at each individual vesicle, according to the same Hill function that described the MPFA data (Fig. 1B). In this function, the scaling factor S was set to 1, so that Pv2 could only vary between 0 and 1. The value of EC50 was chosen as the one that allowed us to get PPR = 2.70 when [Ca2+]o = 1.5 mm, in agreement with the experimental data (see Results). After estimating PPR at other [Ca2+]o, we normalized all of these values by the value of PPR at [Ca2+]o = 1.5 mm, as we also did for the experiments (Fig. 1C). PPR was calculated as follows: we defined GluA-EPSC1 = QP · N1 · Pv1, where QP is the quantal size, N1 is the number of vesicles ready for release, and Pv1 the average release probability of these vesicles on the first stimulation. Likewise, EPSC2=q · N2 · Pv2, where N2 is the number of vesicles ready for release and Pv2 the average release probability of these vesicles on the second stimulation. Since , then GluA-EPSC1 = q · and GluA-EPSC2 = q · , so that PPR = This ratio was calculated including all vesicles in the active zone. The model describes the Ca2+ dependence of facilitation with different numbers and distributions of CaVs without any assumptions about the molecular mechanism that underlies facilitation per se.
Results
The Ca2+ dependence of neurotransmitter release and short-term plasticity
We tested the Ca2+ dependence of glutamate release from Schaffer collaterals onto CA1 pyramidal cells by measuring the amplitude of GluA-EPSCs at different [Ca2+]o (Fig. 1A,B). GluA-EPSCs were evoked with a bipolar electrode placed in stratum radiatum, 100–150 μm away from the recorded pyramidal cell. Each recording began in ACSF containing 1.5:2.3 mm Ca2+:Mg2+, and the Ca2+:Mg2+ ratio was successively reduced stepwise to 0.5:3.3 mm (n = 7) or increased stepwise to 3.8:0 mm (n = 11; Fig. 1A,B). The relation between the GluA-EPSC amplitude and [Ca2+]o was highly nonlinear and could be fitted by a Hill equation with EC50 = 1.91 ± 0.10 mm and N = 3.72 ± 0.44 (Fig. 1B) (Reid et al., 1998). Similar estimates of N were also obtained by fitting a power function to the lower [Ca2+]o regions (N = 3.46 ± 0.29 in [Ca2+]o = 0.5–1.5 mm), suggesting that the measure of N was not biased by saturation of Ca2+ influx or of Ca2+ binding to sensors for neurotransmitter release, or by inadequate voltage-clamp at higher [Ca2+]o (Reid et al., 1998). These results agree well with previous reports at several different synapses (Katz and Miledi, 1970; Reid et al., 1998; Schneggenburger and Neher, 2000; Shahrezaei et al., 2006) showing that Ca2+ exerts a supralinear effect on neurotransmitter release (Weiss, 1997). We used MPFA (Silver et al., 1998; Saviane and Silver, 2007) of GluA-EPSCs to estimate Pv, the average vesicle release probability, at four different [Ca2+]o values within our experimental range of [Ca2+]o (Fig. 1B,D,E). By examining the parabolic relationship between GluA-EPSC variance and mean amplitude (Fig. 1E), we estimated Pv to be 0.02 ± 0.005 in [Ca2+]o = 0.5 mm, 0.24 ± 0.05 in [Ca2+]o = 1.5 mm, 0.48 ± 0.07 in [Ca2+]o = 2.5 mm[scap], and 0.67 ± 0.08 in [Ca2+]o = 3.8 mm (n = 9; Fig. 1B, filled purple symbols). The sensitivity to [Ca2+]o of Pv derived with MPFA matches closely to that described by the Hill fits of GluA-EPSC amplitudes, suggesting that varying [Ca2+]o alters only Pv, not the number of activated synapses. Accordingly, the afferent FV of field recordings recorded in stratum radiatum did not change when varying the Ca2+:Mg2+ ratio, whereas the slope of the fEPSC did (Fig. 1F,G).
Changes in Pv are typically accompanied by changes in short-term plasticity. At CA3→CA1 synapses, the response to the second of two stimuli delivered at brief interpulse intervals (≤600 ms) is enhanced relative to the first (Zucker and Regehr, 2002). A value of PPR >1 represents facilitation of synaptic transmission that is thought to arise from Ca2+ remaining in the terminal after the first stimulus, either free in the cytoplasm or bound to an element of the release machinery or to local Ca2+ buffers (Zucker and Regehr, 2002). At higher [Ca2+]o PPR decreases and this effect is thought to reflect vesicle depletion, because as more vesicles undergo release on the first stimulus, fewer of them remain available to release on the second one (Hsu et al., 1996; see Discussion). In our experiments, PPR of GluA-EPSCs evoked with a 50 ms interpulse interval was 2.70 ± 0.19 (n = 21) in [Ca2+]o = 1.5 mm, increased by 19 ± 3% (n = 10, ***p = 0.0003) when [Ca2+]o was reduced to 1.0 mm and decreased by 24 ± 4% (n = 11, ***p = 0.0003) when [Ca2+]o was raised to 2.5 mm (Fig. 1A,C). These results indicate that when [Ca2+]o = 1.5 mm, a concentration similar to the physiological [Ca2+]o in the CSF, changes in PPR are indicative of changes in Pv and of vesicle depletion at these synapses. For these reasons, unless indicated otherwise, the remainder of the experiments were performed in [Ca2+]o = 1.5 mm.
The number of CaVs triggering release from individual neurotransmitter vesicles
Similar effects on PPR to those observed when changing [Ca2+]o should occur with agents that reduce Ca2+ influx through CaVs. Mn2+, for example, dissociates from CaVs so rapidly that it is expected to block and unblock CaVs many times during a ∼1 ms long action potential (Lansman et al., 1986). Therefore, a subsaturating Mn2+ concentration should reduce Ca2+ influx just like lowering [Ca2+]o. Accordingly, Mn2+ (500 μm) decreased GluA-EPSC amplitude to 0.23 ± 0.03 and increased PPR by 31 ± 6% (n = 19, ***p = 0.00013; Fig. 2A,B). The effects of Mn2+ on both GluA-EPSC amplitude and PPR were similar to those observed when [Ca2+]o was lowered from 1.5 mm to 0.75 mm (p = 0.15 and p = 0.91, respectively) (Fig. 2B).
In contrast to Mn2+, Cd2+ dissociates more slowly from CaVs (Koff = 33 s−1 at −80 mV; Chow, 1991), so that a subsaturating Cd2+ concentration blocks each CaV in an “all-or-none” fashion over the time scale of an action potential at physiological temperature. While Cd2+ certainly should reduce GluA-EPSC amplitude, its effects on PPR are more difficult to predict: if multiple CaVs contribute the Ca2+ necessary to release a vesicle, Cd2+ should increase PPR just like Mn2+. However, if neurotransmitter release was triggered by a single CaV, Cd2+ would not change PPR, because release from vesicles encountering no Ca2+ during the first stimulus would not facilitate during the second stimulus, while release from vesicles encountering Ca2+ during the first stimulus would facilitate as much as in the absence of Cd2+. We found that Cd2+ (25 μm) and Mn2+ (500 μm) reduced the GluA-EPSC amplitude to a similar extent (Cd2+: 0.21 ± 0.03, n = 34; Cd2+ vs Mn2+ p = 0.71) (Fig. 2A,B). However, Cd2+ did not increase PPR, but rather slightly reduced it (normalized PPR Cd2+: 0.91 ± 0.04, n = 34, *p = 0.02, Cd2+ vs Mn2+ ***p = 5.86e-5; Fig. 2A,B).
Several control experiments tested whether potential artifacts may have confounded the Cd2+/Mn2+ experiments. First, when Cd2+ and Mn2+ were applied one after the other to the same cells, Cd2+ did not alter PPR (normalized PPR Cd2+: 1.04 ± 0.09, n = 11, p = 0.66), whereas Mn2+ significantly increased it (normalized PPR Mn2+: 1.31 ± 0.08, **p = 0.002) (Fig. 3A–C). Second, the distinct effects of Cd2+ and Mn2+ were evident over a range of concentrations (Fig. 3D,E) and [Ca2+]o (Fig. 3F,G). Third, Mn2+ increased PPR across a wide range of interpulse intervals (5–600 ms; n = 10, ***p = 3.13e-5), while no change in PPR was observed with Cd2+ (n = 15, p = 0.36) (Fig. 3H,I). Fourth, Cd2+ and Mn2+ reduced CaV currents in CA3 pyramidal cells to a similar extent (Fig. 4A,B), did not affect the voltage dependence of the CaV currents (Fig. 4A,B) and did not induce short-term changes in Ca2+ currents or intracellular [Ca2+] due to facilitation/inactivation of presynaptic CaVs in CA3 pyramidal cells (Fig. 4C,D). This was tested by comparing electrophysiological and imaging experiments. In the electrophysiology experiments, we patched CA3 pyramidal cells; evoked Ca2+ currents with brief, 10 ms depolarizing voltage steps at different interpulse intervals; and measured the PPR of Ca2+ currents isolated with Cd2+ (25 or 100 μm) or Mn2+ (500 μm; Fig. 4D). In separate two-photon Ca2+-imaging experiments, we patched CA3 pyramidal cells, loaded them with the red fluorophore Alexa Fluor 594 (50 μm) and the Ca2+ indicator Oregon Green BAPTA-1 (100 μm), used similar voltage steps to evoke single action potentials at different interpulse intervals, and monitored the corresponding Ca2+ influx in individual axonal boutons of the patched cell (Fig. 4C,D). The paired-pulse depression of Ca2+ signals observed in the imaging experiments (Fig. 4D, red asterisks) was undistinguishable from that observed when isolating Ca2+ currents with Cd2+ or Mn2+ (Fig. 4D, open, light blue and light green symbols) suggesting that Cd2+/Mn2+ did not induce any change in presynaptic Ca2+ dynamics. Fifth, neither Cd2+ nor Mn2+ altered the Ca2+ dependence of release (N; Fig. 4E,F). Finally, if Cd2+ affects PPR differently compared with Mn2+ because Cd2+ dissociates more slowly from the CaVs, other slowly dissociating CaV antagonists should also decrease GluA-EPSC amplitude without changing PPR. To test this idea we blocked P/Q- and N-type CaVs, the major CaV types contributing release from Schaffer collateral synapses (Wheeler et al., 1994), with ω-agatoxin IVA (200 nm) and ω-conotoxin GVIA (1 μm), respectively. Consistent with our prediction, each of these antagonists reduced GluA-EPSC amplitude but did not affect PPR (Fig. 5A,B). Similar results were obtained with ω-conotoxin MVIIC (1 μm), which blocks both P/Q- and N-type CaVs (Fig. 5A,B), and also with antagonists of other CaV types, like Ni2+ and mibefradil (Fig. 5B). Furthermore, neither ω-agatoxin IVA nor ω-conotoxin GVIA altered PPR significantly at different interpulse intervals (control-ω-agatoxin IVA: n = 11, p = 0.17; control-ω-conotoxin GVIA: n = 10, p = 0.43) (Fig. 5C), and neither of them changed significantly the Ca2+ dependence of release (N; Fig. 5D,E).
These results are consistent with a scenario in which individual vesicles sense Ca2+ influx through a single CaV. This conclusion echoes work at chick ciliary ganglia (Stanley, 1993) and GABAergic synapses in the hippocampal dentate gyrus (Bucurenciu et al., 2010) but, for reasons that remain unclear, it contradicts other reports that at Schaffer collateral synapses (the synapses studied here) multiple CaV subtypes supply the Ca2+ necessary to trigger release of individual vesicles (Wheeler et al., 1994; Wu and Saggau, 1994). The latter studies, performed in different species at subphysiological temperatures (3- to 4-week-old rats, 24°C; Wheeler et al., 1994; 1- to 2-month-old guinea pig, 28−30°C; Wu and Saggau, 1994), examined the effects of ω-agatoxin IVA and ω-conotoxin GVIA on GluA-EPSC amplitude. Both studies reported that the summed, relative reduction of the GluA-EPSC by the antagonists, each applied alone, greatly exceeded 1, suggesting that Ca2+ influx through multiple CaVs overlaps at single vesicles. One of these studies also reported that both toxins increased PPR (Wheeler et al., 1994), contrary to our results, so we tested whether ω-agatoxin IVA and ω-conotoxin GVIA effects on GluA-EPSC amplitude were supralinear under our experimental conditions. In our hands, ω-agatoxin IVA (200 nm) reduced the GluA-EPSC amplitude by 0.68 ± 0.05 (n = 18, ***p = 1.8e-10) and ω-conotoxin GVIA (1 μm) reduced GluA-EPSCs by 0.45 ± 0.05 (n = 21, ***p = 5.95e-7; Fig. 5A,B), for a total blockade of 1.13 ± 0.05 (see Materials and Methods for error calculations). These results were not biased by rundown of the GluA-EPSC amplitude during the course of the recordings, because no significant change in the GluA-EPSC amplitude was detected in separate time-dependent control experiments where the slices were not exposed to any CaV antagonist (normalized GluA-EPSC amplitude: 0.91 ± 0.05, n = 10, p = 0.09; the effect of CaV antagonists on GluA-EPSC amplitude was corrected by this control value). One possibility is that the combined block we observed is not significantly different from 1, which may indicate that P/Q- and N-type CaVs mediate all the Ca2+ influx required for release and that there is no overlap in Ca2+ influx between the two CaV subtypes. If this were true, blocking the two channels simultaneously with a high concentration of ω-conotoxin MVIIC (1 μm) should eliminate GluA-EPSCs entirely. Instead, ω-conotoxin MVIIC blocked GluA-EPSCs by 0.93 ± 0.01 (n = 7, ***p = 4.08e-10 compared with 1, **p = 0.001 with 0; Fig. 5A,B). Previous reports (Takahashi and Momiyama, 1993) reasoned that the GluA-EPSC fraction remaining after blocking a particular CaV subtype (EPSCX) depends on the fraction of the Ca2+ influx mediated by that CaV subtype (CaVX) and the number of CaVs contributing cooperatively to release (m), such that:
From this expression, it follows that:
 |
Here we distinguish between CaV cooperativity (m) (Takahashi and Momiyama, 1993), which refers to the number of CaVs that contribute Ca2+ to the release of a single vesicle, from Ca2+ cooperativity (N), which indicates the number of Ca2+ ions that must bind to Ca2+ sensors to trigger the release of each vesicle (Reid et al., 1998; Shahrezaei et al., 2006) (Fig. 1B). The GluA-EPSC remaining following blockade of both P/Q- and N-type CaVs (EPSCN,P/Q) is as follows:
 |
which simplifies to
Using our experimentally measured values of EPSCP/Q (0.32 ± 0.05 in ω-agatoxin IVA), EPSCN (0.55 ± 0.05 in ω-conotoxin GVIA), and EPSCN,P/Q (0.07 ± 0.01 in ω-conotoxin MVIIC) (Fig. 5A,B), and assuming m to be the same for P/Q- and N-type CaVs (see below), we estimated m to be 1.7−0.4+0.5 (Fig. 5F; see Materials and Methods for error calculation and notation), significantly less than previously reported (Wheeler et al., 1994; Wu and Saggau, 1994) and suggesting very little cooperativity between CaVs at CA3→CA1 synapses under our experimental conditions.
Similar results were also obtained when performing an equivalent analysis with a broader group of CaV antagonists. Here y, the sum of all CaV fractions blocked by all types of different presynaptic CaVs, is expressed as follows:
 |
The value of m, obtained as the intercept on the x-axis for y = 1, corresponds to 2 (Fig. 5G), again suggesting low CaV cooperativity at Schaffer collateral synapses. The exact value of m derived with these approaches, however, should be interpreted with some caution, because in principle they could potentially overestimate or underestimate the true CaV cooperativity m if any CaV antagonist acted nonselectively (McCleskey et al., 1987) or failed to completely block its target CaV (Wang et al., 1992), respectively.
To estimate m more accurately, we monitored the effect of different CaV antagonists on both postsynaptic GluA-EPSC amplitude and presynaptic Ca2+ influx (Wu and Saggau, 1994; Bucurenciu et al., 2010) (Fig. 6). To measure presynaptic Ca2+ signals, we patched CA3 pyramidal cells and loaded them with both the red fluorophore Alexa Fluor 594 (50 μm) and the Ca2+ indicator Oregon Green BAPTA-1 (100 μm). Individual axonal boutons in areas CA1–3 were identified as varicosities with diameter >1.5 times that of the adjacent axon, spaced a few micrometers away from each other as previously reported by (Shepherd et al., 2002). The boutons were imaged in line-scan mode with a two-photon laser-scanning microscope (see Materials and Methods). The amount of Ca2+ entering each bouton increased progressively as more action potentials were triggered by brief positive current injections to the soma of CA3 pyramidal cells (Fig. 6B). The fraction of all presynaptic Ca2+ influx that was blocked by different CaV antagonists when evoking 1–3 action potentials was as follows: CaVP/Q = 0.28, CaVN = 0.16, and CaVN,P/Q = 0.33 (Fig. 6C; see Materials and Methods). Antagonist effects did not depend on response size or the number of action potentials, suggesting that saturation of the Ca2+ indicator was unlikely to bias the quantification of the effect of various CaV antagonists on presynaptic Ca2+ influx (see Materials and Methods). To correct for any Ca2+ influx in the bouton that may not be coupled to vesicle release, we expressed the effect of ω-agatoxin IVA and ω-conotoxin GVIA on presynaptic Ca2+ influx as a fraction of the effect of ω-conotoxin MVIIC (CaVP/Q = 0.28/0.33 = 0.85; CaVN = 0.16/0.33 = 0.48). Likewise, we calculated the effect of ω-agatoxin IVA and ω-conotoxin GVIA on the GluA-EPSC amplitude (Fig. 5B) relative to the effect of ω-conotoxin MVIIC (EPSCP/Q = 0.32 ± 0.05/0.93 ± 0.01 = 0.34 ± 0.05; EPSCN = 0.55 ± 0.05/0.93 ± 0.01 = 0.59 ± 0.05). The CaV cooperativity m was then calculated by comparing the effect of each CaV antagonist on presynaptic Ca2+ influx and postsynaptic GluA-EPSC according to the formula described above as follows EPSCX = (1 − CaVX)mX.
Therefore:
 |
We derived mP/Q = 0.6 ± 0.1 in the presence of ω-agatoxin IVA and mN = 0.8 ± 0.1 in the presence of ω-conotoxin GVIA (Fig. 6D), again supporting very low and similar cooperativity of P/Q- and N-type CaVs in triggering release from these synapses (Wu and Saggau, 1994; Reid et al., 1998).
Overall, the results of this analysis support our electrophysiological experiments and the presence of a very low cooperativity of CaVs in triggering release from Schaffer collateral synapses. They indicate that in the mouse hippocampus, at physiological temperature, excitatory transmission is generally initiated by a single CaV.
The spatial distribution of CaVs in the active zone
The experiments described above do not distinguish whether all or only some of the vesicles docked at the active zone detect Ca2+ entering the terminal through a neighboring CaV. If every vesicle in the RRP were coupled to one or more CaVs, each one of them would act as an equivalent (and likely independent) release unit. Under physiological conditions ([Ca2+]o = 1.5 mm, Pv = 0.24; Fig. 1B) the release probability of the whole synapse, measured as 1-failure probability, would be very high (1-f = 1 − (1 − Pv)Nv = 0.94 when Nv, the average number of vesicles in the active zone, is 10 (Schikorski and Stevens, 1997). The values of 1-f measured with electrophysiological and optical approaches at individual synapses, however, are significantly smaller (1-f = 0.2–0.4 (Stevens and Wang, 1995; Hjelmstad et al., 1997; Murthy et al., 1997; Oertner et al., 2002; Enoki et al., 2009). These smaller values of 1-f can only be obtained if a smaller subset of vesicles in the active zone were coupled to a CaV or if few CaVs were scattered randomly in the active zone. In the latter case, the release probability of the whole synapse, 1-f, would be very close to the release probability of the one “favored” vesicle located closest to one of the CaVs. This vesicle would have a relatively high probability of being released (i.e., depleted) with a single stimulation and this could have a profound effect in shaping the Ca2+ dependence of PPR when the synapse is stimulated repeatedly (Fig. 1C).
To distinguish between these different scenarios, we first used numerical simulations and tested the effects of varying the number and relative arrangement of CaVs and vesicles in the active zone. We constructed analytical and 3D, Monte Carlo models of active zone geometry and Ca2+ diffusion in the presynaptic terminal, and configured the active zone as a circle (110 nm radius, 0.039 μm2 in area) with 10 docked vesicles scattered randomly across the active zone area, consistent with data from electron microscopy studies of Schaffer collateral boutons (Schikorski and Stevens, 1997). Increasing the number of presynaptic CaVs spread randomly in the active zone increased the likelihood for CaVs and vesicles to be close to each other (minimum CaV–CaV distance: 10 ± 5 with 2 CaVs, 6 ± 3 with 3 CaVs, 1 ± 1 with 10 CaVs; minimum CaV-vesicle distance: 30 ± 15 nm with 1 CaV, 21 ± 11 with 2 CaVs, 17 ± 8 with 3 CaVs, 9 ± 5 nm with 10 CaVs; mean ± SD; Fig. 7A,B). As the number of CaVs increased (e.g., 10), more vesicles became close to multiple CaVs (Fig. 7C), a scenario that is not consistent with the low average CaV cooperativity suggested by our experiments (Figs. 2–6). When only a few CaVs were present in the active zone (e.g., 1–3), most vesicles were close to 0–1 CaV (Fig. 7C), a scenario that is more consistent with the low CaV cooperativity suggested by the experiments (Figs. 2–6). Under these conditions, the minimum CaV-vesicle distance and [Ca2+] varied substantially among vesicles (Fig. 7B, left). Typically, one “favored” vesicle was closer and detected a significantly higher [Ca2+] than all other vesicles (Fig. 7B), and likely exhibited the highest Pv. This trend was also observed when the CaVs were spread across the entire presynaptic terminal, rather than only in the active zone (Fig. 7F--H). However, the minimum CaV-vesicle distance became significantly longer and the [Ca2+] at each vesicle so low that any release event would be extremely rare (see Discussion; Fig. 7G). The results of these numerical simulations remained similar when taking into account the possibility that the number of vesicles (Fig. 7D,I) or that both the number of vesicles and CaVs (Fig. 7E,J) vary among synapses, scaling to the size of the whole presynaptic terminal and of its active zone (see Materials and Methods).
A more detailed 3D Monte Carlo model (Figs. 8–10) confirmed these conclusions and allowed us to take into account any variability arising from (1) stochastic opening of CaVs in response to presynaptic depolarization (each CaV could open and close stochastically according to the kinetic scheme of (Li et al., 2007), where the maximum CaV open probability at 0 mV is 0.74); (2) random diffusion of Ca2+ ions in the terminal (i.e., no assumption of linearized Ca2+ diffusion was made, but each Ca2+ ion could move randomly around the vesicles in the presynaptic terminal); (3) time dependence of the [Ca2+] at each vesicle (i.e., there was no assumption of rapid Ca2+ equilibration at the vesicles); and (4) variability in the time profiles of the local [Ca2+] at each docked vesicle (see Materials and Methods; Figs. 8–10). Forty different synapses, each with 10 randomly located docked vesicles, were simulated. We varied the number of CaVs in the active zone. At random synapses, the CaVs were spread randomly with respect to synaptic vesicles; at nonrandom synapses, each CaV was tightly coupled to a synaptic vesicle. The average [Ca2+] at each vesicle derived through these simulations (obtained by converting hits, the number of Ca2+ collisions onto each docked vesicle, into [Ca2+]; Fig. 8B,C, left) was converted to Pv by expressing Pv as a Hill function of [Ca2+] at each vesicle, in a way that best reproduced the Ca2+ dependence of Pv measured with MPFA (Fig. 8B,C, right). In this equation, the parameter S was set to 1, so that Pv could never exceed this value, and EC50 was set to provide the best fit between the average value of Pv estimated across the RRP of the simulated synapses and the value of Pv derived from the experimental data (see Materials and Methods). This model confirmed that Pv was highly heterogeneous across synaptic vesicles if <10 CaVs were spread randomly in the active zone, whereas as expected there was very little variability in Pv across the vesicles coupled to CaVs at nonrandom synapses (Fig. 9A–E). These estimates of Pv did not change significantly when replacing P/Q-type with N-type CaVs (Fig. 10A) suggesting that, from a purely biophysical standpoint, these CaV types are equally efficient in triggering transmitter release. To understand how the number and spatial arrangement of CaVs affects short-term plasticity, we used these simulations to estimate PPR at different extracellular [Ca2+]o (Fig. 10B,C). For every vesicle, the release probability on the first pulse (Pv1) varied as a Hill function of [Ca2+], as described previously (Fig. 8B,C, right). If release occurred on the first pulse, then the vesicle release probability on the second pulse (Pv2) was set to zero (i.e., the vesicle was not available for release on the second pulse). If release did not occur on the first pulse, then Pv2 was set to be facilitated relative to Pv1, by an amount that allowed the best reproduction of the experimental data (see Materials and Methods). The model did not make any specific assumption on the molecular mechanism underlying facilitation. As expected, increasing [Ca2+]o led to a progressive decrease in PPR (Fig. 10C). If each vesicle were coupled to its own CaV, or if 10 CaVs were scattered in the active zone, the Ca2+ dependence of PPR was steeper than that observed experimentally. A better match with the Ca2+ dependence of PPR observed experimentally only occurred if there were few CaVs in the active zone, particularly if these were distributed randomly with respect to synaptic vesicles (Fig. 10C). These results suggest that release from small excitatory hippocampal synapses can be ensured by a small population of CaVs spread in the active zone and that this organization by itself could account for the Ca2+ dependence of short-term plasticity at these synaptic connections.
Discussion
Our findings suggest that neurotransmitter release from CA3→CA1 synapses is typically initiated by few functional CaVs (<10, possibly 3) distributed randomly within the active zone. Previous estimates of CaV number and cooperativity for neurotransmitter release at other synapses relied on correlated freeze-fracture electron microscopy–physiology analysis (Pumplin et al., 1981), atomic force microscopy of immunolabeled CaVs (Haydon et al., 1994), two-photon Ca2+ imaging (Bucurenciu et al., 2010), and immunogold electron microscopy (Holderith et al., 2012). At CA3→CA1 synapses, Ca2+ imaging experiments suggested that vesicle release is triggered by multiple CaVs, but these experiments relied on the use of AM Ca2+ indicators (which label multiple axon types) and wide-field imaging in large neuropil areas (which averages out Ca2+ influx in the terminal and along the axon) (Wu and Saggau, 1994). We overcame these limitations by performing Ca2+ imaging experiments in individual boutons. We used these experiments, together with electrophysiological recordings and diffusion simulations, to estimate the CaV cooperativity at individual vesicles, the total number of functional CaVs in the active zone, and the relative distribution of CaVs and neurotransmitter vesicles at CA3→CA1 synapses. Our findings do not support the existence of numerous functional CaVs in the active zone, a stereotyped arrangement of CaVs and vesicles, or a uniform distribution of Pv across docked vesicles, all characteristic features of some large synapses like the neuromuscular junction. In reaching our conclusions, we controlled for the possible confounding influence of the following: (1) intersynaptic variability in CaV-vesicle distribution (the distribution of vesicles and CaVs was randomized in each iteration of our simulations); (2) intersynaptic variability in the size of the synapse and in the number of vesicles docked at their active zone (Fig. 7D,E); (3) contribution to release by CaVs in the whole terminal (Fig. 7G--J); (4) differences in the ability to trigger release of P/Q- and N-type CaVs (Fig. 10A); and (5) accommodation of Ca2+-triggered exocytosis, rather than vesicle depletion, as the mechanism underlying the reduction of PPR at higher [Ca2+]o (Hsu et al., 1996). Although we favor the vesicle-depletion hypothesis, the results of our simulations hold regardless of the exact molecular mechanisms establishing the inverse relation between PPR and [Ca2+]o. This is because our model calculates PPR in probabilistic, not mechanistic terms: it uses the value of Pv to determine the probability that a given vesicle will not be available for release during subsequent stimulations regardless of whether depletion or Ca2+-dependent accommodation renders a particular vesicle unavailable for release. The likelihood of either phenomenon depends on the average value and distribution of Pv, which in turn depends on the relative arrangement of CaVs and vesicles in the active zone.
A potential caveat for the interpretation of our results could occur if opening of one CaV triggered opening of other CaVs by local membrane depolarization or by activating Ca2+-dependent mechanisms or G-protein-coupled signaling pathways (Dolphin, 2003). In this scenario, what we interpret as a single functional CaV may be a CaV cluster. Although CaV clusters seem unlikely to occur at synapses with an average active zone area of ∼0.04 μm2 (Schikorski and Stevens, 1997; Holderith et al., 2012), further studies are required to understand whether this could account for potential discrepancies between our results and those obtained by anatomical studies at CA3→CA3 hippocampal synapses (Holderith et al., 2012) or whether the CaV arrangement varies with target cell identity.
A recent computational study reported opposite conclusions regarding the number and distribution of CaVs at CA3→CA1 synapses, for reasons that are currently unclear (Nadkarni et al., 2012). Although they might be partly attributed to differences in the proposed geometry and biophysical characteristics of the synapse (Nadkarni et al., 2010), Nadkarni et al., (2012) analyzed primarily the effects of varying the relative distance between clusters of docked vesicles and CaVs, not the effect of randomizing vesicles and CaVs relatively to each other. The study also relied on short-term facilitation being entirely determined by free residual Ca2+ in the bouton, a feature that is not constrained in our model. Future experiments may clarify this issue but our experiments with CaV antagonists (Figs. 2–6) do not support the hypothesis that release at CA3→CA1 synapses is typically initiated by clusters of ∼70 CaVs at 300 nm from the active zone (Nadkarni et al., 2012).
The arrangement of CaVs and the statistics of release
Simple binomial statistics has been used as a general model to describe the quantal nature of synaptic transmission. This approach provides a good description of neurotransmitter release at synapses like the neuromuscular junction, where the orderly arrays of vesicles and CaVs confer every vesicle similar to Pv. The applicability of this model at many central synapses has been complicated by the fact that synaptic events at different locations suffer from variable amounts of electrotonic attenuation, can be small compared with background noise, and exhibit large variability in Pv and QP across and within boutons. As a result, release at small central synapses has been better described by nonuniform statistical models (Walmsley et al., 1987; for review, see Isaacson and Walmsley, 1995). Our results provide a mechanistic basis for the heterogeneity of release within and across terminals, and suggest it might be due to the presence of few functional CaVs sparse within the active zone. One appealing feature of the simple binomial model is that it provides a direct estimate of the total number of vesicles available for release and of their Pv, but its use at synapses where the total vesicle number and Pv varies from synapse to synapse and from vesicle to vesicle leads to obvious errors in the estimates of these parameters. The significance of the deviation from the actual values depends on the extent of the interbouton and intervesicle variability of Pv, and cannot be established a priori (Quastel, 1997). MPFA takes into account the existence of intersite and intrasite variability of Pv, but likely estimates Pv only at a subset of docked vesicles closest to a neighboring CaV. In our case, this scenario predicts values of 1-f that are consistent with those derived experimentally (Stevens and Wang, 1995; Hjelmstad et al., 1997; Murthy et al., 1997; Oertner et al., 2002; Enoki et al., 2009) and suggests that a subset of vesicles in the active zone, with high Pv, could undergo significant depletion (even at synapses with low, average Pv like Schaffer collaterals) and shape short-term plasticity.
Strategies to couple CaVs and synaptic vesicles
At the squid giant synapse and goldfish retinal bipolar cell synapse, neurotransmitter release persists in high concentrations of presynaptic EGTA but not BAPTA (Adler et al., 1991; von Gersdorff and Matthews, 1994), suggesting that CaVs are less than a few tens of nanometers away from synaptic vesicles (i.e., nanodomains). By contrast, at the calyx of Held in young rodents, neurotransmitter release is sensitive to 1 mm EGTA, and 10 mm EGTA and 1 mm BAPTA are equally potent in blocking synaptic transmission, and Ca2+ uncaging triggers release once the pool of vesicles responsible for fast synchronous release is depleted (Wadel et al., 2007), suggesting that greater CaV-vesicle distances exist (i.e., microdomains) (Borst and Sakmann, 1996). Under these conditions, a single CaV would raise the [Ca2+] at the nearest vesicles up to only a few nm but large CaV clusters at 30–300 nm from neighboring vesicles (or at a narrower range of distances in mature animals; Fedchyshyn and Wang, 2005) could sustain release (Meinrenken et al., 2002). Large CaV pools could render release less susceptible to stochastic variability in CaV activation, enabling release even when a subset of all functional CaVs opens briefly. In mature animals, this feature could ensure faithful information transfer at high stimulation frequencies. CA3→CA1 synapses, however, receive inputs at much lower frequencies than auditory synapses and here the presence of large CaV clusters may be redundant or physically implausible. The small size of these synapses allows even a single CaV randomly placed in the active zone to be very close to a neighboring vesicle and to detect [Ca2+] up to tens of μm, even when any stochastic behavior of the CaV is taken into account (Figs. 7–10).
Recent work suggests that specific molecular tethers link together CaVs and synaptic vesicles (Kaeser et al., 2011), but it remains unclear whether tethers (1) are required for release; (2) vary in number across docked vesicles; (3) each anchor only one CaV; (4) have fixed length, or can expand or rapidly (un)bind from vesicles and CaVs; and (5) boost the efficiency of synaptic transmission. Our experiments cannot resolve these specific issues, but suggest that tethers may not be required for efficient synaptic transmission, because the small size of most central synapses places vesicles and CaVs in close proximity even if not physically linked together. Tethers may exist only at a subset of synaptic vesicles and have flexible structures and labile interactions with CaVs and vesicles. In this case, synapses with and without tethers would behave very similarly, as the synapses in our simulations that were defined random synapses. The (dis)advantage of having tethers remains unknown but, during repetitive stimulation, it may be faster to recruit vesicles via diffusion than with specific tethers.
Footnotes
This work was supported by the National Institute of Neurological Disorders and Stroke Intramural Research Program (NS002986). We thank J.M. Kerr, D.M. Kullmann, C.J. McBain, A. Poleg-Polsky, and L.G. Wu for comments on this manuscript; M. Dittrich for help with MCell; and T. Prustel and I. Scimemi for help with error propagation analysis.
The authors declare declare no competing financial interests.
References
- Adler EM, Augustine GJ, Duffy SN, Charlton MP. Alien intracellular calcium chelators attenuate neurotransmitter release at the squid giant synapse. J Neurosci. 1991;11:1496–1507. doi: 10.1523/JNEUROSCI.11-06-01496.1991. [DOI] [PMC free article] [PubMed] [Google Scholar]
- Allbritton NL, Meyer T, Stryer L. Range of messenger action of calcium ion and inositol 1,4,5-trisphosphate. Science. 1992;258:1812–1815. doi: 10.1126/science.1465619. [DOI] [PubMed] [Google Scholar]
- Augustine GJ, Charlton MP, Smith SJ. Calcium action in synaptic transmitter release. Annu Rev Neurosci. 1987;10:633–693. doi: 10.1146/annurev.ne.10.030187.003221. [DOI] [PubMed] [Google Scholar]
- Borst JG, Sakmann B. Calcium influx and transmitter release in a fast CNS synapse. Nature. 1996;383:431–434. doi: 10.1038/383431a0. [DOI] [PubMed] [Google Scholar]
- Bucurenciu I, Bischofberger J, Jonas P. A small number of open Ca2+ channels trigger transmitter release at a central GABAergic synapse. Nat Neurosci. 2010;13:19–21. doi: 10.1038/nn.2461. [DOI] [PubMed] [Google Scholar]
- Chow RH. Cadmium block of squid calcium currents. Macroscopic data and a kinetic model. J Gen Physiol. 1991;98:751–770. doi: 10.1085/jgp.98.4.751. [DOI] [PMC free article] [PubMed] [Google Scholar]
- Clements JD. Variance-mean analysis: a simple and reliable approach for investigating synaptic transmission and modulation. J Neurosci Methods. 2003;130:115–125. doi: 10.1016/j.jneumeth.2003.09.019. [DOI] [PubMed] [Google Scholar]
- Diamond JS, Bergles DE, Jahr CE. Glutamate release monitored with astrocyte transporter currents during LTP. Neuron. 1998;21:425–433. doi: 10.1016/s0896-6273(00)80551-6. [DOI] [PubMed] [Google Scholar]
- Dolphin AC. G protein modulation of voltage-gated calcium channels. Pharmacol Rev. 2003;55:607–627. doi: 10.1124/pr.55.4.3. [DOI] [PubMed] [Google Scholar]
- Enoki R, Hu YL, Hamilton D, Fine A. Expression of long-term plasticity at individual synapses in hippocampus is graded, bidirectional, and mainly presynaptic: optical quantal analysis. Neuron. 2009;62:242–253. doi: 10.1016/j.neuron.2009.02.026. [DOI] [PubMed] [Google Scholar]
- Fedchyshyn MJ, Wang LY. Developmental transformation of the release modality at the calyx of Held synapse. J Neurosci. 2005;25:4131–4140. doi: 10.1523/JNEUROSCI.0350-05.2005. [DOI] [PMC free article] [PubMed] [Google Scholar]
- Haydon PG, Henderson E, Stanley EF. Localization of individual calcium channels at the release face of a presynaptic nerve terminal. Neuron. 1994;13:1275–1280. doi: 10.1016/0896-6273(94)90414-6. [DOI] [PubMed] [Google Scholar]
- Heuser JE, Reese TS, Landis DM. Functional changes in frog neuromuscular junctions studied with freeze-fracture. J Neurocytol. 1974;3:109–131. doi: 10.1007/BF01111936. [DOI] [PubMed] [Google Scholar]
- Hjelmstad GO, Nicoll RA, Malenka RC. Synaptic refractory period provides a measure of probability of release in the hippocampus. Neuron. 1997;19:1309–1318. doi: 10.1016/s0896-6273(00)80421-3. [DOI] [PubMed] [Google Scholar]
- Holderith N, Lorincz A, Katona G, Rózsa B, Kulik A, Watanabe M, Nusser Z. Release probability of hippocampal glutamatergic terminals scales with the size of the active zone. Nat Neurosci. 2012;15:988–997. doi: 10.1038/nn.3137. [DOI] [PMC free article] [PubMed] [Google Scholar]
- Hsia AY, Malenka RC, Nicoll RA. Development of excitatory circuitry in the hippocampus. J Neurophysiol. 1998;79:2013–2024. doi: 10.1152/jn.1998.79.4.2013. [DOI] [PubMed] [Google Scholar]
- Hsu SF, Augustine GJ, Jackson MB. Adaptation of Ca(2+)-triggered exocytosis in presynaptic terminals. Neuron. 1996;17:501–512. doi: 10.1016/s0896-6273(00)80182-8. [DOI] [PubMed] [Google Scholar]
- Isaacson JS, Walmsley B. Counting quanta: direct measurements of transmitter release at a central synapse. Neuron. 1995;15:875–884. doi: 10.1016/0896-6273(95)90178-7. [DOI] [PubMed] [Google Scholar]
- Kaeser PS, Deng L, Wang Y, Dulubova I, Liu X, Rizo J, Südhof TC. RIM proteins tether Ca(2+) channels to presynaptic active zones via a direct PDZ-domain interaction. Cell. 2011;144:282–295. doi: 10.1016/j.cell.2010.12.029. [DOI] [PMC free article] [PubMed] [Google Scholar]
- Katz B, Miledi R. Further study of the role of calcium in synaptic transmission. J Physiol. 1970;207:789–801. doi: 10.1113/jphysiol.1970.sp009095. [DOI] [PMC free article] [PubMed] [Google Scholar]
- Kerr RA, Bartol TM, Kaminsky B, Dittrich M, Chang JC, Baden SB, Sejnowski TJ, Stiles JR. Fast Monte Carlo simulation methods for biological reaction-diffusion systems in solution and on surfaces. SIAM J Sci Comput. 2008;30:3126. doi: 10.1137/070692017. [DOI] [PMC free article] [PubMed] [Google Scholar]
- Klingauf J, Neher E. Modeling buffered Ca2+ diffusion near the membrane: implications for secretion in neuroendocrine cells. Biophys J. 1997;72:674–690. doi: 10.1016/s0006-3495(97)78704-6. [DOI] [PMC free article] [PubMed] [Google Scholar]
- Lansman JB, Hess P, Tsien RW. Blockade of current through single calcium channels by Cd2+, Mg2+, and Ca2+. Voltage and concentration dependence of calcium entry into the pore. J Gen Physiol. 1986;88:321–347. doi: 10.1085/jgp.88.3.321. [DOI] [PMC free article] [PubMed] [Google Scholar]
- Li L, Bischofberger J, Jonas P. Differential gating and recruitment of P/Q-, N-, and R-type Ca2+ channels in hippocampal mossy fiber boutons. J Neurosci. 2007;27:13420–13429. doi: 10.1523/JNEUROSCI.1709-07.2007. [DOI] [PMC free article] [PubMed] [Google Scholar]
- Luo F, Dittrich M, Stiles JR, Meriney SD. Single-pixel optical fluctuation analysis of calcium channel function in active zones of motor nerve terminals. J Neurosci. 2011;31:11268–11281. doi: 10.1523/JNEUROSCI.1394-11.2011. [DOI] [PMC free article] [PubMed] [Google Scholar]
- McCleskey EW, Fox AP, Feldman DH, Cruz LJ, Olivera BM, Tsien RW, Yoshikami D. Omega-conotoxin: direct and persistent blockade of specific types of calcium channels in neurons but not muscle. Proc Natl Acad Sci U S A. 1987;84:4327–4331. doi: 10.1073/pnas.84.12.4327. [DOI] [PMC free article] [PubMed] [Google Scholar]
- Meinrenken CJ, Borst JG, Sakmann B. Calcium secretion coupling at calyx of held governed by nonuniform channel-vesicle topography. J Neurosci. 2002;22:1648–1667. doi: 10.1523/JNEUROSCI.22-05-01648.2002. [DOI] [PMC free article] [PubMed] [Google Scholar]
- Murthy VN, Sejnowski TJ, Stevens CF. Heterogeneous release properties of visualized individual hippocampal synapses. Neuron. 1997;18:599–612. doi: 10.1016/s0896-6273(00)80301-3. [DOI] [PubMed] [Google Scholar]
- Nadkarni S, Bartol TM, Sejnowski TJ, Levine H. Modelling vesicular release at hippocampal synapses. PLoS Comput Biol. 2010;6:e1000983. doi: 10.1371/journal.pcbi.1000983. [DOI] [PMC free article] [PubMed] [Google Scholar]
- Nadkarni S, Bartol TM, Stevens CF, Sejnowski TJ, Levine H. Short-term plasticity constrains spatial organization of a hippocampal presynaptic terminal. Proc Natl Acad Sci U S A. 2012;109:14657–14662. doi: 10.1073/pnas.1211971109. [DOI] [PMC free article] [PubMed] [Google Scholar]
- Neher E. Usefulness and limitations of linear approximations to the understanding of Ca++ signals. Cell Calcium. 1998;24:345–357. doi: 10.1016/s0143-4160(98)90058-6. [DOI] [PubMed] [Google Scholar]
- O'Connor DH, Wittenberg GM, Wang SS. Timing and contributions of pre-synaptic and post-synaptic parameter changes during unitary plasticity events at CA3-CA1 synapses. Synapse. 2007;61:664–678. doi: 10.1002/syn.20403. [DOI] [PubMed] [Google Scholar]
- Oertner TG, Sabatini BL, Nimchinsky EA, Svoboda K. Facilitation at single synapses probed with optical quantal analysis. Nat Neurosci. 2002;5:657–664. doi: 10.1038/nn867. [DOI] [PubMed] [Google Scholar]
- Pumplin DW, Reese TS, Llinás R. Are the presynaptic membrane particles the calcium channels? Proc Natl Acad Sci U S A. 1981;78:7210–7213. doi: 10.1073/pnas.78.11.7210. [DOI] [PMC free article] [PubMed] [Google Scholar]
- Quastel DM. The binomial model in fluctuation analysis of quantal neurotransmitter release. Biophys J. 1997;72:728–753. doi: 10.1016/s0006-3495(97)78709-5. [DOI] [PMC free article] [PubMed] [Google Scholar]
- Reid CA, Bekkers JM, Clements JD. N- and P/Q-type Ca2+ channels mediate transmitter release with a similar cooperativity at rat hippocampal autapses. J Neurosci. 1998;18:2849–2855. doi: 10.1523/JNEUROSCI.18-08-02849.1998. [DOI] [PMC free article] [PubMed] [Google Scholar]
- Sabatini BL, Regehr WG. Timing of neurotransmission at fast synapses in the mammalian brain. Nature. 1996;384:170–172. doi: 10.1038/384170a0. [DOI] [PubMed] [Google Scholar]
- Saviane C, Silver RA. Estimation of quantal parameters with multiple-probability fluctuation analysis. Methods Mol Biol. 2007;403:303–317. doi: 10.1007/978-1-59745-529-9_19. [DOI] [PMC free article] [PubMed] [Google Scholar]
- Schikorski T, Stevens CF. Quantitative ultrastructural analysis of hippocampal excitatory synapses. J Neurosci. 1997;17:5858–5867. doi: 10.1523/JNEUROSCI.17-15-05858.1997. [DOI] [PMC free article] [PubMed] [Google Scholar]
- Schneggenburger R, Neher E. Intracellular calcium dependence of transmitter release rates at a fast central synapse. Nature. 2000;406:889–893. doi: 10.1038/35022702. [DOI] [PubMed] [Google Scholar]
- Scimemi A, Tian H, Diamond JS. Neuronal transporters regulate glutamate clearance, NMDA receptor activation, and synaptic plasticity in the hippocampus. J Neurosci. 2009;29:14581–14595. doi: 10.1523/JNEUROSCI.4845-09.2009. [DOI] [PMC free article] [PubMed] [Google Scholar]
- Shahrezaei V, Cao A, Delaney KR. Ca2+ from one or two channels controls fusion of a single vesicle at the frog neuromuscular junction. J Neurosci. 2006;26:13240–13249. doi: 10.1523/JNEUROSCI.1418-06.2006. [DOI] [PMC free article] [PubMed] [Google Scholar]
- Shepherd GM, Raastad M, Andersen P. General and variable features of varicosity spacing along unmyelinated axons in the hippocampus and cerebellum. Proc Natl Acad Sci U S A. 2002;99:6340–6345. doi: 10.1073/pnas.052151299. [DOI] [PMC free article] [PubMed] [Google Scholar]
- Silver RA. Estimation of nonuniform quantal parameters with multiple-probability fluctuation analysis: theory, application and limitations. J Neurosci Methods. 2003;130:127–141. doi: 10.1016/j.jneumeth.2003.09.030. [DOI] [PubMed] [Google Scholar]
- Silver RA, Momiyama A, Cull-Candy SG. Locus of frequency-dependent depression identified with multiple-probability fluctuation analysis at rat climbing fibre-Purkinje cell synapses. J Physiol. 1998;510:881–902. doi: 10.1111/j.1469-7793.1998.881bj.x. [DOI] [PMC free article] [PubMed] [Google Scholar]
- Stanley EF. Single calcium channels and acetylcholine release at a presynaptic nerve terminal. Neuron. 1993;11:1007–1011. doi: 10.1016/0896-6273(93)90214-c. [DOI] [PubMed] [Google Scholar]
- Stevens CF, Wang Y. Facilitation and depression at single central synapses. Neuron. 1995;14:795–802. doi: 10.1016/0896-6273(95)90223-6. [DOI] [PubMed] [Google Scholar]
- Stricker C, Cowan AI, Field AC, Redman SJ. Analysis of NMDA-independent long-term potentiation induced at CA3-CA1 synapses in rat hippocampus in vitro. J Physiol. 1999;520:513–525. doi: 10.1111/j.1469-7793.1999.00513.x. [DOI] [PMC free article] [PubMed] [Google Scholar]
- Striegel AR, Biela LM, Evans CS, Wang Z, Delehoy JB, Sutton RB, Chapman ER, Reist NE. Calcium binding by synaptotagmin's C2A domain is an essential element of the electrostatic switch that triggers synchronous synaptic transmission. J Neurosci. 2012;32:1253–1260. doi: 10.1523/JNEUROSCI.4652-11.2012. [DOI] [PMC free article] [PubMed] [Google Scholar]
- Takahashi T, Momiyama A. Different types of calcium channels mediate central synaptic transmission. Nature. 1993;366:156–158. doi: 10.1038/366156a0. [DOI] [PubMed] [Google Scholar]
- von Gersdorff H, Matthews G. Dynamics of synaptic vesicle fusion and membrane retrieval in synaptic terminals. Nature. 1994;367:735–739. doi: 10.1038/367735a0. [DOI] [PubMed] [Google Scholar]
- Wadel K, Neher E, Sakaba T. The coupling between synaptic vesicles and Ca2+ channels determines fast neurotransmitter release. Neuron. 2007;53:563–575. doi: 10.1016/j.neuron.2007.01.021. [DOI] [PubMed] [Google Scholar]
- Walmsley B, Edwards FR, Tracey DJ. The probabilistic nature of synaptic transmission at a mammalian excitatory central synapse. J Neurosci. 1987;7:1037–1046. doi: 10.1523/JNEUROSCI.07-04-01037.1987. [DOI] [PMC free article] [PubMed] [Google Scholar]
- Wang X, Treistman SN, Lemos JR. Two types of high-threshold calcium currents inhibited by omega-conotoxin in nerve terminals of rat neurohypophysis. J Physiol. 1992;445:181–199. doi: 10.1113/jphysiol.1992.sp018919. [DOI] [PMC free article] [PubMed] [Google Scholar]
- Weber AM, Wong FK, Tufford AR, Schlichter LC, Matveev V, Stanley EF. N-type Ca2+ channels carry the largest current: implications for nanodomains and transmitter release. Nat Neurosci. 2010;13:1348–1350. doi: 10.1038/nn.2657. [DOI] [PubMed] [Google Scholar]
- Weiss JN. The Hill equation revisited: uses and misuses. FASEB J. 1997;11:835–841. [PubMed] [Google Scholar]
- Wheeler DB, Randall A, Tsien RW. Roles of N-type and Q-type Ca2+ channels in supporting hippocampal synaptic transmission. Science. 1994;264:107–111. doi: 10.1126/science.7832825. [DOI] [PubMed] [Google Scholar]
- Wu LG, Saggau P. Pharmacological identification of two types of presynaptic voltage-dependent calcium channels at CA3-CA1 synapses of the hippocampus. J Neurosci. 1994;14:5613–5622. doi: 10.1523/JNEUROSCI.14-09-05613.1994. [DOI] [PMC free article] [PubMed] [Google Scholar]
- Zucker RS, Regehr WG. Short-term synaptic plasticity. Annu Rev Physiol. 2002;64:355–405. doi: 10.1146/annurev.physiol.64.092501.114547. [DOI] [PubMed] [Google Scholar]