


Abstract
We recently reported that a guanosine-rich 40-mer DNA aptamer (LJM-3064) mediates remyelination in the Theiler’s murine encephalomyelitis virus mouse model of multiple sclerosis. Here, we characterize the G-quadruplex forms of this aptamer in vitro, and demonstrate using circular dichroism spectroscopy that LJM-3064 undergoes a monovalent ion-dependent conformational switch. In the presence of sodium ions and no potassium ions, LJM-3064 adopts an antiparallel-stranded G-quadruplex structure. When presented with low concentrations of potassium ions in a buffer that mimics the composition of interstitial fluid and blood plasma, LJM-3064 rapidly switches to a parallel-stranded G-quadruplex conformation, which is presumably the physiologically active folded form. We characterize these conformational states using dimethyl sulfate reactivity studies and Bal 31 nuclease probing. Our analysis indicates that only the 5′-terminal 26 nucleotides are involved in G-quadruplex formation. Thermodynamic characterization of LJM-3064 at physiologically relevant ion concentrations reveals the G-quadruplex to be metastable at human body temperature. These data provide important structural and thermodynamic insights that may be valuable in optimizing LJM-3064 as a therapeutic remyelinating agent.
INTRODUCTION
We recently reported that a single-stranded DNA aptamer (LJM-3064) selected for affinity to crude murine myelin induces remyelination after intraperitoneal injection in the Theiler’s murine encephalomyelitis virus (TMEV) model of multiple sclerosis (1). Southwestern blot analysis indicates that the selected aptamer binds myelin basic protein, proteolipid protein and myelin oligodendrocyte glycoprotein, all of which have been described as model autoimmune antigens in demyelinating disease (2–4). We are interested in characterizing the biophysical properties of LJM-3064 as such information could help to elucidate the structure and mode of action of this DNA aptamer in vivo.
Interestingly, LJM-3064 contains five stretches of at least three contiguous deoxyguanosine residues (Figure 1A), suggesting the aptamer could adopt one or more intramolecular (Figure 1B) or intermolecular guanine quadruplex (G-quadruplex) conformations. G-quadruplexes owe their structure to the formation of G-quartets involving guanine organization into near-planar hydrogen bonded arrangements between Hoogsteen and Watson-Crick faces of guanines in four adjacent strands. If a single sequence contains at least four stretches of contiguous guanines, intrastrand G-quadruplex formation is possible. Glycosidic bonds in antiparallel G-quadruplexes are reported to preferentially adopt a 5′-syn-anti-syn-anti-3′ conformation (5). The surprising thermodynamic stability of G-quadruplex structures likely results from the stabilizing role of dehydrated metal ions (e.g. potassium) coordinating guanine O6 oxygens (6).
Figure 1.

Sequence and possible G-quadruplex conformations of aptamer LJM-3064. (A) LJM-3064 sequence. (B) Schematic representations of the LJM-3064 sequence representing the six most common G-quadruplex motifs, using the four G-tracts nearest the 5′-terminus for formation of the core G-quadruplex structure (6). Conformations are as follows: all parallel double chain reversal loops (I), all lateral (antiparallel) loops (II), lateral, lateral, double chain reversal loops (III), double chain reversal, lateral, lateral loops (IV), lateral, diagonal, lateral loops (V) and diagonal, double chain reversal, diagonal loops (VI).
G-quadruplex motifs are not uncommon in DNA aptamers resulting from in vitro selection. Examples include the thrombin-binding aptamer d(G2T2G2TGTG2T2G2) (7), the adenosine- and ATP-binding aptamers (8), the insulin-binding aptamer d(G2TG2TG8T2G2T-AG3TGTCT2C) (9), the HIV-RNase H-binding aptamer d(GCTG2TCTCTGCG3T2GT2GCGC2GCG2CAC3T2G2CA) (10), the HIV-integrase-binding aptamer d(G3TG3TG3TG3T) (11), the 8-OH-dG-binding aptamer d(GCG3CGATCG2CG6TGCGTGCGCTCTGTGC2AG5TG2GACAGAT-CATATG5TGCT) (12), the anionic porphyrin-binding aptamer d(GTGTCGA2GATCGTG3TCAT2GTG3TG3TGTG2CTG2TC-CGATC2GCGATCTGCTGACGCTG2T2AG2T) (13) and ethanolamine-binding DNA aptamers (14). G-quadruplex formation may provide a general mechanism for conformational stability in presenting functional structures selected in vitro.
Besides G-rich sequences resulting from in vitro selections, guanosine-rich sequences are found at eukaryotic telomeres (15–17), and there has been growing interest in the possibility that guanosine-rich sequences within chromosomes might unpair and reorganize as intramolecular G-quadruplexes with extrusion of an unpaired cytosine-rich strand. Potential sequences of this kind are found in both oncogene promoter regions and telomere repeats (18–25). c-MYC, VEGF, HIF-1α, RET, KRAS, c-kit and Bcl-2 oncogenes have all been reported to contain sequences of the form G3N1-3G3N2-9G3N1G3, where ‘N’ indicates a potential intervening loop sequence between the guanine homopolymer stretches contributing to a core quartet structure (26–37). If they actually form in vivo, such structures have the potential to serve as drug targets.
Circular dichroism (CD) spectroscopy is a particularly powerful method for monitoring quadruplex formation and can provide remarkable information about the relative orientation of guanine homopolymer tracts. G-quadruplexes in which the strand orientation is the same for all stretches of contiguous guanines are termed parallel G-quadruplexes, and have characteristic CD ellipticity maxima at 260 nm and minima at 240 nm; antiparallel quadruplex structures contain adjacent guanine homopolymer tracts with opposite backbone polarities, and have characteristic CD signatures with ellipticity maxima at 290 nm and minima at 260 nm (38–40). Hybrid quadruplex structures are also reported, displaying a mixture of parallel and antiparallel CD characteristics. In the presence of 150 mM K+ ions, the human telomeric repeat sequence AG3(T2AG3)3 adopts a lateral, double chain reversal, lateral loop morphology containing two sets of adjacent strands with opposite directionalities (41,42). The modified telomeric sequence G3(T2AG3)4, however, is believed to form a hybrid structure with lateral, diagonal, double chain reversal loop morphology containing three parallel strands and one antiparallel strand, and shows a bifurcated peak in the presence of K+, with ellipticity maxima at 260 and 290 nm and a minimum at 240 nm (42). Thus, CD is a valuable tool for assessing relative strand orientations in G-quadruplex structures.
Analysis of the 96 G-quadruplex structures deposited in the protein databank by 2008 shows that although each could theoretically adopt any of 26 possible folds with conventional loop arrangements, the majority of observed folds are similar and fall into just six categories (6). These six common motifs include: all parallel double chain reversal loops (43), all lateral (antiparallel) loops (44), lateral, lateral, double chain reversal loops (45), double chain reversal, lateral, lateral loops (46), lateral, diagonal, lateral loops (47) and diagonal, double chain reversal, diagonal loops (48). Nonetheless, confident prediction of conformation for novel G-quadruplexes is difficult (49,50) as further exemplified by crystal and nuclear magnetic resonance structures of guanosine-rich sequences from one strand of the c-kit promoter (33,35,51).
Here, we report spectroscopic, chemical and biochemical evidence showing that the physiologically active fold of the LJM-3064 myelin-binding aptamer is a G-quadruplex. We further explore the six most likely motifs (Figure 1B), and suggest the most likely structure. LJM-3064 was originally identified through the process of selective evolution of ligands by exponential enrichment with low concentrations of G-quadruplex stabilizing cations (10 mM Na+ and 0.5 mM K+). In vitro folding of LJM-3064 for animal remyelination experiments using the TMEV model involved high levels of sodium ions, low levels of magnesium ions and no potassium ions (150 mM Na+, 1 mM Mg2+). In contrast, both sodium (∼150 mM) and potassium (∼5 mM) ions are present in serum (52). Therefore, it is of great interest to understand both the folded structure of LJM-3064 and how that structure depends on ionic conditions.
We show that LJM-3064 is capable of an ion-dependent conformational switch. Ionic conditions used for LJM-3064 in vitro selection and in vitro folding both stabilize intramolecular G-quartet structures with antiparallel CD signatures. In contrast, when presented with ionic conditions simulating blood plasma, LJM-3064 undergoes a conformational switch to an intramolecular parallel-stranded G-quartet structure, presumably its physiologically active form. We also use dimethylsulfate (DMS) chemical reactivity to map the N7 protection from methylation of guanine nucleotides involved in the core quartet structure, and Bal 31 nuclease footprinting to identify looped and unstructured regions. These data comprise the first biophysical characterization of the remyelinating DNA aptamer LJM-3064, a novel oligonucleotide with important therapeutic potential.
MATERIALS AND METHODS
Oligonucleotides
DNA oligonucleotide LJM-3064b was ordered from TriLink Biotechnologies. Synthesis was done DMT-off at 1 µmol scale using a 3′ biotin-TEG control pore glass support. The oligonucleotide was cleaved from the support and deprotected in hot ammonia, then dried and purified by reverse phase high pressure (or high performance) liquid chromatography. Oligonucleotides LJM-3064f/b and (dT)40 were ordered from Integrated DNA Technologies. Synthesis was done DMT-off at 250 nmol scale using a 3′ biotin-TEG control glass support, and with incorporation of fluorescein at the 5′ terminus of the molecule. The oligonucleotide was cleaved from the support and deprotected in hot ammonia and purified by standard desalting. Oligonucleotides were resuspended in water and concentrations were determined at 260 nm using nearest neighbor molar extinction coefficients as described earlier (53).
Native G-quadruplex gel mobility analysis
Aptamer folding was accomplished by heating at 90°C for 5 min at 4 μM concentration in buffers that contained 10 mM phosphate at pH 7.4 with 12.5 mM of either LiCl, NaCl, KCl or RbCl and then snap cooling on ice. Folded samples, (dT)40 oligonucleotide and a 10-bp ladder were run on native 12% polyacrylamide gels (29:1 bis:acrylamide) in 0.5× Tris-borate EDTA (TBE) with the same alkali chloride salts as used in the aptamer folding supplemented with 12.5 mM concentration in the gel and in the running buffer. Gels were run for 4 h at 4.3 V/cm with gel temperature not exceeding 25°C. DNA bands were post-stained with SYBR green I dye in 0.5× TBE and then imaged using a Typhoon fluorescence imaging system and FAM filter configuration.
Band migration distances (pixels) were measured in ImageJ, and together with the total electrophoresis time, were used to calculate band migration velocity (cm/s). Division of this value by the applied voltage in V/cm yielded band mobility values in cm2/(V-s). This quantitation was done for the major aptamer bands on each gel and for the 40-bp marker. Subtraction of the 40-bp marker mobility or the mobility of the (dT)40 oligonucleotide from the mobility value of the aptamer gave the relative mobility quantity Δμ.
DMS probing
DMS reactivity was assessed similarly to the method described by Maxam and Gilbert (54). Oligonucleotide LJM-3064f/b was folded at 4.0 μM concentration in buffer containing 10 mM sodium cacodylate (pH 7.3) supplemented with either 100 mM NaCl or 100 mM KCl. A urea-denatured sample was also prepared with 4.0 μM aptamer in 8 M urea. In total, 6 μl of sheared salmon testes DNA (16 mg/ml) was added to 310 μl of each of the three solutions along with 3 μl of DMS. Reactions were allowed to proceed for 5 min at room temperature, and then quenched with 300 μl of a solution consisting of 1.0 M β-mercaptoethanol, 1.0 M Tris-acetate (pH 7.5), 1.5 M NaOAc, 0.05 M Mg(OAc)2 and 1 mM EDTA. Three microliters of tRNA (10 mg/ml) were added, and DNAs were precipitated by the addition of 2.5 volumes of ethanol, chilling on dry ice for 15 min and then spinning at 13 000 g for 15 min. Pellets were washed with 250 μl cold 70% ethanol and then air-dried. DNAs were resuspended in 20 μl buffer consisting of 10 mM phosphate (pH 7.0) and 1 mM EDTA, and heated at 90°C for 15 min. Two microliters of 1.0 M NaOH were added and samples were heated at 90°C for 30 min. Precipitation of DNA fragments was facilitated by the addition of 50 μl of glycogen (5 mg/ml) and 2.5 volumes of ethanol, chilling on dry ice for 15 min and centrifugation at 13 000g for 15 min. Pellets were allowed to air dry and then resuspended in 5 μl of H2O. DNAs were denatured by the addition of 15 µl of deionized formamide and heating at 90°C for 10 min. Samples were loaded onto a 16% denaturing polyacrylamide gel (19:1 bis:acrylamide) followed by electrophoresis at 26 V/cm for 3 h 40 min. Gels were imaged with a Typhoon fluorescence imaging system using the FAM filter configuration.
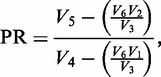
Quantitation of integrated band intensities was done in ImageQuant, using a rubber band baseline method. Calculation of protection ratio (PR) was done in Excel using the following expression:
 |
(1) |
where  is the unreacted oligonucleotide band intensity in the native condition,
  is the unreacted oligonucleotide band intensity in the denatured condition,
  is the unreacted oligonucleotide band intensity in the (-DMS) condition,
  is the degradation product band intensity in the native condition,
  is the degradation product band intensity in the denatured condition and
  is the degradation product band intensity in the (-DMS) condition.
Nuclease probing
Oligonucleotide LJM-3064f/b was folded at 7.6 μM concentration in buffer containing 10 mM sodium cacodylate (pH 7.3) supplemented with either 100 mM NaCl or 100 mM KCl. CaCl2 and MgCl2 were then added to 4 mM concentration. In total, 1 μl Bal 31 nuclease (New England BioLabs) was added to 9 μl of folded aptamer solution. Nuclease reactions were allowed to proceed for 1, 10 or 30 min at 30°C and then were terminated by the addition of 2 μl of 500 mM ethylenediaminetetraacetic acid (EDTA). Quenched reactions were mixed with 81 μl H2O, 9 μl of 3 M NaOAc (pH 5.2), 2 μl of sonicated salmon testes DNA carrier (16 mg/ml) and 1 µl of tRNA (10 mg/ml). DNAs were precipitated by the addition of 2.5 volumes of 100% ethanol, chilling on dry ice for 15 min and centrifugation at 13 000 g for 15 min. Pellets were washed with 250 µl of cold 70% ethanol. Residual ethanol was allowed to evaporate and then the pellets were resuspended in 5 μl of H2O. DNAs were denatured by the addition of 15 µl deionized formamide and heating at 90°C for 10 min. Samples were loaded onto a 16% denaturing polyacrylamide gel (19:1 bis:acrylamide) followed by electrophoresis at 26 V/cm for 3 h 40 min. Fluorescence of 5′-fluorescein-labeled bands was imaged with a Typhoon fluorescence imaging system using the FAM filter configuration.
RESULTS AND DISCUSSION
Unique stabilizing role of potassium ions
Because of its profound guanosine-rich sequence with five segments, each containing at least three consecutive guanosine bases (Figure 1A), we wished to determine if LJM-3064 forms one or more G-quadruplex structures and if such structures involve intramolecular folding. A distinguishing feature of G-quadruplex structures is the differential stabilizing roles of monovalent alkali cations. K+ is experimentally observed to be the most effective monovalent alkali cation stabilizer of G-quadruplex structures because its dehydrated size is uniquely suitable for coordination of eight O6 atoms between two tetrad planes of a G-quadruplex; Na+, Rb+ and Li+ have comparatively reduced abilities to stabilize guanine quadruplexes (55–57). In light of this observation, we conducted native polyacrylamide gel electrophoresis experiments at 25°C to study LJM-3064 mobility in the presence of Li+, Na+, K+ or Rb+ ions to verify that K+ is a unique stabilizer of a compact structure corresponding to quadruplex formation. Folding of LJM-3064 before gel electrophoresis was done in buffer containing the same concentration of alkali chloride salt included in the gel. In our analysis, we corrected for differences in mobility that arise from the ionic conductivity value dissimilarities of these four salts by comparing the mobility of the aptamer species to duplex control DNAs and a (dT)40 oligonucleotide run on each gel. Δμ was calculated by the subtraction of the mobility of the respective reference markers from the mobility measured for the aptamer species. As shown in Figure 2, LJM-3064 cleanly folds into a single species under these conditions, with the aptamer mobility in each case being slightly greater than that measured for the (dT)40 oligonucleotide, a molecule containing the same number of bases and having the same number of charged phosphates as LJM-3064, indicating that folding is intramolecular. Mobility quantitation of gel bands indicates that at equal concentrations of cations, that the magnitude of LJM-3064 relative mobility differences with respect to controls follows the order K+>Na+>Rb+>Li+ (Figure 2; Supplementary Table S1). We interpret these observed differences in aptamer mobility to reflect the differing intrinsic abilities of these four monovalent cations to stabilize compact intramolecular G-quartet structures, with K+ demonstrating the strongest stabilizing ability among the series of monovalent alkali cations used (20).
Figure 2.
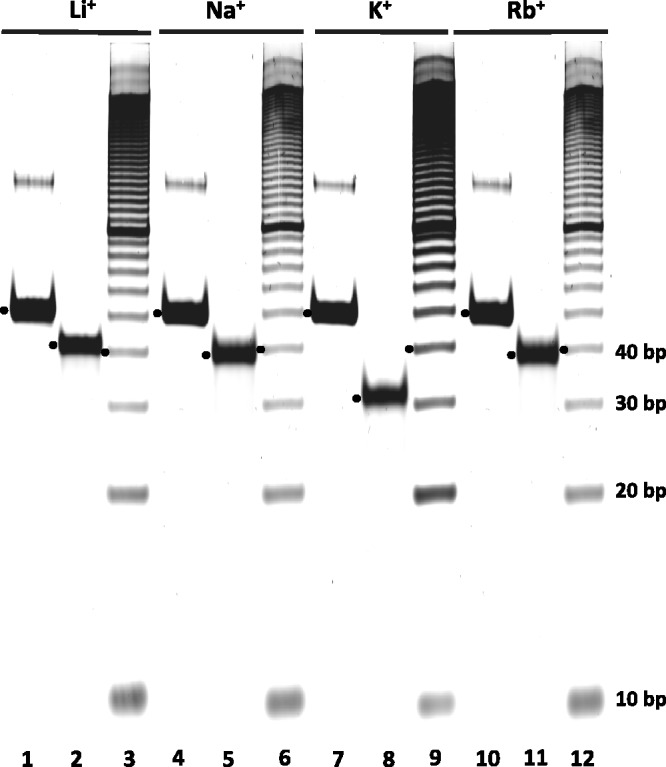
Native intramolecular G-quadruplex electrophoretic gel analysis at 25°C of LJM-3064 folded in the presence of different alkali chloride salts at 12.5 mM concentration. Lanes 1, 4, 7 and 10 contain (dT)40 oligonucleotide. Lanes 2, 5, 8 and 11 contain LJM-3064. Lanes 3, 6, 9 and 12 contain a 10-bp duplex DNA ladder. Black dots indicate the cases used for quantitation of mobility.
To further characterize the intramolecular folded structures stabilized by Li+, Na+, K+ and Rb+, we collected CD spectra of LJM-3064 at 20°C in 12.5 mM, 50 mM and 200 mM of LiCl, NaCl, KCl and RbCl (Figure 3A–C). We also collected CD spectra of LJM-3064 in the presence of ion concentrations similar to those used for its in vitro selection (10 mM Na+, 0.5 mM K+), in vitro folding prior to testing in the animal model (160 mM Na+) and under conditions that mimic the monovalent ion concentrations of blood plasma and interstitial fluid (150 mM Na+, 4.7 mM K+) (Figure 3D) (52). Sample preparation and experimental configuration are described in Supplementary Methods. Our findings indicate that even low concentrations of K+ strongly stabilize a G-quadruplex structure with an ellipticity maximum at 260 nm and a minimum at 240 nm: a well-defined CD signature that is characteristic of parallel-stranded G-quadruplexes. Similarly to K+, Rb+ was also seen to stabilize a parallel stranded G-quadruplex, although higher cation concentrations were required to stabilize the structure (Figure 3A and B). Na+, which induced the second greatest mobility difference in the native gel electrophoresis experiments, induced a contrasting structure with definitive antiparallel CD characteristics such as an ellipticity maximum at 290 nm and minimum at 260 nm. Interestingly, increasing the Na+ concentration beyond 160 mM resulted in a structural rearrangement of the G-quadruplex (Figure 3C and D), with the appearance at 200 mM Na+ of split ellipticity maxima at 260 and 290 nm and a minimum at 240 nm, indicative of a mixed parallel/antiparallel hybrid structure (41,42). Li+ at concentrations between 12.5 and 200 mM was also seen to stabilize a G-quadruplex with mixed parallel/antiparallel characteristics, showing bifurcated ellipticity maxima at 260 and 290 nm and a minimum at 240 nm. Ionic concentrations that mimic the conditions of the in vitro selection of LJM-3064 (10 mM Na+, 0.5 mM K+), and also the in vitro folding of LJM-3064 prior to testing in the animal model (160 mM Na+) stabilized G-quadruplex structures with antiparallel strand arrangements (Figure 3D), showing a characteristic maximum at 290 nm and a minimum at 260 nm. Remarkably, under monovalent cationic conditions that mimic the ionic composition of interstitial fluid and blood plasma (150 mM Na+, 4.7 mM K+), LJM-3064 forms a parallel-stranded quadruplex with a CD signature comparable to when K+ is the only monovalent cation present (Figure 3D). We interpret this result to indicate that K+ is the dominant cation involved in the G-quadruplex folding of LJM-3064. Even when Na+ concentration exceeds K+ by a factor of 30, K+ occupies specific binding sites that stabilize the parallel-stranded G-quadruplex structure. This finding also suggests that the aptamer conformation under physiologically relevant conditions is significantly different from the aptamer conformation under the conditions of its in vitro selection and in vitro folding prior to animal studies.
Figure 3.

CD analysis of LJM-3064 conformation at 20°C. (A–C) Representative CD spectra of LJM-3064 folded in the presence of 12.5, 50 or 200 mM monovalent alkali chloride salts (LiCl, NaCl, KCl or RbCl) supplemented into 10 mM phosphate buffer at pH 7.4. (D) CD spectra of LJM-3064 folded in 10 mM phosphate buffer at pH 7.4 supplemented with 160 mM KCl or ion concentrations similar to those used for its in vitro selection (10 mM NaCl, 0.5 mM KCl), in vitro folding prior to testing in the animal model (160 mM NaCl) or ion conditions that mimic the monovalent ion concentrations of blood plasma and interstitial fluid (150 mM NaCl, 4.7 mM KCl).
Thermodynamic stability of G-quadruplex forms
We used thermal denaturation analysis (Figure 4; Supplementary Figures S1–S9) to obtain thermodynamic stability profiles for the G-quadruplexes that are formed under four relevant ionic conditions: (i) those of the in vitro selection (10 mM Na+, 0.5 mM K+), (ii) those of the in vitro folding protocol used prior to animal injections (160 mM Na+), (iii) physiologically relevant conditions (150 mM Na+, 4.7 mM K+) and (iv) a high [K+] condition (160 mM K+). Methods have previously been reported for deriving thermodynamic parameters  and
and  from manipulations of thermal denaturation data obtained by monitoring the CD or ultraviolet absorbance signal at a single wavelength as a function of temperature (47–49). These methods assume that the structural transition between native and denatured states reflects a two-state process and does not involve stable unfolding intermediates (6,58). To verify that the thermal denaturation of the present G-quadruplexes reflects such a transition, we collected CD spectra of LJM-3064 at 10°C increments between 4 and 94°C (Figure 4). These spectra showed no evidence for intermediate G-quadruplex species, validating the use of a single-wavelength approach for deriving thermodynamic data from CD melting curves.
Figure 4.

CD thermal denaturation analysis of LJM-3064 G-quadruplex stability showing scans taken at 10°C intervals between 4 and 94°C (A) Ionic conditions mimicking the conditions of the aptamer in vitro selection (10 mM NaCl, 0.5 mM KCl). Inset shows a representative single-wavelength CD dataset collected at 290 nm reflecting folded aptamer fraction plotted as a function of temperature. (B) Ionic conditions of aptamer in vitro folding prior to animal studies (160 mM NaCl). (C) Ionic conditions that mimic interstitial fluid and blood plasma (150 mM NaCl, 4.7 mM KCl). Inset shows a representative single-wavelength CD dataset collected at 260 nm reflecting folded aptamer fraction plotted as a function of temperature. (D) 160 mM KCl.
We then collected single-wavelength CD thermal denaturation spectra in duplicate for each of the four ionic conditions described earlier, and at reference states of 100 mM Na+ and 100 mM K+, using the wavelength of the spectral maximum at 20°C for data collection (Supplementary Figures S1–S4). CD spectra of the two reference conditions are shown in Supplementary Figure S10. Analysis of thermal melt data was done as described in the Supplementary Methods section. We used the two experimental replicates for each thermal titration to estimate mean CD signal values and standard deviations at each of the 181 temperature data points during the course of a single experiment. We then employed a Monte Carlo method to simulate Gaussian distributions about each individual point in the dataset, with each distribution defined by a temperature-specific experimental mean value and standard deviation. The resulting distributions were then iteratively sampled at random to generate 10 000 hypothetical datasets, each reflecting the measured experimental uncertainty. We then fit each of these datasets to the Van’t Hoff equation to derive thermodynamic parameters  and
and  . Mean fit values are presented in Table 1 along with the standard deviations of the calculated distributions (Supplementary Figures S11 and S12). Normalized overlap coefficients for the calculated distributions of
  and
and  are presented in Supplementary Table S2.
Table 1.
Summary of thermodynamic properties of LJM-3064 and comparison to literature values for telomeric G-quadruplexes
| Sequence (5′–3′) | Ionic conditions | LJM-3064 (μM) | Tm (°C) | ΔH0folding (kcal/mol) | ΔS0folding [cal/(mol•K)] | −TΔS0folding 37°C (kcal/mol) | ΔGfolding 37°C (kcal/mol) | Reference |
|---|---|---|---|---|---|---|---|---|
| LJM-3064 | 100 mM Na+ | 4 | 52.1 ± 0.4 | −45.0 ± 3.5 | −138.5 ± 11.0 | 42.9 ± 3.4 | −2.1 ± 0.2 | — |
| LJM-3064 | 160 mM Na+ | 4 | 55.9 ± 0.4 | −41.1 ± 3.8 | −124.9 ± 11.7 | 38.7 ± 3.6 | −2.3 ± 0.2 | — |
| LJM-3064 | 100 mM K+ | 4 | 72.7 ± 0.3 | −46.2 ± 3.1 | −133.8 ± 9.1 | 41.5 ± 2.8 | −4.8 ± 0.3 | — |
| LJM-3064 | 160 mM K+ | 4 | 77.1 ± 0.3 | −48.3 ± 3.7 | −137.9 ± 10.7 | 42.7 ± 3.3 | −5.5 ± 0.4 | — |
| LJM-3064 | 10 mM Na+ 0.5 mM K+ | 4 | 35.2 ± 0.9 | −41.7 ± 8.6 | −135.1 ± 28.1 | 42.0 ± 8.7 | 0.3 ± 0.1 | — |
| LJM-3064 | 150 mM Na+ 4.7 mM K+ | 4 | 38.7 ± 1.4 | −27.4 ± 2.1 | −88.0 ± 6.7 | 27.3 ± 2.1 | −0.2 ± 0.1 | — |
| LJM-3064 | 150 mM Na+ 4.7 mM K+ | 2 | 38.7 ± 1.1 | −27.3 ± 2.4 | −87.7 ± 7.6 | 27.2 ± 2.3 | −0.2 ± 0.1 | — |
| LJM-3064 | 150 mM Na+ 4.7 mM K+ | 1 | 38.1 ± 1.8 | −28.0 ± 4.9 | −90.0 ± 15.4 | 27.9 ± 4.7 | −0.2 ± 0.1 | — |
| LJM-3064 | 150 mM Na+ 4.7 mM K+ | 0.4 | 39.4 ± 3.3 | −27.1 ± 13 | −86.7 ± 43.0 | 26.8 ± 13 | −0.2 ± 0.1 | — |
| (TTAGGG)4 | 70 mM Na+ | — | 49 | −38.0 | −119 | 36.9 | −1.1 | (60) |
| (TTAGGG)4 | 70 mM K+ | — | 63 | −49.0 | −147 | 45.6 | −3.4 | (60) |
| AGGG(TTAGGG)3 | 100 mM Na+ | — | 56 | −54.0 | −163 | 50.6 | −3.5 | (61) |
| AGGG(TTAGGG)3 | 100 mM K+ | — | 63 | −57.0 | −169 | 52.4 | −4.6 | (61) |
| GGG(TTAGGG)3 | 100 mM Na+ | — | 58 | −51.0 | −155 | 48.1 | −3.0 | (61) |
| GGG(TTAGGG)3 | 100 mM K+ | — | 65 | −60.5 | −179 | 55.5 | −5.0 | (61) |
| TGGG(TTAGGG)3 | 100 mM Na+ | — | 62.8 | −51.4 | −153 | 47.5 | −3.9 | (63) |
| TGGG(TTAGGG)3 | 100 mM K+ | — | 81.8 | −66.2 | −186.5 | 57.8 | −8.4 | (63) |
Although interpretation of fitted thermodynamic parameters is generally complex, with the calculated  and
and  values reflecting changes in macromolecules, water and ions, our data reveal several important features influencing LJM-3064 quadruplex folding and stability. In all cases, a favorable enthalpic driving force for folding, reflecting favorable hydrogen bonding interactions, ion–dipole interactions and formation of new Van der Waal contacts, is counterbalanced by an entropic cost, reflecting a decreased conformational entropy for the polymeric oligonucleotide LJM-3064 as well as ordering of tightly bound cations and water molecules occupying specific binding sites in the folded structure (Table 1; Figure 5). Linking numbers
  and
and  corresponding to the molar uptake or release of counterions during the folding transition in the presence Na+ or K+, respectively, were calculated to be −0.45 mol of Na+/mol LJM-3064 and −0.48 mol of K+/mol LJM-3064. These negative numbers indicate that G-quadruplex formation is accompanied by the uptake of counterions and that only a small difference in the number of ions is observed between K+- and Na+-promoted structures, despite the increased quadruplex-stabilizing properties of K+ (59). This is a very interesting observation, especially in light of the enhanced thermal stability of the K+-stabilized LJM-3064 G-quadruplex compared to the Na+-stabilized structure, with Tm differences >20°C at both 100 and 160 mM ion concentrations; although the numbers of ions taken up in the folding of Na+- and K+-supported quadruplexes are similar, the stabilizing nature of the resulting ionic interactions differ greatly, with K+ by far being the better quadruplex stabilizer. Increased thermal stability of quadruplexes in the presence of K+ relative to Na+ is a phenomenon that is also well documented in the literature for other G-quadruplexs forming within human telomeric sequences (Table 1) (60–63).
Figure 5.

Graphical representation of opposing thermodynamic forces influencing fold stability of guanine quadruplexes formed by LJM-3064 in the presence of different monovalent cations at 37°C.
Importantly, under monovalent ionic conditions that mimic the composition of interstitial fluid or blood plasma (150 mM Na+, 4.7 mM K+), thermal melting analysis indicates that LJM-3064 has a Tm value of 38.7°C, which is very near to human physiological temperature (∼37°C). This information is potentially important for the development of LJM-3064 as a therapeutic agent as it implies that at physiologically relevant temperature, ∼30% of aptamer molecules are denatured. The calculated parameters  and
and  for LJM-3064 in the presence of these ions reveal that both the favorable enthalpic driving force and the unfavorable entropic cost for folding are reduced under this condition compared with other pure ion conditions of similar ionic strength (Figure 5; Table 1). The
  for the folding transition is calculated to be −27.4 ± 2.1 kcal/mol in the presence of 150 mM Na+ and 4.7 mM K+ compared with −41.1 ± 3.8 and −48.3 ± 3.7 kcal/mol in the presence of 160 mM Na+ and 160 mM K+, respectively.
  opposing the folding transition is similarly reduced, being −88.0 ± 6.7 cal mol-1 K-1 in the presence of 150 mM Na+ and 4.7 mM K+, and −124.9 ± 11.7 and −137.9 ± 10.7 cal mol-1 K-1 in the presence of 160 mM Na+ and 160 mM K+, respectively. We interpret these values to reflect that the ionic conditions designed to mimic blood plasma and interstitial fluid promote a more disorderd folded state for LJM-3064 with fewer favorable energetic interactions than the folded states stabilized by pure K+ and Na+ ions at similar ionic strengths. It may thus be desirable to confer upon the aptamer enhanced properties of thermal stability.
We also provide definitive thermodynamic evidence that this physiologically active G-quadruplex fold is intramolecular. Intermolecular G-quadruplexes display concentration-dependent melting temperatures, whereas intramolecular structures do not (59). By performing thermal melt experiments at LJM-3064 concentrations of 4, 2, 1 and 0.4 μM in the presence of 150 mM Na+ and 4.7 mM K+, we verify that the melting temperature of the native G-quadruplex remains constant with respect to aptamer concentration (Table 1; Supplementary Figures S1–S4). Tm values calculated at these aptamer concentrations (38.7 ± 1.4, 38.7 ± 1.1, 38.1 ± 1.8 and 39.4 ± 3.3°C, respectively) do not differ statistically over a 10-fold range in aptamer concentration. As seen in Table 1, values for the calculated parameters  and
and  for each of these aptamer concentrations also agree closely, supporting the robustness of the Monte Carlo thermodynamic fitting regimen used to estimate these parameters.
Structural transition between Na+- and K+-stabilized structures
Because of differences in LJM-3064 CD characteristics in Na+ and K+ solutions (Figure 3), we wished to determine if interconversion of quadruplex forms occurs at physiologically relevant temperatures. Specifically, we wished to determine whether LJM-3064 equilibrated in the presence of 160 mM Na+ would undergo structural rearrangement when exposed to ionic conditions that mimic interstitial fluid and blood plasma (150 mM Na+, 4.7 mM K+). This question is relevant since, in preparation for testing in the TMEV animal model, LJM-3064 was routinely folded in buffer containing 160 mM Na+, and was then introduced to the ionic conditions of the interstitial fluid and blood plasma when injected intraperitoneally into animals. Therefore, we conducted a CD experiment in which LJM-3064 was folded in the presence of 160 mM Na+, followed by the addition of K+ ions to 4.7 mM concentration with the collection of CD spectra at subsequent time points. The results (Figure 6A) indicate that the majority of LJM-3064 aptamer molecules undergo a conformational switch from an antiparallel to a parallel strand arrangement within 5 min after the addition of K+ ions. CD spectra initially display ellipticity maxima at 290 nm and minima at 260 nm, which are characteristic of an antiparallel arrangement. Spectra rapidly convert to a G-quadruplex form with an ellipticity maximum at 260 nm and a minimum at 240 nm, characteristic of a parallel-stranded G-quadruplex. This result is important as it suggests that under physiologically relevant conditions LJM-3064 refolds to a parallel-stranded G-quadruplex form, which, although only thermodynamically metastable, is presumably its physiologically active fold state.
Figure 6.
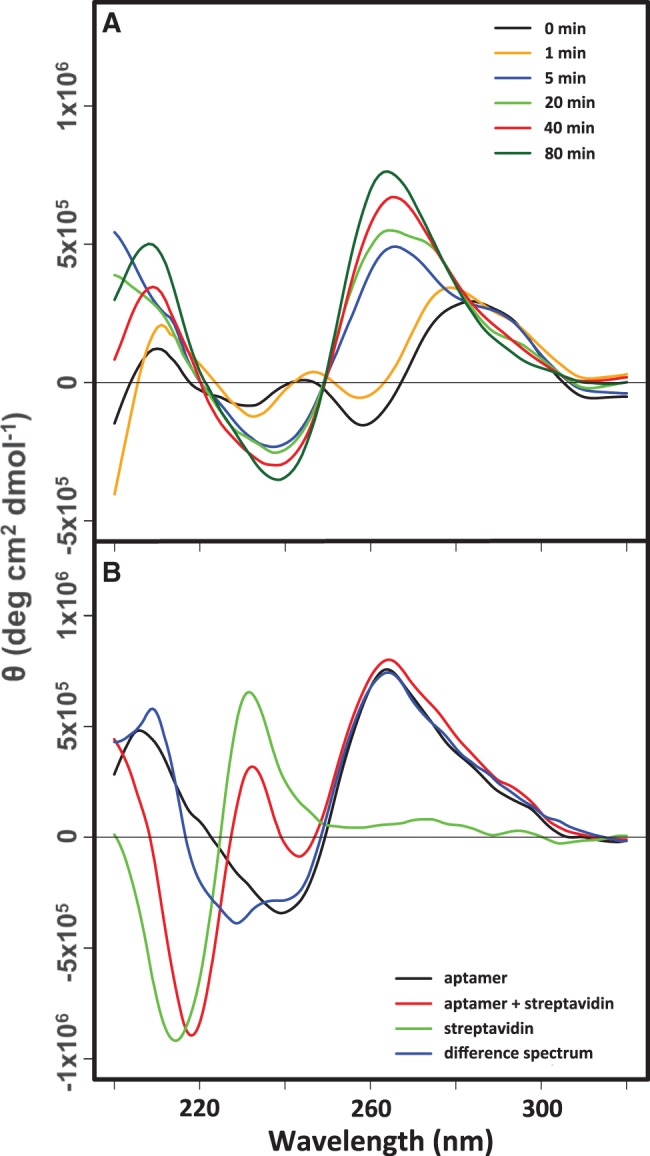
CD analysis of LJM-3064 structural rearrangement and physiological conformation at 20°C. (A) CD wavelength scan timecourse monitoring structural transition between antiparallel and parallel G-quadruplex conformations induced by the addition of 4.7 mM KCl to aptamer folded in 10 mM phosphate buffer at pH 7.4 supplemented with 160 mM NaCl. (B) Spectral analysis of 3′-biotinylated LJM-3064 aptamer–streptavidin tetrameric conjugate.
We also present data indicating that this parallel-stranded G-quadruplex fold is maintained even when 3′-biotinylated LJM-3064 is conjugated with streptavidin to form tetramers (Figure 6B). This manipulation was previously shown to be important for the function of LJM-3064 in promoting remyelination in the TMEV mouse model of multiple sclerosis (1). Streptavidin conjugation may mimic the multivalency of IgM antibodies, some of which have been demonstrated to possess remyelinating properties (64,65). To confirm that the LJM-3064 parallel-stranded G-quadruplex structure is maintained when the aptamer is formulated as a tetrameric 3′-biotinylated conjugate with streptavidin, we collected three sets of CD spectra. In one case, LJM-3064 was folded in the presence of physiologically relevant ion concentrations (150 mM Na+, 4.7 mM K+). In a second case, the aptamer was folded in the presence of physiologically relevant ions and then streptavidin was added to a 1:4 molar stoichiometry. In a third case, streptavidin was prepared in buffer containing physiologically relevant ions, but in the absence of LJM-3064. The CD spectrum of LJM-3064 prepared as a 4:1 conjugate with streptavidin reflects contributions from both the DNA aptamer and the streptavidin protein. The CD spectrum of a pure solution of streptavidin was subtracted from the spectrum of the streptavidin–aptamer conjugate, giving a difference spectrum. This difference spectrum revealed that the aptamer conformation when conjugated to streptavidin is essentially identical to its unconjugated conformation, both displaying definitive parallel-stranded G-quadruplex CD signatures of an ellipticity maximum at 260 nm and a minimum at 240 nm (Figure 6B).
To gain additional information regarding G-quadruplex conformations formed by LJM-3064 in Na+ and K+ solutions, we used DMS footprinting to map the pattern of N7 protection from methylation for guanine nucleotides involved in core G-quartets. The chemistry of DMS-mediated methylation of guanine N7 and adenine N3 and the subsequent base removal and strand cleavage were adapted from the classic work of Maxam and Gilbert (54). The result is cleavage of DNA at sites occupied by guanines. The unique Hoogsteen base pairing of guanine nucleotides in a G-quartet structure, however, renders the N7 position of guanine less accessible to methylating chemical reagents such as DMS, making DMS footprinting valuable for mapping G-quadruplex-forming regions within G-rich sequences. We performed DMS chemistry on LJM-3064 as described in the Materials and Methods section in 100 mM Na+, 100 mM K+ or 8 M urea, and separated the resulting fragments using denaturing polyacrylamide gel electrophoresis. Also included on the gel was a sample of LJM-3064 that was not treated with DMS, but that was heated and treated with alkali similar to the DMS-treated LJM-3064 samples. This established a method for background correction of measured band intensities. An image of a representative gel showing this analysis is shown in Figure 7A and B. Figure 7A shows a representative gel image with the contrast adjusted so that all bands are visible, whereas Figure 7B shows the same image with contrast adjusted to illustrate the differential DMS reactivity between protected and unprotected conditions. Quantitation of band intensities of samples run in triplicate on the same gel allowed for the calculation of a ‘PR’ (Equation 1) of DMS degradation-related band intensity in the denatured aptamer compared with the DMS degradation-related band intensity of aptamer in the presence of 100 mM Na+ or 100 mM K+. High PRs correlate with a decrease in N7 methylation in the presence of G-quadruplex-stabilizing ions relative to the urea-denatured state. The quantitation in Figure 7C, does not depend upon the gel image contrast setting, but is based on the background-adjusted pixel fluorescence intensities of the raw dataset. Our data reveal striking differences in guanine N7 protection between Na+- and K+-stabilized conditions, and confirms that G-quadruplex formation is dependent upon guanine tracts found in the 5′ region of LJM-3064. In both Na+- and K+-stabilized G-quadruplex forms, nucleotides 27–40 were not protected relative to the denatured aptamer state, indicating that they are not involved in G-quadruplex formation. The 5′ aptamer region, however, contains guanine homopolymer regions displaying increased N7 reactivity in the denatured aptamer state relative to the Na+- and K+-stabilized states, indicating that the guanine nucleotides in these regions participate in the Hoogsteen base pairs of the core quartet stacks. Structural differences between G-quadruplex forms stabilized by Na+ and K+ were also revealed by our DMS footprinting analysis. A summary of these differences is presented in Supplementary Figure S13 as a Student’s T-test of statistical difference between DMS PRs in the presence of Na+ and K+. Guanine nucleotides at positions 1, 2, 9, 10, 11, 13, 14, 15, 16, 19, 20, 22, 23 and 26 show statistically different levels of N7 protection when evaluated at the 99% confidence level. Of particular note, the G-quadruplex form stabilized by K+ displays enhanced N7 protection of G22, G23 and G26 relative to the Na+-stabilized G-quadruplex form, an observation that is difficult to accommodate with the simple models presented in Figure 1B. Understanding these subtle chemical reactivity differences will require future higher resolution structural studies. However, by combining insights provided by both CD and DMS data, we nominate the K+-stabilized structure to be most consistent with that seen in Figure 1B (I), and we similarly nominate the Na+-stabilized structure to be most consistent with that seen in Figure 1B (II).
Figure 7.

DMS probing of guanine N7 protection in sodium- and potassium-stabilized G-quadruplex structures. (A and B) Representative denaturing polyacrylamide gel showing LJM-3064 untreated by DMS (lane 1), treated with DMS in the presence of 8 M urea (lane 2), treated with DMS in the presence of 100 mM NaCl (lane 3) and treated with DMS in the presence of 100 mM KCl (lane 4). The LJM-3064 aptamer sequence is shown to the right of the gel image, with nucleotide numberings originating from the 5′ strand terminus. Homopolymer regions predicted to contribute to G-quadruplex formation are indicated by boxes. (A) Shows contrast adjusted to display all bands. (B) Shows contrast adjusted to optimally display degradation band intensity differences of core quadruplex guanines. (C) PR quantitation of Na+- and K+-stabilized quadruplex forms. Ratios indicate the relative amount of DMS-related degradation product band intensity in the denatured aptamer compared to the ion-stabilized G-quadruplex, with high ratios indicating that a position is protected in the folded structure. Error bars show 1σ calculated from triplicate assay repeats.
To further characterize structural differences between G-quadruplexes formed by LJM-3064 in the presence of Na+ versus K+, we used Bal 31 nuclease footprinting to map looped and unstructured regions of the aptamer. Bal 31 is a single-strand specific endonuclease that has been used previously to map perturbations in duplex DNA base pairing such as occurs at duplex DNA B-to-Z-form transitions and in supercoiled bacterial plasmids (66,67). It also possesses both 5′ and 3′ exonuclease activities on duplex DNA, but in the presence of single-stranded substrates, is active primary in its endonuclease mode (68,69). We conducted Bal 31 nuclease mapping of LJM-3064 folded in the presence of 100 mM Na+ or 100 mM K+ supplemented with Mg2+ and Ca2+ to 4 mM concentration. Reactions were quenched with the addition of EDTA, exploiting the strict requirement of Bal 31 for divalent calcium and magnesium ions. The resulting fragments were separated on a denaturing polyacrylamide gel (Figure 8). Much of the Bal 31 degradation pattern is similar for G-quadruplexes stabilized by Na+ and K+, with both displaying nuclease-mediated degradation of the aptamer near its 3′ terminus. This is consistent with findings from DMS chemical reactivity studies that showed decreased protection of LJM-3064 near its 3′ terminus (Figure 7), indicating that this is an unstructured region that does not participate in the core G-quadruplex fold, an observation that may prove useful in designing DNA constructs for higher-resolution structural studies. In addition, the data show subtle enzymatic degradation profile differences between Na+- and K+-stabilized G-quadruplex conformations. Notably, in the presence of K+, the C8 position of LJM-3064 displays enhanced reactivity relative to the Na+-stabilized condition. Conversely, in the presence of Na+, LJM-3064 shows enhanced enzymatic reactivity at the T12, G25, G26, T27 and C28 positions relative to the K+-stabilized condition. We interpret this result to further support the overall conclusion that monovalent Na+ and K+ ions can induce a significant conformational switch in LJM-3064 G-quadruplex conformation.
Figure 8.

Bal 31 nuclease probing of LJM-3064 Na+- and K+-stabilized structures. The LJM-3064 aptamer sequence is shown to the left of the gel image, with nucleotide numberings originating from the 5′ strand terminus. Homopolymer regions predicted to contribute to quadruplex formation are indicated by boxes. Positions where Bal 31 nuclease reactivity is notably different between sodium- and potassium-stabilized G-quadruplex forms are indicated by dots.
CONCLUSIONS
This article reveals a previously uncharacterized ion-dependent conformational switch for LJM-3064, a novel DNA aptamer with the demonstrated ability to induce central nervous system remyelination in a mouse model of multiple sclerosis (1). Native gel electrophoresis analysis indicates that LJM-3064 forms stable intramolecular G-quadruplex structures, and that K+ is the dominant ion driving G-quadruplex formation. CD experiments reveal that, in solutions containing Na+ ions and no K+ ions, LJM-3064 adopts an antiparallel G-quadruplex conformation. We suggest that this structure is likely similar to (II) in Figure 1B. Regardless of Na+ ion concentration, however, addition of as little as 4.7 mM K+ ions causes LJM-3064 to undergo a switch to a parallel-stranded G-quadruplex conformation, presumably its physiologically structure. We suggest that this physiological structure is likely similar to (I) in Figure 1B. Structural characterization studies of these two major LJM-3064 conformations using dimethyl sulfate chemical probing and Bal 31 nuclease probing both reveal that the major G-quadruplex-forming regions of LJM-3064 are located in the 5′ region of the aptamer, with the 14 nucleotides nearest the 3′ terminus adopting no higher-order folded structure. Dimethyl sulfate and Bal 31 probing also provide direct evidence of the ion-dependent conformational switching of LJM-3064. Higher resolution studies will be needed to further elucidate the fine structural details of these two fold topologies for LJM-3064. In addition, thermodynamic characterization of fold-state stability of LJM-3064 under physiological conditions reveals that at normal human body temperature, the aptamer structure is only metastable. Taken together, these data provide important information about the biophysical and structural properties of LJM-3064, and are critical for its further development as a remyelination-promoting reagent.
SUPPLEMENTARY DATA
Supplementary Data are available at NAR Online: Supplementary Tables 1 and 2, Supplementary Figures 1–13, Supplementary Methods and Supplementary References [59,70–73].
FUNDING
Mayo Foundation and a Collaborative MS Center Grant from the National MS Society. Funding for open access charge: Mayo Foundation.
Conflict of interest statement. None declared.
Supplementary Material
ACKNOWLEDGEMENTS
We thank M. Ramirez-Alvarado for instrument access, N. Becker for technical assistance and useful discussion, J. Peters for useful discussion and the anonymous referees for thoughtful comments and suggestions.
REFERENCES
- 1.Nastasijevic B, Wright BR, Smestad J, Warrington AE, Rodriguez M, Maher LJ. Remyelination induced by a DNA aptamer in a mouse model of multiple sclerosis. PLoS One. 2012;7:1–8. doi: 10.1371/journal.pone.0039595. [DOI] [PMC free article] [PubMed] [Google Scholar]
- 2.Hellings N, Baree M, Verhoeven C, D'Hooghe MB, Medaer R, Bernard CC, Raus J, Stinissen P. T-cell reactivity to multiple myelin antigens in multiple sclerosis patients and healthy controls. J. Neurosci. Res. 2001;63:290–302. doi: 10.1002/1097-4547(20010201)63:3<290::AID-JNR1023>3.0.CO;2-4. [DOI] [PubMed] [Google Scholar]
- 3.Kerlero de Rosbo N, Milo R, Lees MB, Burger D, Bernard CC, Ben-Nun A. Reactivity to myelin antigens in multiple sclerosis. Peripheral blood lymphocytes respond predominantly to myelin oligodendrocyte glycoprotein. J. Clin. Invest. 1993;92:2602–2608. doi: 10.1172/JCI116875. [DOI] [PMC free article] [PubMed] [Google Scholar]
- 4.de Rosbo NK, Ben-Nun A. T-cell responses to myelin antigens in multiple sclerosis; relevance of the predominant autoimmune reactivity to myelin oligodendrocyte glycoprotein. J. Autoimmun. 1998;11:287–299. doi: 10.1006/jaut.1998.0202. [DOI] [PubMed] [Google Scholar]
- 5.Cang XH, Sponer J, Cheatham TE. Explaining the varied glycosidic conformational, G-tract length and sequence preferences for anti-parallel G-quadruplexes. Nucleic Acids Res. 2011;39:4499–4512. doi: 10.1093/nar/gkr031. [DOI] [PMC free article] [PubMed] [Google Scholar]
- 6.Lane AN, Chaires JB, Gray RD, Trent JO. Stability and kinetics of G-quadruplex structures. Nucleic Acids Res. 2008;36:5482–5515. doi: 10.1093/nar/gkn517. [DOI] [PMC free article] [PubMed] [Google Scholar]
- 7.Macaya RF, Schultze P, Smith FW, Roe JA, Feigon J. Thrombin-binding DNA aptamer forms a unimolecular quadruplex structure in solution. Proc. Natl Acad. Sci. USA. 1993;90:3745–3749. doi: 10.1073/pnas.90.8.3745. [DOI] [PMC free article] [PubMed] [Google Scholar]
- 8.Huizenga DE, Szostak JW. A DNA aptamer that binds adenosine and Atp. Biochemistry-Us. 1995;34:656–665. doi: 10.1021/bi00002a033. [DOI] [PubMed] [Google Scholar]
- 9.Yoshida W, Mochizuki E, Takase M, Hasegawa H, Morita Y, Yamazaki H, Sode K, Ikebukuro K. Selection of DNA aptamers against insulin and construction of an aptameric enzyme subunit for insulin sensing. Biosens. Bioelectron. 2009;24:1116–1120. doi: 10.1016/j.bios.2008.06.016. [DOI] [PubMed] [Google Scholar]
- 10.Andreola ML, Pileur F, Calmels C, Ventura M, Tarrago-Litvak L, Toulme JJ, Litvak S. DNA aptamers selected against the HIV-1 RNase H display in vitro antiviral activity. Biochemistry-Us. 2001;40:10087–10094. doi: 10.1021/bi0108599. [DOI] [PubMed] [Google Scholar]
- 11.Kelley S, Boroda S, Musier-Forsyth K, Kankia BI. HIV-integrase aptamer folds into a parallel quadruplex: a thermodynamic study. Biophys. Chem. 2011;155:82–88. doi: 10.1016/j.bpc.2011.03.004. [DOI] [PubMed] [Google Scholar]
- 12.Miyachi Y, Shimizu N, Ogino C, Fukuda H, Kondo A. Selection of a DNA aptamer that binds 8-OHdG using GMP-agarose. Bioorg. Med. Chem. Lett. 2009;19:3619–3622. doi: 10.1016/j.bmcl.2009.04.130. [DOI] [PubMed] [Google Scholar]
- 13.Li YF, Geyer CR, Sen D. Recognition of anionic porphyrins by DNA aptamers. Biochemistry-Us. 1996;35:6911–6922. doi: 10.1021/bi960038h. [DOI] [PubMed] [Google Scholar]
- 14.Mann D, Reinemann C, Stoltenburg R, Strehlitz B. In vitro selection of DNA aptamers binding ethanolamine. Biochem. Biophys. Res. Commun. 2005;338:1928–1934. doi: 10.1016/j.bbrc.2005.10.172. [DOI] [PubMed] [Google Scholar]
- 15.Pedroso IM, Duarte LF, Yanez G, Burkewitz K, Fletcher TM. Sequence specificity of inter- and intramolecular G-quadruplex formation by human telomeric DNA. Biopolymers. 2007;87:74–84. doi: 10.1002/bip.20790. [DOI] [PubMed] [Google Scholar]
- 16.Rujan IN, Meleney JC, Bolton PH. Vertebrate telomere repeat DNAs favor external loop propeller quadruplex structures in the presence of high concentrations of potassium. Nucleic Acids Res. 2005;33:2022–2031. doi: 10.1093/nar/gki345. [DOI] [PMC free article] [PubMed] [Google Scholar]
- 17.Balagurumoorthy P, Brahmachari SK, Mohanty D, Bansal M, Sasisekharan V. Hairpin and parallel quartet structures for telomeric sequences. Nucleic Acids Res. 1992;20:4061–4067. doi: 10.1093/nar/20.15.4061. [DOI] [PMC free article] [PubMed] [Google Scholar]
- 18.Kaluzhny D, Ilyinsky N, Shchekotikhin A, Sinkevich Y, Tsvetkov PO, Tsvetkov V, Veselovsky A, Livshits M, Borisova O, Shtil A, et al. Disordering of human telomeric G-quadruplex with novel antiproliferative anthrathiophenedione. PLoS One. 2011;6:e27151. doi: 10.1371/journal.pone.0027151. [DOI] [PMC free article] [PubMed] [Google Scholar]
- 19.Prakash A, Kieken F, Marky LA, Borgstahl GE. Stabilization of a G-Quadruplex from unfolding by replication protein A using potassium and the porphyrin TMPyP4. J. Nucleic Acids. 2011;2011:529828. doi: 10.4061/2011/529828. [DOI] [PMC free article] [PubMed] [Google Scholar]
- 20.Qin Y, Rezler EM, Gokhale V, Sun D, Hurley LH. Characterization of the G-quadruplexes in the duplex nuclease hypersensitive element of the PDGF-A promoter and modulation of PDGF-A promoter activity by TMPyP4. Nucleic Acids Res. 2007;35:7698–7713. doi: 10.1093/nar/gkm538. [DOI] [PMC free article] [PubMed] [Google Scholar]
- 21.Hurley LH, Von Hoff DD, Siddiqui-Jain A, Yang D. Drug targeting of the c-MYC promoter to repress gene expression via a G-quadruplex silencer element. Semin. Oncol. 2006;33:498–512. doi: 10.1053/j.seminoncol.2006.04.012. [DOI] [PubMed] [Google Scholar]
- 22.Siddiqui-Jain A, Grand CL, Bearss DJ, Hurley LH. Direct evidence for a G-quadruplex in a promoter region and its targeting with a small molecule to repress c-MYC transcription. Proc. Natl Acad. Sci. USA. 2002;99:11593–11598. doi: 10.1073/pnas.182256799. [DOI] [PMC free article] [PubMed] [Google Scholar]
- 23.Seenisamy J, Rezler EM, Powell TJ, Tye D, Gokhale V, Joshi CS, Siddiqui-Jain A, Hurley LH. The dynamic character of the G-quadruplex element in the c-MYC promoter and modification by TMPyP4. J. Am. Chem. Soc. 2004;126:8702–8709. doi: 10.1021/ja040022b. [DOI] [PubMed] [Google Scholar]
- 24.Sun DY, Guo KX, Rusche JJ, Hurley LH. Facilitation of a structural transition in the polypurine/polypyrimidine tract within the proximal promoter region of the human VEGF gene by the presence of potassium and G-quadruplex-interactive agents. Nucleic Acids Res. 2005;33:6070–6080. doi: 10.1093/nar/gki917. [DOI] [PMC free article] [PubMed] [Google Scholar]
- 25.Dexheimer TS, Sun D, Hurley LH. Deconvoluting the structural and drug-recognition complexity of the G-quadruplex-forming region upstream of the bcl-2 P1 promoter. J. Am. Chem. Soc. 2006;128:5404–-5415. doi: 10.1021/ja0563861. [DOI] [PMC free article] [PubMed] [Google Scholar]
- 26.Qin Y, Hurley LH. Structures, folding patterns, and functions of intramolecular DNA G-quadruplexes found in eukaryotic promoter regions. Biochimie. 2008;90:1149–1171. doi: 10.1016/j.biochi.2008.02.020. [DOI] [PMC free article] [PubMed] [Google Scholar]
- 27.Yang D, Hurley LH. Structure of the biologically relevant G-quadruplex in the c-MYC promoter. Nucleosides Nucleotides Nucleic Acids. 2006;25:951–968. doi: 10.1080/15257770600809913. [DOI] [PubMed] [Google Scholar]
- 28.Ambrus A, Chen D, Dai J, Jones RA, Yang D. Solution structure of the biologically relevant G-quadruplex element in the human c-MYC promoter. Implications for G-quadruplex stabilization. Biochemistry-Us. 2005;44:2048–2058. doi: 10.1021/bi048242p. [DOI] [PubMed] [Google Scholar]
- 29.De Armond R, Wood S, Sun DY, Hurley LH, Ebbinghaus SW. Evidence for the presence of a guanine quadruplex forming region within a polypurine tract of the hypoxia inducible factor 1 alpha promoter. Biochemistry-Us. 2005;44:16341–16350. doi: 10.1021/bi051618u. [DOI] [PubMed] [Google Scholar]
- 30.Guo K, Pourpak A, Beetz-Rogers K, Gokhale V, Sun D, Hurley LH. Formation of pseudosymmetrical G-quadruplex and i-motif structures in the proximal promoter region of the RET oncogene. J. Am. Chem. Soc. 2007;129:10220–10228. doi: 10.1021/ja072185g. [DOI] [PMC free article] [PubMed] [Google Scholar]
- 31.Cogoi S, Xodo LE. G-quadruplex formation within the promoter of the KRAS proto-oncogene and its effect on transcription. Nucleic Acids Res. 2006;34:2536–2549. doi: 10.1093/nar/gkl286. [DOI] [PMC free article] [PubMed] [Google Scholar]
- 32.Dai JX, Chen D, Jones RA, Hurley LH, Yang DZ. NMR solution structure of the major G-quadruplex structure formed in the human BCL2 promoter region. Nucleic Acids Res. 2006;34:5133–5144. doi: 10.1093/nar/gkl610. [DOI] [PMC free article] [PubMed] [Google Scholar]
- 33.Rankin S, Reszka AP, Huppert J, Zloh M, Parkinson GN, Todd AK, Ladame S, Balasubramanian S, Neidle S. Putative DNA quadruplex formation within the human c-kit oncogene. J. Am. Chem. Soc. 2005;127:10584–10589. doi: 10.1021/ja050823u. [DOI] [PMC free article] [PubMed] [Google Scholar]
- 34.Fernando H, Reszka AP, Huppert J, Ladame S, Rankin S, Venkitaraman AR, Neidle S, Balasubramanian S. A conserved quadruplex motif located in a transcription activation site of the human c-kit oncogene. Biochemistry-Us. 2006;45:7854–7860. doi: 10.1021/bi0601510. [DOI] [PMC free article] [PubMed] [Google Scholar]
- 35.Phan AT, Kuryavyi V, Burge S, Neidle S, Patel DJ. Structure of an unprecedented G-quadruplex scaffold in the human c-kit promoter. J. Am. Chem. Soc. 2007;129:4386–4392. doi: 10.1021/ja068739h. [DOI] [PMC free article] [PubMed] [Google Scholar]
- 36.Shirude PS, Okumus B, Ying LM, Ha T, Balasubramanian S. Single-molecule conformational analysis of G-quadruplex formation in the promoter DNA duplex of the proto-oncogene C-kit. J. Am. Chem. Soc. 2007;129:7484. doi: 10.1021/ja070497d. [DOI] [PMC free article] [PubMed] [Google Scholar]
- 37.Todd AK, Haider SM, Parkinson GN, Neidle S. Sequence occurrence and structural uniqueness of a G-quadruplex in the human c-kit promoter. Nucleic Acids Res. 2007;35:5799–5808. doi: 10.1093/nar/gkm609. [DOI] [PMC free article] [PubMed] [Google Scholar]
- 38.Kypr J, Kejnovska I, Renciuk D, Vorlickova M. Circular dichroism and conformational polymorphism of DNA. Nucleic Acids Res. 2009;37:1713–1725. doi: 10.1093/nar/gkp026. [DOI] [PMC free article] [PubMed] [Google Scholar]
- 39.Paramasivan S, Rujan I, Bolton PH. Circular dichroism of quadruplex DNAs: applications to structure, cation effects and ligand binding. Methods. 2007;43:324–331. doi: 10.1016/j.ymeth.2007.02.009. [DOI] [PubMed] [Google Scholar]
- 40.Gray DM, Wen JD, Gray CW, Repges R, Repges C, Raabe G, Fleischhauer J. Measured and calculated CD spectra of G-quartets stacked with the same or opposite polarities. Chirality. 2008;20:431–440. doi: 10.1002/chir.20455. [DOI] [PubMed] [Google Scholar]
- 41.Vorlickova M, Kejnovska I, Sagi J, Renciuk D, Bednarova K, Motlova J, Kypr J. Circular dichroism and guanine quadruplexes. Methods. 2012;57:64–75. doi: 10.1016/j.ymeth.2012.03.011. [DOI] [PubMed] [Google Scholar]
- 42.Vorlickova M, Chladkova J, Kejnovska I, Fialova M, Kypr J. Guanine tetraplex topology of human telomere DNA is governed by the number of (TTAGGG) repeats. Nucleic Acids Res. 2005;33:5851–5860. doi: 10.1093/nar/gki898. [DOI] [PMC free article] [PubMed] [Google Scholar]
- 43.Parkinson GN, Lee MP, Neidle S. Crystal structure of parallel quadruplexes from human telomeric DNA. Nature. 2002;417:876–880. doi: 10.1038/nature755. [DOI] [PubMed] [Google Scholar]
- 44.Schultze P, Macaya RF, Feigon J. Three-dimensional solution structure of the thrombin-binding DNA aptamer d(GGTTGGTGTGGTTGG) J. Mol. Biol. 1994;235:1532–1547. doi: 10.1006/jmbi.1994.1105. [DOI] [PubMed] [Google Scholar]
- 45.Dai J, Chen D, Jones RA, Hurley LH, Yang D. NMR solution structure of the major G-quadruplex structure formed in the human BCL2 promoter region. Nucleic Acids Res. 2006;34:5133–5144. doi: 10.1093/nar/gkl610. [DOI] [PMC free article] [PubMed] [Google Scholar]
- 46.Luu KN, Phan AT, Kuryavyi V, Lacroix L, Patel DJ. Structure of the human telomere in K+ solution: an intramolecular (3 + 1) G-quadruplex scaffold. J. Am. Chem. Soc. 2006;128:9963–9970. doi: 10.1021/ja062791w. [DOI] [PMC free article] [PubMed] [Google Scholar]
- 47.Wang Y, Patel DJ. Solution structure of the human telomeric repeat d[AG3(T2AG3)3] G-tetraplex. Structure. 1993;1:263–282. doi: 10.1016/0969-2126(93)90015-9. [DOI] [PubMed] [Google Scholar]
- 48.Kuryavyi V, Majumdar A, Shallop A, Chernichenko N, Skripkin E, Jones R, Patel DJ. A double chain reversal loop and two diagonal loops define the architecture of a unimolecular DNA quadruplex containing a pair of stacked G(syn)-G(syn)-G(anti)-G(anti) tetrads flanked by a G-(T-T) Triad and a T-T-T triple. J. Mol. Biol. 2001;310:181–194. doi: 10.1006/jmbi.2001.4759. [DOI] [PubMed] [Google Scholar]
- 49.Dai J, Punchihewa C, Ambrus A, Chen D, Jones RA, Yang D. Structure of the intramolecular human telomeric G-quadruplex in potassium solution: a novel adenine triple formation. Nucleic Acids Res. 2007;35:2440–2450. doi: 10.1093/nar/gkm009. [DOI] [PMC free article] [PubMed] [Google Scholar]
- 50.Dai J, Carver M, Punchihewa C, Jones RA, Yang D. Structure of the Hybrid-2 type intramolecular human telomeric G-quadruplex in K+ solution: insights into structure polymorphism of the human telomeric sequence. Nucleic Acids Res. 2007;35:4927–4940. doi: 10.1093/nar/gkm522. [DOI] [PMC free article] [PubMed] [Google Scholar]
- 51.Wei D, Parkinson GN, Reszka AP, Neidle S. Crystal structure of a c-kit promoter quadruplex reveals the structural role of metal ions and water molecules in maintaining loop conformation. Nucleic Acids Res. 2012;40:4691–4700. doi: 10.1093/nar/gks023. [DOI] [PMC free article] [PubMed] [Google Scholar]
- 52.Gilanyi M, Ikrenyi C, Fekete J, Ikrenyi K, Kovach AG. Ion concentrations in subcutaneous interstitial fluid: measured versus expected values. Am. J. Physiol. 1988;255:F513–F519. doi: 10.1152/ajprenal.1988.255.3.F513. [DOI] [PubMed] [Google Scholar]
- 53.Strauss JK, Maher LJ. DNA bending by asymmetric phosphate neutralization. Science. 1994;266:1829–1834. doi: 10.1126/science.7997878. [DOI] [PubMed] [Google Scholar]
- 54.Maxam AM, Gilbert W. A new method for sequencing DNA. Proc. Natl Acad. Sci. USA. 1977;74:560–564. doi: 10.1073/pnas.74.2.560. [DOI] [PMC free article] [PubMed] [Google Scholar]
- 55.Bryan TM, Baumann P. G-quadruplexes: from guanine gels to chemotherapeutics. Mol. Biotechnol. 2011;49:198–208. doi: 10.1007/s12033-011-9395-5. [DOI] [PMC free article] [PubMed] [Google Scholar]
- 56.Williamson JR. G-quartet structures in telomeric DNA. Annu. Rev. Biophys. Biomol. Struct. 1994;23:703–730. doi: 10.1146/annurev.bb.23.060194.003415. [DOI] [PubMed] [Google Scholar]
- 57.Williamson JR, Raghuraman MK, Cech TR. Monovalent cation-induced structure of telomeric DNA: the G-quartet model. Cell. 1989;59:871–880. doi: 10.1016/0092-8674(89)90610-7. [DOI] [PubMed] [Google Scholar]
- 58.Olsen CM, Lee HT, Marky LA. Unfolding thermodynamics of intramolecular G-quadruplexes: base sequence contributions of the loops. J. Phys. Chem. B. 2009;113:2587–2595. doi: 10.1021/jp806853n. [DOI] [PubMed] [Google Scholar]
- 59.Olsen CM, Gmeiner WH, Marky LA. Unfolding of G-quadruplexes: energetic, and ion and water contributions of G-quartet stacking. J. Phys. Chem. B. 2006;110:6962–6969. doi: 10.1021/jp0574697. [DOI] [PubMed] [Google Scholar]
- 60.Balagurumoorthy P, Brahmachari SK. Structure and stability of human telomeric sequence. J. Biol. Chem. 1994;269:21858–21869. [PubMed] [Google Scholar]
- 61.Mergny JL, Phan AT, Lacroix L. Following G-quartet formation by UV-spectroscopy. FEBS Lett. 1998;435:74–78. doi: 10.1016/s0014-5793(98)01043-6. [DOI] [PubMed] [Google Scholar]
- 62.Li W, Wu P, Ohmichi T, Sugimoto N. Characterization and thermodynamic properties of quadruplex/duplex competition. FEBS Lett. 2002;526:77–81. doi: 10.1016/s0014-5793(02)03118-6. [DOI] [PubMed] [Google Scholar]
- 63.Risitano A, Fox KR. Stability of intramolecular DNA quadruplexes: comparison with DNA duplexes. Biochemistry-Us. 2003;42:6507–6513. doi: 10.1021/bi026997v. [DOI] [PubMed] [Google Scholar]
- 64.Rodriguez M, Miller DJ, Lennon VA. Immunoglobulins reactive with myelin basic protein promote CNS remyelination. Neurology. 1996;46:538–545. doi: 10.1212/wnl.46.2.538. [DOI] [PubMed] [Google Scholar]
- 65.Bieber AJ, Warrington A, Asakura K, Ciric B, Kaveri SV, Pease LR, Rodriguez M. Human antibodies accelerate the rate of remyelination following lysolecithin-induced demyelination in mice. Glia. 2002;37:241–249. doi: 10.1002/glia.10033. [DOI] [PubMed] [Google Scholar]
- 66.Gray HB, Jr, Ostrander DA, Hodnett JL, Legerski RJ, Robberson DL. Extracellular nucleases of Pseudomonas BAL 31. I. characterization of single strand-specific deoxyriboendonuclease and double-strand deoxyriboexonuclease activities. Nucleic Acids Res. 1975;2:1459–1492. doi: 10.1093/nar/2.9.1459. [DOI] [PMC free article] [PubMed] [Google Scholar]
- 67.Wei CF, Alianell GA, Bencen GH, Gray HB., Jr Isolation and comparison of two molecular species of the BAL 31 nuclease from Alteromonas espejiana with distinct kinetic properties. J. Biol. Chem. 1983;258:13506–13512. [PubMed] [Google Scholar]
- 68.Desai NA, Shankar V. Single-strand-specific nucleases. FEMS Microbiol. Rev. 2003;26:457–491. doi: 10.1111/j.1574-6976.2003.tb00626.x. [DOI] [PubMed] [Google Scholar]
- 69.Nichols NM. Endonucleases. Curr. Protoc. Mol. Biol. 2011;3:1–7. doi: 10.1002/0471142727.mb0312s93. [DOI] [PubMed] [Google Scholar]
- 70.Savitzky A, Golay M. Smoothing and differentiation of data by simplified least squares procedures. Anal. Chem. 1964;36:1627–1639. [Google Scholar]
- 71.Mergny JL, Lacroix L. Analysis of thermal melting curves. Oligonucleotides. 2003;13:515–537. doi: 10.1089/154545703322860825. [DOI] [PubMed] [Google Scholar]
- 72.Kumar N, Maiti S. A thermodynamic overview of naturally occurring intramolecular DNA quadruplexes. Nucleic Acids Res. 2008;36:5610–5622. doi: 10.1093/nar/gkn543. [DOI] [PMC free article] [PubMed] [Google Scholar]
- 73.Mergny JL, Lacroix L. UV melting of G-quadruplexes. Curr. Protoc. Nucleic Acid Chem. 2009 doi: 10.1002/0471142700.nc1701s37. Chapter 17, Unit 17 11. [DOI] [PubMed] [Google Scholar]
Associated Data
This section collects any data citations, data availability statements, or supplementary materials included in this article.