

Abstract
Ras proteins regulate signaling pathways important for cell growth, differentiation, and survival. Oncogenic mutant Ras proteins are commonly expressed in human tumors, with mutations of the K-Ras isoform being most prevalent. To be active, K-Ras must undergo posttranslational processing and associate with the plasma membrane. We therefore devised a high-content screening assay to search for inhibitors of K-Ras plasma membrane association. Using this assay, we identified fendiline, an L-type calcium channel blocker, as a specific inhibitor of K-Ras plasma membrane targeting with no detectable effect on the localization of H- and N-Ras. Other classes of L-type calcium channel blockers did not mislocalize K-Ras, suggesting a mechanism that is unrelated to calcium channel blockade. Fendiline did not inhibit K-Ras posttranslational processing but significantly reduced nanoclustering of K-Ras and redistributed K-Ras from the plasma membrane to the endoplasmic reticulum (ER), Golgi apparatus, endosomes, and cytosol. Fendiline significantly inhibited signaling downstream of constitutively active K-Ras and endogenous K-Ras signaling in cells transformed by oncogenic H-Ras. Consistent with these effects, fendiline blocked the proliferation of pancreatic, colon, lung, and endometrial cancer cell lines expressing oncogenic mutant K-Ras. Taken together, these results suggest that inhibitors of K-Ras plasma membrane localization may have utility as novel K-Ras-specific anticancer therapeutics.
INTRODUCTION
Ras GTPases operate as molecular switches in signaling pathways that control cell proliferation. Ras normally oscillates between an active, GTP-bound state and an inactive, GDP-bound state in a cycle that is tightly controlled by guanine nucleotide exchange factors and GTPase-activating proteins. Oncogenic Ras mutations occur in ∼15% of all human tumors and directly contribute to malignant transformation by locking Ras in the GTP-bound state, leading to constitutive activation of downstream signaling pathways. Activating point mutations have been reported in all three ubiquitously expressed Ras isoforms, H-, N-, and K-Ras, but the major clinical problem is K-Ras. Oncogenic K-Ras mutations occur in 90% of pancreatic, 45% of colorectal, and 35% of lung carcinomas (1–3).
Small-molecule inhibitors of kinases downstream of K-Ras have been developed as anticancer therapeutics. Within the Raf-mitogen-activated protein kinase (MAPK) cascade, potent inhibitors of BRaf, CRaf, and MEK are in clinical use (4–13). Although very encouraging, the clinical responses to Raf inhibitors can be relatively short-lived, with treatment failure and tumor progression occurring due to acquired resistance, primarily as a result of secondary mutations in oncogenic BRaf or other proteins such as N-Ras or MEK (14–16). In addition, while BRaf inhibitors inhibit the activation of BRaf/MEK/extracellular signal-regulated kinase (ERK) in BRaf mutant cell lines, they paradoxically activate MEK/ERK signaling in cell lines with Ras mutations (17–20).
Approaches to directly target Ras have to date not been successful. Ras proteins undergo posttranslational processing to generate a lipid-modified C terminus. The cysteine residue in the C-terminal CAAX motif common to all Ras isoforms is isoprenylated by farnesyl protein transferase. Farnesylated Ras proteins interact with the cytosolic surface of the endoplasmic reticulum (ER), where the AAX motif is cleaved by Ras-converting enzyme 1 (Rce1). This is followed by carboxymethylation of the farnesylated cysteine by isoprenyl cysteine carboxylmethyl transferase (Icmt) (21). The weak membrane binding affinity provided by CAAX processing is enhanced by a second signal comprising a C-terminal polybasic domain in K-Ras and palmitoylation of one or two cysteine residues (Cys181 and -184) in N- and H-Ras, respectively (22–24). These second signals specify distinct ER-to-plasma membrane trafficking routes: H- and N-Ras traffic via the classical secretory pathway to the plasma membrane, while K-Ras transits via a poorly understood, Golgi apparatus-independent route that requires mitochondrial function and possibly cytosolic chaperones (22, 23, 25, 26).
Since farnesylation is absolutely required for Ras biological activity (27, 28), farnesyltransferase inhibitors (FTIs) were predicted to be excellent candidates for anti-Ras drugs. However, in cells treated with FTIs, K- and N-Ras are alternatively prenylated by geranylgeranyl transferase 1 (GGTase1) and traffic normally from the ER to the plasma membrane (29, 30). Geranylgeranylated oncogenic K- and N-Ras are equally transforming as the cognate farnesylated proteins (31, 32), and therefore FTIs have no clinical utility in K- and N-Ras transformed cells. Inhibitors of Rce1 and Icmt are under development, but since these agents will also target CAAX processing of geranylgeranylated Rho family GTPases, concerns for potential toxicity arise (33).
Notwithstanding the clinical failure of FTIs, since K-Ras must be localized to the plasma membrane to activate downstream effectors (34–36), inhibition of plasma membrane localization remains a valid therapeutic approach to block signal transmission by oncogenic K-Ras. We therefore devised a simple high-content screen to search for inhibitors of K-Ras plasma membrane association. We report here our results from screening the Prestwick library, which comprises a large set of FDA-approved drugs. From this library we identified fendiline as a specific inhibitor of K-Ras plasma membrane localization that also inhibits K-Ras signal output and blocks the proliferation of K-Ras-transformed tumor cells.
MATERIALS AND METHODS
Materials.
The Prestwick chemical library and fendiline hydrochloride were purchased from Prestwick Chemicals (Illkirch, France). R and S enantiomers of fendiline were synthesized by Aviara Pharmaceuticals, Inc. (Houston, TX). Purity of compounds was confirmed by nuclear magnetic resonance (NMR) spectroscopy. All other drugs were purchased from Sigma-Aldrich and were dissolved in dimethyl sulfoxide (DMSO). Cell culture media and fetal bovine serum (FBS) were purchased from HyClone. Penicillin-streptomycin was purchased from Invitrogen. Antibodies against B-Raf (sc-5284), N-Ras (sc-31), and H-Ras (sc-520) were obtained from Santa Cruz Biotechnology (Santa Cruz, CA). Anti-c-K-Ras (R3400) and anti-β-actin (A1978) antibodies were from Sigma-Aldrich. Anti-Ras (610001) and anti-Raf1 (610152) antibodies were obtained from BD Transduction Laboratories (Lexington, KY). Anti-phospho-p44/42 mitogen-activated protein kinase (MAPK) (ERK1/2) (Thr202/Tyr204) (9101), anti-phospho-Akt (pAkt) (Ser473) (9271), and anti-Akt (2920) antibodies were from Cell Signaling Technology (Beverly, MA). Anti-protein disulfide isomerase (anti-PDI) (ab2792), COX IV (ab33985), and anti-58K Golgi protein (p58) (ab6284) antibodies were from Abcam (Cambridge, MA). Mouse anti-green fluorescent protein (anti-GFP) antibody for Western immunoblotting was from Sigma (G1546), and rabbit anti-mGFP antibody for immunogold labeling was generated in-house. K-Ras mouse ON-TargetPlus SMARTpool, ON-TargetPlus nontargeting pool, DharmaFECT 1 small interfering RNA (siRNA) transfection reagent, and 5× siRNA buffer were purchased from Dharmacon (Lafayette, CO). Recombinant MEK1(14-420) and ERK2(14-198) were purchased from Millipore (Billerica, MA). RFP-KRϕ plasmid was a kind gift from Sergio Grinstein (Hospital for Sick Children, Toronto, Ontario, Canada). Rac1 and Rap1A plasmids were kind gifts from Mark Phillips (New York University School of Medicine, New York, NY).
Cell lines.
BxPC3, HPAC, MOH, MiaPaCa-2, and MPanc96 cells were kindly provided by Craig Logsdon, Hec-50 cells by Russell Broaddus, KLE, ESS1, Ishikawa, and Hec-1a cells by Karen Lu, and HEC-1b cells by Bryan Hennessey, all at MD Anderson Cancer Center, Houston, TX. All other cell lines were purchased from the American Type Culture Collection (Manassas, VA). Madin-Darby canine kidney (MDCK) epithelial cells and baby hamster kidney (BHK) cells were grown in Dulbecco's modified Eagle's medium (DMEM)–high-glucose medium supplemented with sodium pyruvate and 10% FBS or supplemented bovine calf serum, respectively. KLE and Hec-50 cells were maintained in DMEM–F-12 medium supplemented with 10% FBS. Hec-1a and Hec-1b cells were grown in McCoy's 5a medium supplemented with 10% FBS. Ishikawa cells were maintained in minimal essential medium (MEM) supplemented with sodium pyruvate, nonessential amino acids, and 5% FBS, and ESS-1 cells were grown in RPMI 1640 medium supplemented with 20% FBS. MPanc96 and CaCO-2 cells were grown in DMEM supplemented with 10% FBS, MiaPaCa-2 cells in DMEM supplemented with 10% FBS and 2.5% horse serum, and SK-CO-1 cells in Eagle's MEM supplemented with 10% FBS. SW116 and SW948 cells were grown in Leibovitz's L15 medium with 10% FBS. All other cell lines were grown in RPMI 1640 supplemented with 10% FBS. SW116 and SW948 cells were grown at 37°C without CO2. All other cell lines were grown at 37°C with 5% CO2. BHK cells were transfected using Lipofectamine (Invitrogen) according to the manufacturer's instructions. Where necessary, the cells were serum starved for 2.5 h prior to harvest.
Preliminary and secondary drug screen.
Wild-type MDCK cells or MDCK cells stably expressing GFP appended with the C-terminal 24 or 25 amino acids of K-Ras or H-Ras (GFP-CTK and GFP-CTH, described previously [22, 37]) were seeded in triplicate in 96-well plates (Matrical) at a density of 30,000 cells/well and incubated for 24 h at 37°C. Prestwick chemical library drugs were added at a concentration of 4 μg/ml (concentration of DMSO, 1%) and incubated for a further 48 h. Cells were then fixed with 4% paraformaldehyde and stored in phosphate-buffered saline (PBS) at 4°C until imaged. Plates were imaged using a BD Pathway Bioimager. Images were acquired as a 3 by 3 montage with a 20× objective lens using the GFP-confocal mode.
Fluorescence microscopy.
Cells were grown on coverslips, treated with 1% vehicle (DMSO) or various concentrations of drugs, and fixed with 4% paraformaldehyde. The coverslips were mounted in Mowiol and visualized by confocal microscopy (Nikon A1) using a 60× objective. For quantification, the densitometric ratio of plasma membrane-localized K-Ras versus total K-Ras was calculated using custom-written algorithms in ImageJ software. For immunostaining, cells were fixed, permeabilized in 0.1% Triton in PBS for 10 min, and blocked with 0.2% bovine serum albumin and 0.2% fish skin gelatin in PBS for 30 min. Primary and secondary antibodies were incubated for 1 h each, and then coverslips were mounted in Mowiol.
Ras methylation assay.
Confluent MDCK cells expressing GFP-K-RasG12V or GFP-K-RasG12V,C185S were treated with vehicle (DMSO) or fendiline (4 μg/ml) for 48 h. For the final 18 h of drug treatment, cells were labeled with 50 μCi/ml [methyl-3H]methionine in methionine-free medium. GFP-K-RasG12V or GFP-K-RasG12V,C185S proteins were immunoprecipitated with GFP-trap (Chromotek, Germany) and separated by SDS-PAGE. Radiolabeled Ras proteins were visualized using fluorography with salicylate. Using the fluorograph as a guide, regions of gel corresponding to GFP-Ras were cut out and treated overnight with 1 M NaOH in a vapor phase equilibration assay to release and collect esterified methyl groups (38, 39). The label released as methanol and label remaining as methionine were determined by scintillation counting after neutralization of alkali with HCl. The expected ratio of methyl-3H released as methanol to methyl-3H remaining in the protein backbone is 11, which is not significantly different from the values of 10.19 ± 0.34 (mean ± standard error of the mean [SEM]; n = 3) and 9.77 ± 0.77 that we observed in control and fendiline-treated cells, respectively. This assay confirms that CAAX processing is completed normally in fendiline-treated cells.
K-Ras knockdown.
BHK cells stably expressing GFP-tagged H-RasG12V were transfected with the ON-Target K-Ras-specific siRNA pool or nontargeting control siRNA pool (Dharmacon) according to the manufacturer's protocol. At 24 h posttransfection, the cells were treated with vehicle or fendiline; 48 h later (72 h total knockdown time), the cells were lysed for Western blot analysis.
Western blotting.
For preparation of whole-cell lysates, cells were lysed in buffer B (50 mM Tris [pH 7.5], 75 mM NaCl, 25 mM NaF, 5 mM MgCl2, 5 mM EGTA, 1 mM dithiothreitol, 100 μM NaVO4, 1% Nonidet P-40 plus protease inhibitors). In cellular fractionation experiments, cells were incubated in buffer A (10 mM Tris-HCl [pH 7.5], 25 mM NaF, 5 mM MgCl2, 1 mM EGTA, 1 mM dithiothreitol, 100 μM NaVO4 plus protease inhibitors) for 30 min on ice and lysed by passing through a 27-gauge needle 30 times. The postnuclear supernatant was centrifuged at 100,000 × g for 30 min, and the membrane pellet was resuspended in buffer A containing 1% Triton X-100. SDS-PAGE and Western blotting with the specified antibody were performed using 20 μg of each whole-cell lysate/membrane (P100) fraction and volumes of soluble (S100) fractions equal to that of the corresponding P100. Signal was detected by enhanced chemiluminescence (SuperSignal; Pierce, Thermo Fisher Scientific, Rockford, IL) and imaged by FluorChemQ (Alpha Inotech, San Leandro, CA). Quantification of intensities was performed using FluorChemQ software.
Immuno-EM and spatial analysis.
Immunoelectron microscopy (immuno-EM) and spatial analysis were conducted exactly as described previously (40, 41). Plasma membrane sheets were prepared, fixed, and labeled with affinity-purified anti-GFP antibody coupled directly to 4.5-nm gold. Digital images of the immunogold-labeled plasma membrane sheets were taken in a transmission electron microscope. Intact 1-μm2 areas of the plasma membrane sheet were identified using ImageJ, and the x-y coordinates of the gold particles were determined. Ripley's K function (42) was calculated using the x-y coordinates and then standardized on the 99% confidence interval (CI) for a random pattern (40, 41, 43). Bootstrap tests to examine differences between replicated point patterns were constructed exactly as described previously, and statistical significance was evaluated against 1,000 bootstrap samples (43, 44).
Raf kinase assay.
P100 fractions prepared from BHK cells were dissolved in buffer A containing 1% Triton X-100. Solubilized P100 fractions were incubated with combinations of recombinant MEK and ERK in the presence of Mg2+-ATP (40 mM and 0.5 mM, respectively) (45). After 30 min at 30°C with vigorous shaking, the pMEK and pERK levels were determined by quantitative Western blotting.
Proliferation assay.
BxPC-3 (4 × 10³ cells per well), MiaPaCa-2 (2 × 10³), MOH (1.5 × 10³), HPAC (7 × 10³), MPanc96 (2 × 10³), KLE (1 × 10⁴), Hec-1A (5 × 10³), Hec-1B (5 × 10³), Ishikawa (5 × 10³), ESS-1(5 × 10³), NCI 1975 (6 × 10³), NCI H1299 (3 × 10³), NCI H23 (1 × 10⁴), NCI H522 (5 × 10³), SNU-C1 (4 × 10³), NCI H508 (4 × 10³), CaCO-2 (5 × 10³), SK-CO-1 (3 × 10³), SW948 (4 × 10³), and SW1116 (6 × 10³) cells were seeded in 96-well plates. After 24 h, fresh growth medium supplemented with 1% vehicle (DMSO), various concentrations of fendiline, or U0126 was added and cells were grown for 48 h or 72 h. Cell numbers were quantified using the CellTiter 96 AQueous One Solution cell proliferation assay (MTS) (Promega), according to the manufacturer's protocol.
Viability assay.
MDCK cells stably expressing GFP-K-RasG12V were treated with 1% vehicle (DMSO) or various concentrations of fendiline for 48 h. Cells were trypsinized and resuspended in medium. Ten microliters of cell suspension was mixed with 10 μl of 0.4% trypan blue, and live/dead cell counts were obtained using Countess (Invitrogen).
Intracellular calcium measurement.
Intracellular calcium was monitored in cultured cells using the Fura-2AM fluorescent indicator technique in ratiometric mode (46). Cells were grown on coverslips and loaded with 5 μM Fura-2AM in Hanks' balanced salt solution (HBSS) containing pluronic acid at 37°C for 30 min. Cells were then washed, and the coverslips were attached to the bottom of a measurement cuvette filled with HBSS and placed on the microscope stage of an InCyt Im Imaging workstation (Intracellular Imaging, Inc.). Cells were imaged with a Nikon Eclipse TS 100 inverted microscope using a 20× super fluor objective (numerical aperture [NA] = 0.75) and a 12-bit charge-coupled device (CCD) camera (Pixel Fly, Cooke). Measurements were taken every 5 s during the experiment. Drugs were added 1 min after starting the calcium measurement, and then at 30 min and 32 min after addition of drugs, 10 μM ionomycin and 50 mM EGTA were added sequentially to ensure responsiveness of cells and to quench fluorescence, respectively. In 48-h treatment experiments, cells were grown in the presence of drug for 48 h and the drugs were also added to HBSS during calcium measurement. Intracellular calcium levels were obtained by calculating the ratio of emission at 510 nm with excitation at 340 and 380 nm.
Statistical analysis.
Prism (version 5.0c, GraphPad Software) was used for statistical analysis.
RESULTS
Fendiline alters the plasma membrane localization of K-Ras but not H-Ras.
We constructed high-content screens to search for chemicals that inhibit the plasma localization of Ras proteins. To this end, we established MDCK cell lines stably expressing mGFP targeted to the plasma membrane by the full C-terminal hypervariable region (HVR) of K-Ras4B (GFP-CTK) or H-Ras (GFP-CTH) (22, 37) and MDCK cell lines stably expressing full-length oncogenic mutant GFP-K-RasG12V (4B isoform, but here referred to as K-Ras) or GFP-H-RasG12V. MDCK cells were chosen because the columnar morphology and basolateral distribution of Ras facilitate automated confocal imaging. For primary screening we used the cell lines GFP-CTK and GFP-CTH. The GFP-CTK and GFP-CTH fusion proteins undergo the same posttranslational processing and membrane trafficking as the cognate full-length Ras protein (22, 23), but since they are biologically inert, the morphology of the parental MDCK line is better preserved than in cells expressing oncogenic mutant Ras.
MDCK cells dispensed in 96-well plates were grown in the presence of each compound for 48 h before fixation and imaging. This time frame was chosen to allow trafficking of newly synthesized GFP-Ras proteins and turnover of GFP-Ras protein that was already present when treatment started. As a positive control, cells were treated with 10 μM FTI-276, a farnesyl transferase inhibitor that causes cytoplasmic localization of GFP-CTH but not GFP-CTK (Fig. 1A). Images were scored for loss of plasma membrane localization and intracellular accumulation of GFP. The aim of the screen was to identify compounds that selectively target K-Ras, and thus we were interested in compounds that significantly mislocalized GFP-CTK while having minimal or no effect on GFP-CTH. Here we report our results of screening the Prestwick chemical library, which comprises 1,120 small molecules that are currently or have been in clinical use. All of these compounds are therefore FDA-approved drugs. We screened the Prestwick library at 4 μg/ml. Several drugs that are weak amphiphilic bases, including chlorpromazine, scored weakly positive in the assay. The effect of this class of drug on K-Ras localization has been described previously (47), and the mechanism of action is believed to involve direct impairment of the electrostatic interaction of the K-Ras polybasic domain with the negatively charged inner leaflet of the plasma membrane. These compounds were not pursued further. One other compound, fendiline (Fig. 1B), significantly mislocalized GFP-CTK, had no significant effect on GFP-CTH, did not inhibit CAAX processing (see Materials and Methods), and was therefore selected for further study.
Fig 1.
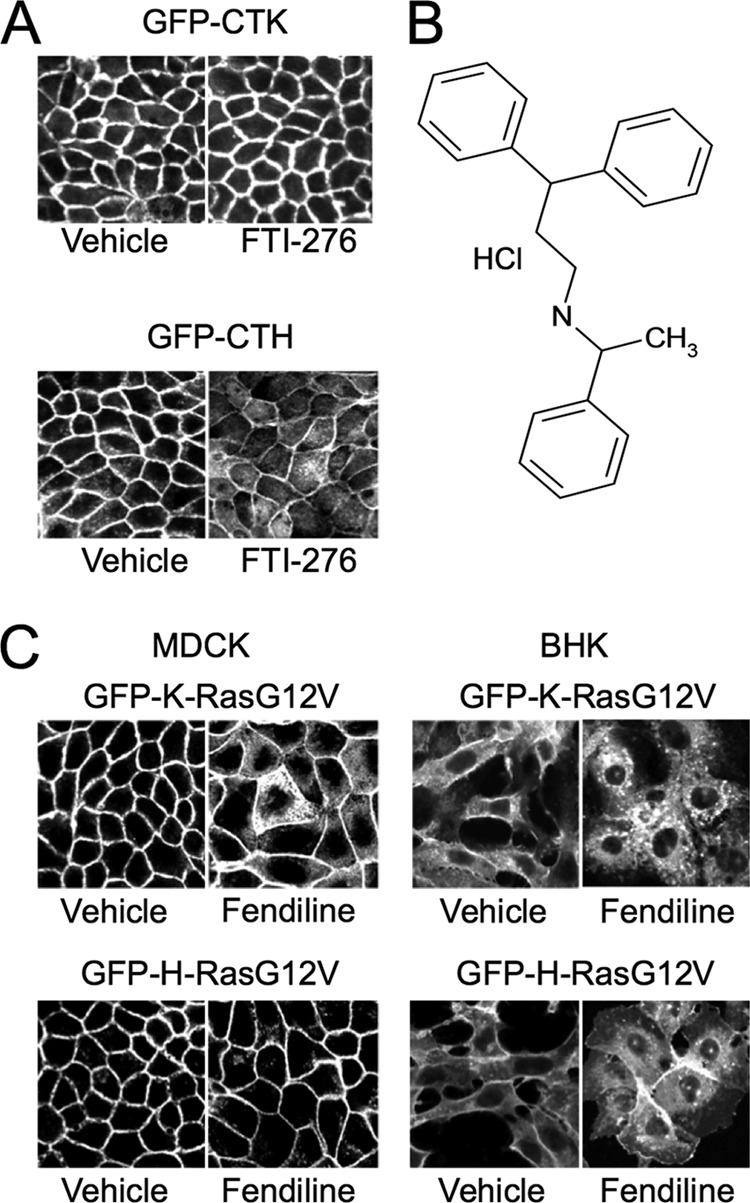
Fendiline mislocalizes GFP-K-RasG12V but not GFP-H-RasG12V. (A) MDCK cells stably expressing GFP-CTK or GFP-CTH were seeded in 96-well plates and treated with drug libraries for 48 h. Cells were then fixed and imaged using a BD Pathway Imager in confocal mode. Shown are representative images of control cells treated with vehicle (DMSO) or 10 μM FTI-276. (B) Structure of fendiline hydrochloride. (C) MDCK or BHK cells stably expressing GFP-K-RasG12V or GFP-H-RasG12V were grown on coverslips and treated with vehicle (DMSO) or fendiline (4 μg/ml = 11 μM for MDCK and 6 μg/ml = 17 μM for BHK cells) for 48 h. Cells were fixed and imaged using a confocal microscope. Shown are representative images from 3 independent experiments.
Fendiline selectively mislocalizes K-Ras to endomembranes.
We first verified that fendiline was active against full-length K-Ras in multiple cell types. MDCK and BHK cells expressing full-length GFP-K-RasG12V and GFP-H-RasG12V were treated with fendiline and examined by microscopy. Fendiline significantly mislocalized GFP-K-RasG12V but had no effect on the subcellular distribution of GFP-H-RasG12V (Fig. 1C). Fendiline also had no effect on the plasma membrane localization of GFP-N-RasG12V (not shown). We next evaluated the efficacy of fendiline in a dose-response experiment and derived a 50% inhibitory concentration (IC50) for K-RasG12V mislocalization of 9.64 ± 0.42 μM (Fig. 2A and B). Importantly, even at the highest concentration tested, fendiline did not compromise cell viability as assayed by trypan blue exclusion (Fig. 2C); thus, the loss of K-RasG12V from the plasma membrane is not due to nonspecific cell toxicity. A time course study revealed that the onset of action of fendiline is relatively slow; in cells treated with fendiline, significant K-RasG12V mislocalization required a 12-h incubation to manifest (Fig. 2D).
Fig 2.

Fendiline inhibits plasma membrane localization of K-Ras in a concentration-dependent manner. (A) MDCK cells stably expressing GFP-K-RasG12V were grown on coverslips and treated for 48 h with vehicle (DMSO) or various concentrations of fendiline. Cells were fixed and imaged using a confocal microscope. The ratio of plasma membrane K-Ras to total K-Ras was quantified by densitometric analysis using ImageJ software. (B) A representative dose-response curve from 3 independent experiments. (C) MDCK cells stably expressing GFP-K-RasG12V were treated for 48 h with vehicle (DMSO) or various concentrations of fendiline. The live/dead cell count was obtained using trypan blue staining. (D) MDCK cells stably expressing GFP-K-RasG12V were grown on coverslips and treated for up to 48 h with vehicle (DMSO) or 10 μM fendiline. Cells were fixed and imaged using confocal microscope. Shown are representative images from 3 independent experiments.
We examined the aberrant distribution of GFP-K-RasG12V in fendiline-treated cells by costaining cells for PDI, p58, and COX IV, which are ER, Golgi, and mitochondrial markers, respectively. These experiments show that in fendiline-treated cells, GFP-K-RasG12V mislocalizes in part to the ER and Golgi apparatus but not detectably to mitochondria (Fig. 3). GFP-K-RasG12V was also observed decorating cytoplasmic punctate structures (Fig. 3), which were confirmed as endosomes by electron microscopy (not shown). Cellular fractionation studies showed that treatment with fendiline increases the soluble, cytosolic fraction of GFP-K-RasG12V but does not alter the localization of GFP-H-RasG12V compared to that in the vehicle-treated control cells (Fig. 4A). Taking the data in Fig. 1 to 4 together, we conclude that whereas some K-Ras is displaced to the cytosol with fendiline treatment, the majority remains associated with intracellular membranes.
Fig 3.

Fendiline redistributes GFP-K-RasG12V to intracellular membranes. BHK cells stably expressing GFP-K-RasG12V or GFP-H-RasG12V (green) were treated with vehicle (DMSO) or fendiline (17 μM) for 48 h. Following treatment, cells were fixed and immunolabeled with antibodies against PDI (ER marker, red), p58 (Golgi marker, red), or COX IV (mitochondrial marker, red). Shown are representative images from 3 independent experiments.
Fig 4.

Fendiline but not other L-type calcium channel blockers mislocalize GFP-K-RasG12V. (A) BHK cells stably expressing GFP-K-RasG12V or GFP-H-RasG12V were treated for 48 h with vehicle (DMSO), FTI-276 (10 μM), fendiline (17 μM), nifedipine (10 μM), verapamil (10 μM), diltiazem (10 μM), or ionomycin (1 μM). Reported IC50s for calcium channel blockade are as follows: nifedipine, 0.05 to 10 μM; verapamil, 0.2 to 1 μM; diltiazem, 0.5 to 1 μM; and fendiline, 10 to 17 μM (73–78). The concentrations of calcium channel blockers used in these experiments were close to or well above their established IC50s. Following treatment, membrane (P100) and soluble (S100) protein fractions were prepared and analyzed by quantitative Western blotting. The total GFP-Ras in P100 and S100 fractions of each sample was normalized to the vehicle-treated control. Representative anti-GFP Western blots of P100 and S100 fractions are shown. The graph shows means ± SEMs from 4 independent experiments. Statistical significance was evaluated using Student's t test (*, P < 0.05). The asterisk indicates a significant reduction in P100 GFP-Ras (with concomitant increase in S100 GFP-Ras). (B) BHK cells stably expressing GFP-K-RasG12V were treated with vehicle (DMSO), nifedipine (10 μM), or ionomycin (1 μM) for 48 h. Following treatment, cells were fixed and immunolabeled with antibodies against PDI or p58.
Effect of fendiline on K-Ras localization is Ca2+ independent.
Fendiline is an inhibitor of L-type voltage-gated Ca2+ channels (48). We therefore tested whether the effect of fendiline on K-Ras localization was related to this known pharmacological activity. We first examined whether other L-type Ca2+ channel blockers had an effect similar to that of fendiline; however, neither nifedipine, verapamil, nor diltiazem, which belong to three different classes of L-type Ca2+ channel blocker, altered the localization of GFP-K-RasG12V, as assayed by subcellular fractionation or cell imaging (Fig. 4). Cells treated with fendiline show significant reorganization of endomembrane morphology, irrespective of whether the cells express GFP-Ras (Fig. 3); it is noteworthy, however, that incubation of cells in nifedipine, verapamil, diltiazem, or the calcium ionophore ionomycin (Fig. 4B and data not shown) did not cause any such change in endomembrane morphology (Fig. 4B).
The consequence of inhibiting the activity of voltage-gated L-type calcium channels is to blunt the rise in intracellular calcium levels in excitable cells on membrane depolarization. The expected effect, if any, in fibroblasts is a reduction in calcium levels, although somewhat paradoxically, fendiline has been reported to weakly elevate intracellular Ca2+ in certain nonexcitable cells (49–52). Thus, to formally exclude a role for intracellular calcium, we directly measured calcium levels in fendiline-treated cells by quantitative imaging with Fura-2AM. As a positive control for these experiments, we used the calcium ionophore ionomycin. Figure 5A shows that 1 μM and 10 μM ionomycin acutely increased intracellular Ca2+ in BHK cells. The increase induced by 10 μM ionomycin was greater than with 1 μM ionomycin and was sustained over the 30-min observation window; in contrast, the weaker response to 1 μM ionomycin decayed significantly over 30 min. In contrast, fendiline induced no changes in intracellular Ca2+ under the same experimental conditions. Furthermore, no changes in basal calcium levels were detected after 48 h of incubation in fendiline or 1 μM ionomycin (Fig. 5B); the latter result is not unexpected given the decaying response seen over a 30-min interval (Fig. 5A). Similarly, none of the other Ca2+ channel blockers, i.e., nifedipine, verapamil, and diltiazem, had any effect on basal Ca2+ levels following 48 h of treatment (Fig. 5B). A 48-h incubation in 10 μM ionomycin was toxic to cells, and so no Ca2+ assay was possible.
Fig 5.

The mechanism of action of fendiline is calcium independent. (A) BHK cells stably expressing GFP-K-RasG12V were grown on coverslips and loaded with 5 μM Fura2-AM. Cells were then washed and placed on the microscope stage of an InCyt Im Imaging workstation, and measurements were taken every 5 s during the experiment. Vehicle (DMSO) or drugs were added after 1 min (indicated in tracing as “1”); 10 μM ionomycin and 50 mM EGTA were added at 30 min and 32 min to ensure responsiveness of cells and to quench fluorescence, respectively (indicated in tracing as “2” and “3,” respectively). Intracellular calcium levels were obtained by calculating the ratio of emission at 510 nm with excitation at 340 and 380 nm. Shown are the average tracings from 30 individual cells. (B) Wild-type (WT) BHK cells or BHK cells stably expressing GFP-K-RasG12V were grown in the presence of drugs for 48 h and basal calcium levels measured in the continuing presence of drugs. The graph shows means ± SEMs from 3 independent experiments. (C) BHK cells grown on coverslips were transiently transfected with RFP-KRϕ or GFP-K-RasG12V, treated with vehicle (DMSO), ionomycin (1 μM or 10 μM), or fendiline (17 μM) for 2 min, 30 min or 48 h, fixed, and imaged using a confocal microscope. Shown are representative images from 3 independent experiments.
Acute elevation of cytosolic Ca2+ by ionophores such as ionomycin causes positively charged proteins that interact electrostatically with the inner plasma membrane to dissociate through a combination of cationic shielding of the negative surface charge of the membrane, induction of PIP2 hydrolysis, and translocation of phosphatidylserine to the outer leaflet (53). We next attempted to correlate the measured changes in intracellular Ca2+ induced by ionomycin on the localization of GFP-K-RasG12V and an electrostatic charge sensor, RFP-KRϕ, that is targeted to the inner plasma membrane by a polybasic domain interspersed with aromatic amino acids (53). Consistent with previous reports, at 2 min after addition of ionomycin, GFP-K-RasG12V and RFP-KRϕ were both displaced from the plasma membrane to cytosol, corresponding to the high intracellular Ca2+ levels at this time point (Fig. 5A and C). In cells treated with 10 μM ionomycin, GFP-K-RasG12V and RFP-KRϕ remained cytosolic at 30 min after addition, but in cells treated with 1 μM ionomycin, both proteins returned predominantly to the plasma membrane after 30 min, again correlating closely with the sustained elevation of Ca2+ with 10 μM ionomycin and the decay in Ca2+ levels with 1 μM ionomycin (Fig. 5A and C). Unlike with ionomycin, acute exposure to fendiline did not mislocalize GFP-K-RasG12V or RFP-KRϕ (Fig. 5C). After 48 h of treatment, fendiline mislocalized GFP-K-RasG12V but not RFP-KRϕ, whereas 48 h of treatment with ionomycin did not affect the localization of either construct (Fig. 5C). Taken together, the results in Fig. 4 and 5 fully recapitulate the observations of Yeung et al. (53) that elevation of intracellular calcium mislocalizes K-Ras by neutralizing plasma membrane ζ potential, but the results also show that the mechanism whereby fendiline mislocalizes K-Ras is unrelated to changes in intracellular Ca2+ or blockade of L-type Ca2+ channels and therefore represents a novel, “off-target” effect of the drug. Since fendiline is generally supplied as a racemic mixture, we synthesized and separately tested the activity of the purified R and S isomers. Interestingly, we observed that R-fendiline was significantly more potent than the racemic mixture, and, concordantly, pure S-fendiline had very little effect on K-RasG12V localization (Fig. 6A). The markedly different potencies of the two stereoisomers strongly suggest that fendiline is binding to a specific target molecule to effect K-Ras localization.
Fig 6.

Fendiline targets Ras proteins with polybasic domains. (A) MDCK cells stably expressing GFP-K-RasG12V were grown on coverslips and treated for 48 h with vehicle (DMSO) or racemic, R-, or S-fendiline (6 μM). Cells were fixed and imaged using a confocal microscope. (B) BHK cells grown on coverslips were transiently transfected with GFP-K-Ras4B, GFP-K-Ras4B CCIL, GFP-K-Ras4A, or GFP-tK, treated for 48 h with vehicle (DMSO) or fendiline (17 μM), fixed, and imaged using a confocal microscope. GFP-K-Ras4B-transfected cells were also treated with a combination of FTI (10 μM) and vehicle (DMSO) or fendiline (17 μM). (C) BHK cells grown on coverslips were transiently transfected with GFP-K-RasG12V or GFP-KRasG12V,S181A, treated for 48 h with vehicle (DMSO) or fendiline (17 μM), fixed, and imaged using a confocal microscope. (D) BHK cells grown on coverslips were transiently transfected with GFP-Rac1, GFP-Rap1A, or RFP-KRϕ and treated for 48 h with vehicle (DMSO) or fendiline (17 μM). Cells were fixed and imaged using a confocal microscope. (E) C-terminal amino acid sequences of K-Ras4A, K-Ras4B, Rac1, and Rap1A and the targeting sequence of the KRϕ probe. Basic residues are shown in blue, acidic residues in red, and palmitoylated cysteine residues in green, and aromatic residues in KRϕ, which contribute to membrane anchoring of the probe, are underlined.
Fendiline targets other Ras-related proteins with polybasic domains.
To further explore the fendiline target sequences in K-Ras, we examined efficacy against other Ras anchor constructs. Our screening experiments showed that fendiline is active against GFP-CTK and full-length GFP-K-RasG12V (Fig. 1 and 2). Figure 6B shows that fendiline also mislocalized wild-type K-Ras and GFP targeted by the minimal C-terminal anchor of K-Ras (GFP-tK). These mapping experiments identify the K-Ras polybasic domain as the target for fendiline activity. To determine if fendiline sensitivity requires the presence of a specific prenyl group in addition to the polybasic domain, we assayed efficacy against geranylgeranylated K-Ras. Geranylgeranylated K-Ras can be generated by replacing the wild-type CVIM CAAX motif of K-Ras with CCIL, a bone fide GGTase1 substrate motif (32), or by treating cells expressing K-Ras with a farnesyl transferase inhibitor to direct aberrant processing of the wild-type CVIM motif by GGTase1 (29, 30). Figure 6B shows that geranylgeranylated K-Ras generated by either method was mislocalized in fendiline-treated cells, indicating that the nature of the prenoid group on K-Ras is not important for fendiline sensitivity. Previous studies have shown that protein kinase C (PKC)-mediated phosphorylation of Ser181 in the C-terminal polybasic domain causes dissociation of K-Ras from the plasma membrane and association with endomembrane (54). We therefore tested the effect of fendiline on K-RasG12V,S181A, a mutant that is resistant to PKC phosphorylation. As with K-RasG12V, fendiline treatment mislocalized K-RasG12V,S181A to intracellular membranes (Fig. 6C), indicating that the mechanism by which fendiline causes K-Ras mislocalization does not involve phosphorylation of Ser181.
Since fendiline caused the mislocalization of the K-Ras C-terminal anchor constructs GFP-tK and GFP-CTK, we next determined if fendiline mislocalizes other Ras-related proteins with C-terminal polybasic domains. Figure 6D shows that fendiline treatment caused redistribution of the Rho family protein GFP-Rac1 and the Ras family protein GFP-Rap1A from the plasma membrane to intracellular membranes. Rac1 and Rap1A are both anchored by a combination of a polybasic domain and a geranylgeranyl group, but recent studies have shown that Rac1 is additionally palmitoylated on a cysteine residue adjacent to the polybasic domain (55). The second signal for plasma membrane targeting of Rac1 is very similar to that of the alternative K-Ras isoform K-Ras4A; the C-terminal hypervariable region of K-Ras4A has a 6+ net positive charge, compared to a 5+ net positive charge in Rac1, and both are singly palmitoylated (Fig. 6E). And as with GFP-Rac1, GFP-K-Ras4A was significantly mislocalized in fendiline-treated cells (Fig. 6B and D). As shown earlier, fendiline did not mislocalize the membrane potential probe RFP-KRϕ (53) (Fig. 5C and 6D). Taken together these results therefore indicate that in addition to a polybasic domain, the additional presence of a prenyl anchor may also be required for fendiline-mediated action.
Fendiline impairs K-Ras plasma membrane interactions.
To further quantify the reduction in K-Ras interaction with the plasma membrane, we prepared intact plasma membrane sheets from BHK cells expressing GFP-K-RasG12V or GFP-H-RasG12V treated with vehicle or fendiline. The plasma membrane sheets were labeled with anti-mGFP conjugated to 4.5-nm gold and then imaged by electron microscopy. The total amount of gold labeling of the fendiline-treated K-RasG12V sheets was reduced by ∼50% from that of the untreated control cells (Fig. 7B). Since the EM method detects only plasma membrane bound Ras, this result provides accurate quantitation of the extent of loss of K-Ras from the plasma membrane that was evident on confocal imaging. Spatial statistical analysis of the immunogold point patterns further showed that fendiline reduced the extent of K-RasG12V nanoclustering (Fig. 7A). In contrast, fendiline treatment increased the total amount of H-RasG12V on the plasma membrane (Fig. 7B) but again modestly decreased the extent of H-RasG12V nanoclustering (Fig. 7A).
Fig 7.
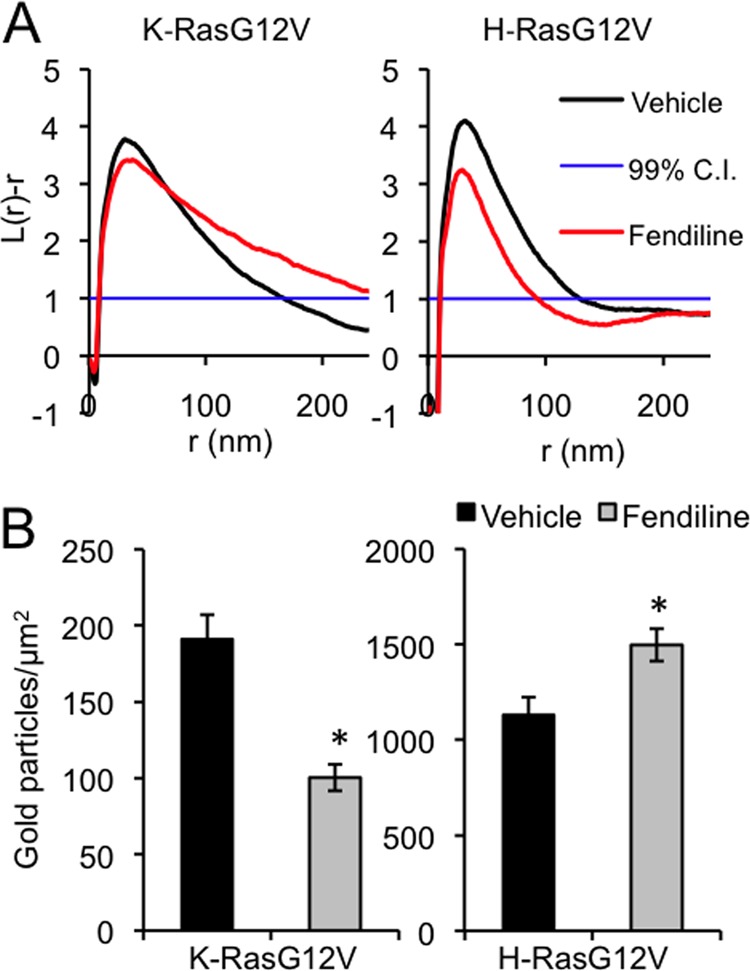
Fendiline inhibits GFP-K-RasG12V plasma membrane association and nanoclustering. Plasma membrane sheets were generated from BHK cells transiently transfected with GFP-K-RasG12V or GFP-H-RasG12V and treated with vehicle (DMSO) or fendiline (17 μM) for 48 h. Plasma membrane sheets were labeled with anti-GFP antibody conjugated to 4.5-nm gold and imaged in an electron microscope. Images were processed to remove background, and the x-y coordinates of all the gold particles in a given area were determined. (A) Ripley's K-function analysis was used to determine whether the observed gold pattern was random, clustered, or dispersed. Values of L(r) − r that are above the 99% confidence interval (CI) (normalized to 1) indicate significant clustering at that value r, values of L(r) − r in the interval +1 to −1 indicate a random pattern, and values of L(r) − r below −1.0 indicate significant dispersal. Univariate K-functions are weighted means (n ≥ 8) standardized on the 99% CI for a random pattern. Significant differences from the control pattern for fendiline-treated cells were assessed using bootstrap tests; the P values are P = 0.001 and P = 0.028 for K-RasG12V and H-RasG12V, respectively. (B) Average gold density on the immunolabeled plasma membrane sheets used for the analysis in panel A (mean ± SEM; n ≥ 8). The statistical significance of differences in gold labeling density was evaluated using Student's t test (*, P < 0.05).
Fendiline abrogates signaling downstream of constitutively active K-Ras.
Next, we explored the relationship between mislocalization of K-Ras by fendiline and signal output. We first analyzed Raf kinase activity in MDCK and BHK cells expressing full-length GFP-K-RasG12V. Raf kinase activity, measured by a coupled MEK/ERK assay, was reduced by ∼60% when the cells were treated with fendiline (Fig. 8A). A dose-response analysis of fendiline on BHK cells transformed by GFP-K-RasG12V returned IC50s of 9.49 ± 0.64 and 6.97 ± 1.24 μM, respectively, for fendiline-mediated inhibition of ERK and Akt activation (Fig. 8B). These IC50s are very similar to the IC50 derived from the K-Ras mislocalization assay (Fig. 2), consistent with a mechanistic link between displacement from the plasma membrane and abrogation of signal output. Furthermore, none of the other Ca2+ channel blockers we tested, nor ionomycin, had any effect on pMEK, pERK, and pAkt levels in K-Ras-transformed cells (Fig. 8C). In order to examine whether fendiline specifically inhibits K-Ras, we assayed cells expressing constitutively active CRaf (Flag-Raf-YY340/341DD) or the more clinically relevant constitutively active BRaf mutant (myc-BRaf-V600E). Signaling downstream of CRaf-DD was less robust than from BRaf-V600E. Fendiline had no effect on signaling downstream of constitutively active CRaf but partially inhibited signaling downstream of constitutively active BRaf (Fig. 9), consistent with the requirement for constitutively active BRaf to be recruited to the plasma membrane by Ras for full activation of MAPK (56). Taken together, these data provide strong evidence that fendiline inhibits MAPK signaling at the level of Ras.
Fig 8.
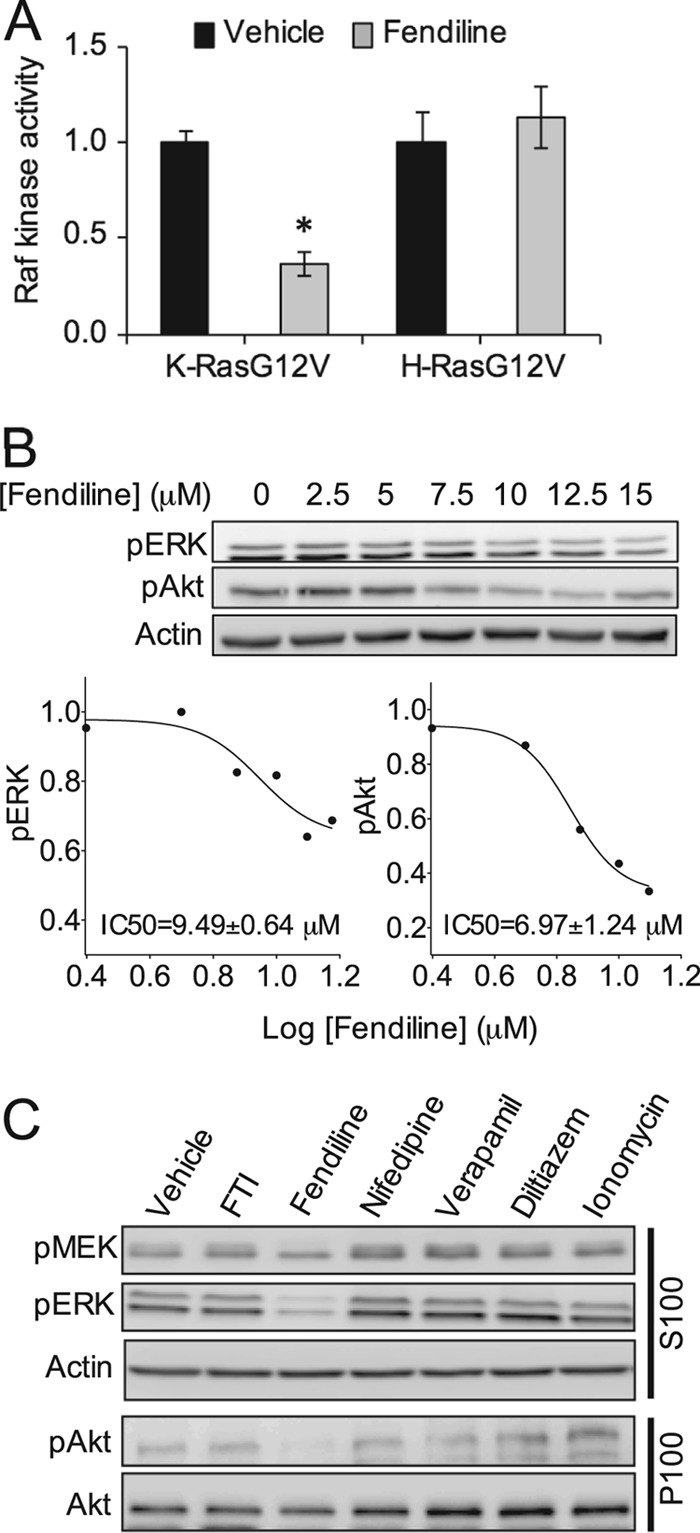
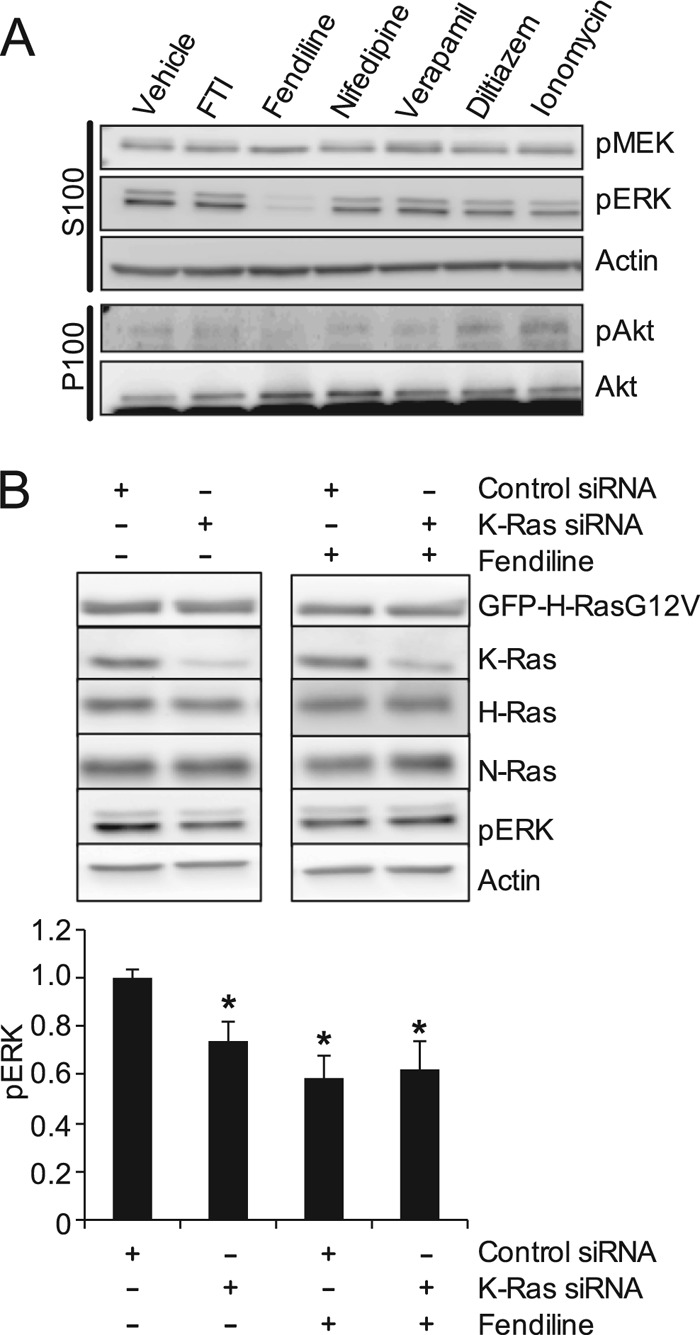
Fendiline inhibits Raf kinase activity and signaling downstream of oncogenic K-Ras. (A) BHK cells stably expressing K- or H-RasG12V were treated for 48 h with vehicle (DMSO) or fendiline (17 μM). Raf kinase activity in the P100 fractions prepared from the cells was measured in a coupled MEK/ERK kinase assay. The graph shows means ± SEMs from 3 independent experiments. Raf kinase activity was normalized to the corresponding vehicle-treated sample. (B) MDCK cells stably expressing K-RasG12V were treated with vehicle (DMSO) or various concentrations of fendiline for 48 h. Following treatment, whole-cell lysates were prepared and pERK and pAkt levels were measured by quantitative Western blotting. Representative Western blots and a representative dose-response curve from 3 independent experiments are shown; pERK and pAkt levels were normalized to the control sample. (C) BHK cells stably expressing GFP-K-RasG12V were treated with vehicle (DMSO), FTI-276 (10 μM), fendiline (17 μM), nifedipine (10 μM), verapamil (10 μM), diltiazem (10 μM), or ionomycin (1 μM) for 48 h. Following treatment, P100 and S100 fractions were prepared. pMEK and pERK levels in the S100 fraction and pAkt levels in the P100 fraction were measured by quantitative Western blotting. Actin and Akt were used as loading controls. Representative Western blots are shown.
Fig 9.
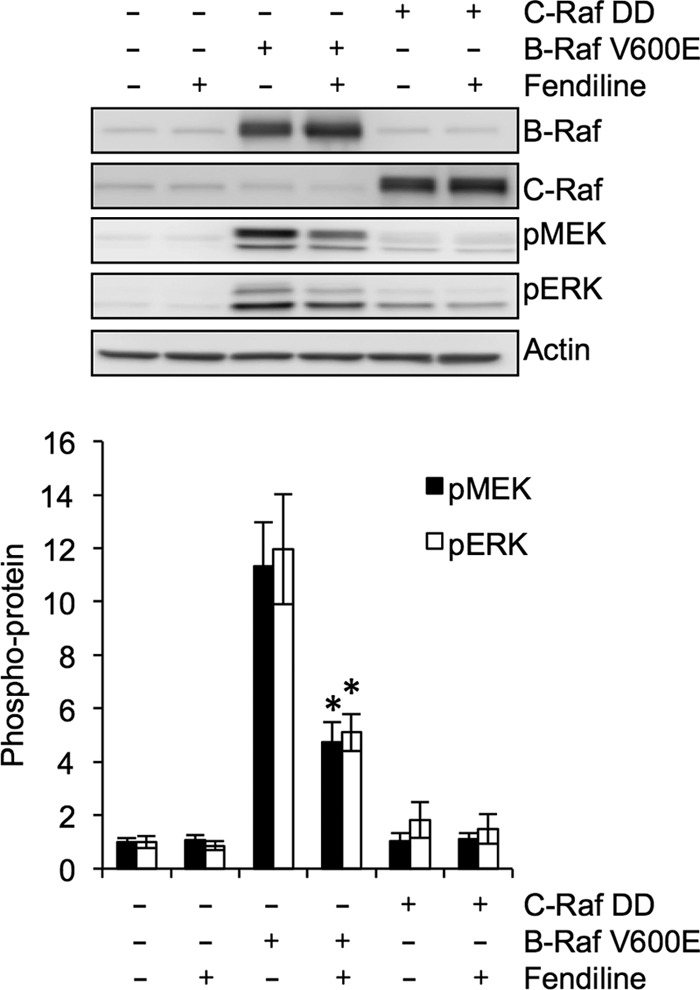
Fendiline inhibits signal transmission at the level of Ras. Whole-cell lysates from serum-starved BHK cells transiently transfected with vector control, FLAG-CRaf-DD-CAAX, or Myc-BRaf V600E and treated for 48 h with vehicle (DMSO) or fendiline (17 μM) were analyzed by quantitative Western blotting. Representative Western blots of CRaf, pMEK, pERK, and actin (loading control) are shown. The graphs show means ± SEMs from 3 or 4 independent experiments. pERK and pMEK levels were normalized to the vector-transfected, vehicle-treated control sample. Statistical significance was calculated using Student's t test (*, P < 0.05).
To further examine the isoform specificity of fendiline, we determined its effect on signaling in cells expressing constitutively active H- or N-Ras. Unexpectedly, fendiline significantly reduced pMEK, pERK, and pAkt levels in BHK and MDCK cells expressing constitutively active H-RasG12V (Fig. 10A and data not shown) but had no effect on signaling downstream of oncogenic N-Ras (data not shown). Previous studies have reported that H-Ras-mediated regulation of the MAPK cascade is in part dependent upon an autocrine mechanism (57–61). We therefore tested the hypothesis that oncogenic H-Ras signaling occurs in part through endogenous K-Ras. Using siRNA, we knocked down the expression of endogenous K-Ras in BHK cells expressing H-RasG12V and quantified pERK levels. Knockdown of endogenous K-Ras significantly reduced pERK levels in H-RasG12V-expressing cells and rendered the cells resistant to further inhibition of pERK levels on treatment with fendiline (Fig. 10B). These data suggest that endogenous K-Ras is required for the activation of signaling cascades by oncogenic H-Ras and that fendiline inhibits signaling downstream of H-RasG12V due to its inhibitory effect on endogenous K-Ras.
Fig 10.
H-RasG12V signals through endogenous K-Ras. (A) BHK cells stably expressing GFP-H-RasG12V were treated for 48 h with vehicle (DMSO), FTI-276 (10 μM), fendiline (17 μM), nifedipine (10 μM), verapamil (10 μM), diltiazem (10 μM), or ionomycin (1 μM). Following treatment, P100 and S100 fractions were prepared. pMEK and pERK levels in the S100 fraction and pAkt levels in the P100 fraction were measured by quantitative Western blotting. Actin and Akt were used as loading controls. Representative Western blots are shown. (B) BHK cells stably expressing GFP-H-RasG12V were transfected with control nontargeting siRNA or K-Ras siRNA, each containing a pool of 4 siRNAs. At 24 h after transfection, cells were treated with vehicle (DMSO) or fendiline (17 μM) for a further 48 h. Whole-cell lysates were prepared from serum-starved cells and analyzed by quantitative Western blotting. The K-Ras siRNA pool specifically knocks down the expression of endogenous K-Ras without affecting the expression of endogenous H- or N-Ras or the ectopically expressed GFP-H-RasG12V. Representative Western blots are shown. The graphs show means ± SEMs from 6 independent experiments. pERK levels were normalized to the control siRNA-transfected, vehicle-treated control sample. Statistical significance was evaluated using Student's t test (*, P < 0.05).
Fendiline inhibits proliferation of K-Ras-transformed tumor cell lines.
Finally, we tested the efficacy of fendiline to inhibit proliferation of a panel of 21 pancreatic, endometrial, lung, and colon tumor cell lines; the panel was chosen to include multiple examples of cell lines that express wild-type and oncogenic mutant K-Ras (Fig. 11A). The results show that regardless of the origin of the tumor, fendiline more potently inhibited the proliferation of tumor cells that express oncogenic mutant K-Ras than tumor cells that express wild-type K-Ras. One exception within the panel was the CaCO-2 colon cancer cell line, which despite being wild type for K-Ras was potently inhibited by fendiline. Interestingly, quantitative immunoblotting showed that K-Ras expression was ∼16-fold higher in the CaCO-2 cells than in SNU-C1 cells that were also wild type for K-Ras yet unresponsive to fendiline (Fig. 11B). It is possible that the enhanced K-Ras signaling expected from enhanced K-Ras expression accounts for the sensitivity of CaCO-2 cells to fendiline.
Fig 11.

Fendiline selectively inhibits proliferation of tumor cell lines expressing oncogenic mutant K-Ras. (A) A panel of wild-type (WT) or oncogenic mutant (Mut) K-Ras-expressing tumor cells were seeded in 96-well plates and treated for 72 h with vehicle (DMSO) or various concentrations of fendiline. The number of viable cells was quantified (absorbance at 490 nm) using the CellTiter 96 AQueous One Solution cell proliferation assay kit (Promega). The graphs show relative mean numbers of viable cells ± SEMs from 3 independent experiments. Cell lines expressing oncogenic mutant K-Ras are shown in red, and cell lines that express wild-type K-Ras are shown in black. NCI H1299 cells (shown in blue) express wild-type K-Ras but mutant N-Ras. CaCO-2 cells (shown in green) overexpress wild-type K-Ras. (B) K-Ras levels in whole-cell lysates of SNU-C1, CaCO-2, and SK-CO-1 cells were quantified by Western blotting. The graphs show means ± SEMs for 3 isolates of each cell line (indicated as 1, 2, and 3). K-Ras expression was normalized to the SNU-C1 sample.
We have shown that fendiline, by acting at the level of Ras, simultaneously inhibits multiple Ras effector pathways. We therefore investigated whether this mechanism of blocking Ras signaling is advantageous in blocking K-Ras-driven cell proliferation. K-Ras-transformed Hec1A cells were incubated with increasing concentrations of fendiline or the MEK inhibitor U0126 (Fig. 12) and the effect on cell growth and pERK levels monitored. Interestingly, although U0126 was much more potent than fendiline at inhibiting MAPK activation, fendiline was significantly more potent than U0126 at inhibiting cell proliferation (Fig. 12). Taken together, these results suggest that fendiline inhibits K-Ras-mediated proliferation of cells by blocking more than the Raf-MEK-ERK signaling axis and that concordant inhibition of parallel Ras effector pathways delivers important synergistic effects in abrogating tumor cell growth.
Fig 12.

Fendiline is more potent than a MEK inhibitor at blocking proliferation of a tumor cell line expressing oncogenic mutant K-Ras. Hec-1a cells were treated for 48 h with vehicle (DMSO) and various doses of fendiline or U0126. Medium was replaced with fresh U0126 every 24 h, whereas only a single dose of fendiline was added for the duration of the 48 h of incubation. The number of viable cells was quantified (absorbance at 490 nm) using the CellTiter 96 AQueous One Solution cell proliferation assay kit (Promega). The graph shows means ± SEMs from 3 independent experiments. Cell numbers were normalized to the corresponding vehicle-treated control. Statistical significance was calculated using Student's t test (*, P < 0.05). The pERK levels in cell lysates were quantified using Western blotting, and relative levels are shown.
DISCUSSION
In this study, we used high-content screening to identify small molecules that inhibit the trafficking or plasma membrane localization of K-Ras. We show that fendiline at therapeutic concentrations (62) significantly mislocalizes K-Ras and inhibits K-Ras signaling. Cellular fractionation coupled with fluorescence and electron microscopy imaging shows that whereas some K-Ras appears in the cytosol on fendiline treatment, the majority of K-Ras displaced from the plasma membrane is associated with intracellular membranes, including Golgi apparatus, ER, and endosomes. Since K-Ras prenylation and methylation are not affected by fendiline treatment, we conclude that fendiline must inhibit K-Ras transport or plasma membrane interactions distal to CAAX processing. Importantly, fendiline specifically affects K-Ras plasma membrane localization and has no significant effect on the subcellular distribution of H-Ras or N-Ras.
Fendiline is an FDA-approved, albeit now clinically obsolete, L-type calcium channel blocker. Our data strongly suggest, however, that the effect of fendiline on K-Ras targeting is unrelated to blockade of calcium channels, since three other classes of L-type calcium channel blocker, i.e., diltiazem, verapamil, and nifedipine, had no effect on K-Ras plasma membrane targeting. Moreover, while we fully replicated here all of the previously reported experiments of Yeung et al. (53) showing that acute elevation of intracellular Ca2+ levels dissociates K-Ras from the plasma membrane, neither acute nor chronic exposure to fendiline induced any detectable change in intracellular Ca2+ levels over time scales when K-Ras mislocalization was clearly evident. Taken together, these observations provide compelling evidence that the mechanism of action of fendiline on K-Ras targeting is calcium independent, is unrelated to the known pharmacology of the drug, and is therefore a novel off-target effect of the compound.
Previous work has shown that K-Ras can be extensively redistributed to endomembranes as a result of PKC-dependent phosphorylation of S181 in the polybasic domain. Operation of a farnesyl-electrostatic switch, results in reduced affinity of phosphorylated K-Ras for the negatively charged plasma membrane and retargeting to ER and mitochondria (54, 63). Several lines of evidence suggest that fendiline is not operating via this mechanism. We did not see colocalization of K-Ras with the mitochondrial marker COX IV in fendiline-treated cells; a K-Ras mutant with the major PKC phosphorylation site removed, K-RasS181A, was equally responsive to fendiline, and fendiline did not induce apoptosis of K-RasG12V-transformed cells, a phenotype associated with PKC-induced K-Ras redistribution (54).
Some clues to a biophysical mechanism of action are suggested by the C-terminal mapping experiments and sensitivity of other Ras-related proteins to fendiline. GFPs targeted by the minimal membrane anchor (GFP-tK) or the extended hypervariable region of K-Ras (GFP-CTK) as well as full-length wild-type and mutant K-Ras were all sensitive to fendiline, irrespective of the nature of the prenoid group attached to the CAAX box. These results identify a plasma membrane anchor comprising a prenylated polybasic domain as the minimal determinant for fendiline sensitivity. This conclusion is supported by the sensitivity of Rap1A and Rac1, which are also primarily anchored by a prenylated polybasic domain. By extrapolation, given the observed sensitivity to fendiline, we conclude that the charged hypervariable region of K-Ras4A, in addition to the palmitate group, is also critical for membrane anchoring of this Ras isoform. Together these results imply that fendiline perturbs the electrostatic interactions of polybasic domains with the electronegative inner leaflet of the plasma membrane and/or perturbs the trafficking of prenylated polybasic domain-targeted Ras proteins. The latter option cannot be discounted because plasma membrane targeting of RFP-KRϕ was unaffected by fendiline; this electrostatic charge probe is anchored by a polybasic domain that has a net charge similar to that of K-Ras but in place of a prenyl group contains three aromatic amino acids that intercalate into the lipid bilayer and provide additional membrane binding.
Additional mechanisms that are potentially involved in K-Ras plasma membrane targeting include some form of directed ER-to-plasma membrane trafficking pathway and/or a mechanism to trap K-Ras delivered to the plasma membrane by random diffusion. Once at the plasma membrane, ζ potential and availability of nanocluster scaffolds such as galectin-3 positively regulate K-Ras plasma membrane binding. Scaffolding proteins such as galectin-3 play a role in maintaining K-Ras on the plasma membrane. The reduced plasma membrane K-Ras clustering and plasma membrane localization observed in fendiline-treated cells is a partial phenocopy of both galectin-3 knockdown and treatment with S-trans,trans-farnesyl thiosalicylic acid (FTS), which accelerates the release of activated K-Ras from the plasma membrane by competing with K-Ras for a predicted prenyl residue binding pocket in galectin-3 (64, 65). We did also detect modest effects of fendiline on H-Ras clustering but with no effect on overall H-Ras plasma membrane binding, a result consistent with perturbation of lipid anchor/lipid bilayer interactions as recently observed with nonsteroidal anti-inflammatory drugs (NSAIDs) (66, 67). Two other proteins, PDEδ and PRA1, influence the dynamics of K-Ras plasma membrane interactions. PDEδ increases plasma membrane targeting of K-Ras by solubilizing K-Ras from endomembranes and facilitating cytosolic diffusion (25). Reduced PDEδ expression, however, also mislocalizes H-Ras, an effect not seen with fendiline treatment, making it unlikely that fendiline acts as a PDEδ inhibitor. PRA1 increases the rate of dissociation of K-Ras from the plasma membrane (68), and thus inhibition of PRA1-K-Ras interactions would enhance, not reduce, K-Ras plasma membrane targeting.
Whatever the precise mechanism of action of the drug, we show that fendiline-induced K-Ras mislocalization abrogates signaling downstream of oncogenic K-Ras. Specifically, we show that fendiline inhibits K-Ras-dependent Raf-MAPK and PI3K-AKT signaling; we did not assay other effector pathways, but given that fendiline directly targets K-Ras, it is reasonable to presume that signaling through all K-Ras effector pathways will be inhibited. In the case of Ras-dependent Rac activation, the ability of fendiline to mislocalize Rac1 may lead to an additional block in this pathway. The synergistic effect of simultaneous inhibition of multiple Ras effector pathways would be expected to translate into potent antitumor activity. We provide preliminary evidence for this concept by showing that fendiline is a much more potent inhibitor of tumor cell growth than a simple MEK inhibitor that solely blocks MAPK activation. More broadly, we show that fendiline potently inhibits the growth of a large set of pancreatic, colon, endometrial, and lung tumor cell lines transformed by oncogenic mutant K-Ras but generally has little or no activity against tumor cell lines that express wild-type K-Ras. Other studies have reported that fendiline causes cell death of bladder transitional carcinoma cells, PC3 human prostate cancer cells, and human oral cancer cells (49, 50, 69).
Fendiline may have additional utility as a chemotherapeutic agent in combination therapy. For example, mTOR inhibitors, including rapamycin and derivatives CCI-779, AP23573, and RAD001, are currently in clinical trials (70). However, clinical use is somewhat limited due to activation of the MAPK cascade in cells treated with mTOR inhibitors through a feedback loop that depends on an S6K-PI3K-Ras pathway (71). Using fendiline in combination with mTOR inhibitors may abrogate the induced activation of MAPK signaling and improve treatment efficacy. Our ongoing work with endometrial cancer cell lines supports this hypothesis. Similarly, we showed recently that fendiline prevents paradoxical activation of MEK/ERK signaling in Ras transformed cells treated with BRaf inhibitors because of the ability of fendiline to reduce K-Ras levels on the plasma membrane and abrogate K-Ras nanoclustering (17). Finally, we show here that fendiline also inhibits signaling in oncogenic H-Ras-expressing cells, most likely though inhibition of endogenous K-Ras signaling. Previous studies have shown that oncogenic H-Ras requires autocrine signaling to mediate many of its oncogenic properties, through the release of transforming growth factor α (TGF-α) (57–61) and other epidermal growth factor receptor (EGFR) ligands, including amphiregulin, heparin binding EGF (HB-EGF), and β-cellulin (72). Our study provides new evidence that these autocrine-signaling loops are actually critically dependent on the K-Ras isoform.
In summary, taking together the effects of fendiline on K-Ras localization, signaling, and biological function, we propose that small molecules which inhibit the plasma localization of K-Ras merit serious consideration as anti-Ras therapeutics.
ACKNOWLEDGMENTS
This work was supported the Cancer Prevention and Research Institute of Texas (CPRIT grant RP100483). D.V.D.H. was supported by the Biomedical Discovery Training Program of the Keck Center for Interdisciplinary Bioscience Training of the Gulf Coast Consortia (NIH grant R90 DA023418). J.F.H. is the current incumbent of the John S. Dunn Distinguished University Chair in Physiology and Medicine.
We thank Mark Phillips, Sergio Grinstein, Craig Logsdon, Russell Broaddus, Karen Lu, and Bryan Hennessey for plasmids and cell lines, Roger O'Neil for help with calcium quantitation experiments, and Clifford Stephan and the John S. Dunn Gulf Coast Consortium for Chemical Genomics for assistance with the high-throughput drug screen.
Footnotes
Published ahead of print 5 November 2012
REFERENCES
- 1. Bos JL. 1989. ras oncogenes in human cancer: a review. Cancer Res. 49: 4682–4689 [PubMed] [Google Scholar]
- 2. Downward J. 2003. Targeting RAS signalling pathways in cancer therapy. Nat. Rev. Cancer. 3: 11–22 [DOI] [PubMed] [Google Scholar]
- 3. Prior IA, Lewis PD, Mattos C. 2012. A comprehensive survey of ras mutations in cancer. Cancer Res. 72: 2457–2467 [DOI] [PMC free article] [PubMed] [Google Scholar]
- 4. Corcoran RB, Settleman J, Engelman JA. 2011. Potential therapeutic strategies to overcome acquired resistance to BRAF or MEK inhibitors in BRAF mutant cancers. Oncotarget 2: 336–346 [DOI] [PMC free article] [PubMed] [Google Scholar]
- 5. Flaherty KT, Puzanov I, Kim KB, Ribas A, McArthur GA, Sosman JA, O'Dwyer PJ, Lee RJ, Grippo JF, Nolop K, Chapman PB. 2010. Inhibition of mutated, activated BRAF in metastatic melanoma. N. Engl. J. Med. 363: 809–819 [DOI] [PMC free article] [PubMed] [Google Scholar]
- 6. Greger JG, Eastman SD, Zhang V, Bleam MR, Hughes AM, Smitheman KN, Dickerson SH, Laquerre SG, Liu L, Gilmer TM. 2012. Combinations of BRAF, MEK, and PI3K/mTOR inhibitors overcome acquired resistance to the BRAF inhibitor GSK2118436 dabrafenib, mediated by NRAS or MEK mutations. Mol. Cancer Ther. 11: 909–920 [DOI] [PubMed] [Google Scholar]
- 7. Halilovic E, Solit DB. 2008. Therapeutic strategies for inhibiting oncogenic BRAF signaling. Curr. Opin. Pharmacol. 8: 419–426 [DOI] [PubMed] [Google Scholar]
- 8. Infante JR, Fecher LA, Nallapareddy S, Gordon MS, Flaherty KT, Cox DS, DeMarini DJ, Morris SR, Burris HA, Messersmith WA. 2010. Safety and efficacy results from the first-in-human study of the oral MEK 1/2 inhibitor GSK1120212. J. Clin. Oncol. 28: 2503 [Google Scholar]
- 9. Joseph EW, Pratilas CA, Poulikakos PI, Tadi M, Wang W, Taylor BS, Halilovic E, Persaud Y, Xing F, Viale A, Tsai J, Chapman PB, Bollag G, Solit DB, Rosen N. 2010. The RAF inhibitor PLX4032 inhibits ERK signaling and tumor cell proliferation in a V600E BRAF-selective manner. Proc. Natl. Acad. Sci. U. S. A. 107: 14903–14908 [DOI] [PMC free article] [PubMed] [Google Scholar]
- 10. Kefford R, Arkenau H, Brown MP, Millward M, Infante JR, Long GV, Ouellet D, Curtis M, Lebowitz PF, Falchook GS. 2010. Phase I/II study of GSK2118436, a selective inhibitor of oncogenic mutant BRAF kinase, in patients with metastatic melanoma and other solid tumors. J. Clin. Oncol. 28: 15s [Google Scholar]
- 11. Poulikakos PI, Rosen N. 2011. Mutant BRAF melanomas—dependence and resistance. Cancer Cell 19: 11–15 [DOI] [PubMed] [Google Scholar]
- 12. Poulikakos PI, Solit DB. 2011. Resistance to MEK inhibitors: should we co-target upstream? Sci. Signal. 4: pe16.doi:10.1126/scisignal.2001948 [DOI] [PubMed] [Google Scholar]
- 13. Ribas A, Flaherty KT. 2011. BRAF targeted therapy changes the treatment paradigm in melanoma. Nat. Rev. Clin. Oncol. 8: 426–433 [DOI] [PubMed] [Google Scholar]
- 14. Nazarian R, Shi H, Wang Q, Kong X, Koya RC, Lee H, Chen Z, Lee MK, Attar N, Sazegar H, Chodon T, Nelson SF, McArthur G, Sosman JA, Ribas A, Lo RS. 2010. Melanomas acquire resistance to B-RAF(V600E) inhibition by RTK or N-RAS upregulation. Nature 468: 973–977 [DOI] [PMC free article] [PubMed] [Google Scholar]
- 15. Wagle N, Emery C, Berger MF, Davis MJ, Sawyer A, Pochanard P, Kehoe SM, Johannessen CM, Macconaill LE, Hahn WC, Meyerson M, Garraway LA. 2011. Dissecting therapeutic resistance to RAF inhibition in melanoma by tumor genomic profiling. J. Clin. Oncol. 29: 3085–3096 [DOI] [PMC free article] [PubMed] [Google Scholar]
- 16. Whittaker S, Kirk R, Hayward R, Zambon A, Viros A, Cantarino N, Affolter A, Nourry A, Niculescu-Duvaz D, Springer C, Marais R. 2010. Gatekeeper mutations mediate resistance to BRAF-targeted therapies. Sci. Transl. Med. 2: 35ra41 doi:10.1126/scitranslmed.3000758 [DOI] [PubMed] [Google Scholar]
- 17. Cho K-j, Kasai RS, Park J-H, Chigurupati S, Heidorn SJ, van der Hoeven D, Plowman SJ, Kusumi A, Marais R, Hancock JF. 2012. Raf inhibitors target Ras spatiotemporal dynamics. Curr. Biol. 22: 945–955 [DOI] [PubMed] [Google Scholar]
- 18. Hatzivassiliou G, Song K, Yen I, Brandhuber BJ, Anderson DJ, Alvarado R, Ludlam MJ, Stokoe D, Gloor SL, Vigers G, Morales T, Aliagas I, Liu B, Sideris S, Hoeflich KP, Jaiswal BS, Seshagiri S, Koeppen H, Belvin M, Friedman LS, Malek S. 2010. RAF inhibitors prime wild-type RAF to activate the MAPK pathway and enhance growth. Nature 464: 431–435 [DOI] [PubMed] [Google Scholar]
- 19. Heidorn SJ, Milagre C, Whittaker S, Nourry A, Niculescu-Duvas I, Dhomen N, Hussain J, Reis-Filho JS, Springer CJ, Pritchard C, Marais R. 2010. Kinase-dead BRAF and oncogenic RAS cooperate to drive tumor progression through CRAF. Cell 140: 209–221 [DOI] [PMC free article] [PubMed] [Google Scholar]
- 20. Poulikakos PI, Zhang C, Bollag G, Shokat KM, Rosen N. 2010. RAF inhibitors transactivate RAF dimers and ERK signalling in cells with wild-type BRAF. Nature 464: 427–430 [DOI] [PMC free article] [PubMed] [Google Scholar]
- 21. Omerovic J, Laude AJ, Prior IA. 2007. Ras proteins: paradigms for compartmentalised and isoform-specific signalling. Cell. Mol. Life Sci. 64: 2575–2589 [DOI] [PMC free article] [PubMed] [Google Scholar]
- 22. Apolloni A, Prior IA, Lindsay M, Parton RG, Hancock JF. 2000. H-ras but not K-ras traffics to the plasma membrane through the exocytic pathway. Mol. Cell. Biol. 20: 2475–2487 [DOI] [PMC free article] [PubMed] [Google Scholar]
- 23. Choy E, Chiu VK, Silletti J, Feoktisitov M, Morimoto T, Michaelson D, Ivanov IE, Philips MR. 1999. Endomembrane trafficking of Ras: the CAAX motif targets proteins to the ER and Golgi. Cell 98: 69–80 [DOI] [PubMed] [Google Scholar]
- 24. Hancock JF, Paterson H, Marshall CJ. 1990. A polybasic domain or palmitoylation is required in addition to the CAAX motif to localize p21ras to the plasma membrane. Cell 63: 133–139 [DOI] [PubMed] [Google Scholar]
- 25. Chandra A, Grecco HE, Pisupati V, Perera D, Cassidy L, Skoulidis F, Ismail SA, Hedberg C, Hanzal-Bayer M, Venkitaraman AR, Wittinghofer A, Bastiaens PI. 2012. The GDI-like solubilizing factor PDEdelta sustains the spatial organization and signalling of Ras family proteins. Nat. Cell Biol. 14: 148–158 [DOI] [PubMed] [Google Scholar]
- 26. Wang G, Deschenes RJ. 2006. Plasma membrane localization of Ras requires class C Vps proteins and functional mitochondria in Saccharomyces cerevisiae. Mol. Cell. Biol. 26: 3243–3255 [DOI] [PMC free article] [PubMed] [Google Scholar]
- 27. Casey PJ, Solski PA, Der CJ, Buss JE. 1989. p21ras is modified by a farnesyl isoprenoid. Proc. Natl. Acad. Sci. U. S. A. 86: 8323–8327 [DOI] [PMC free article] [PubMed] [Google Scholar]
- 28. Hancock JF, Magee AI, Childs JE, Marshall CJ. 1989. All ras proteins are polyisoprenylated but only some are palmitoylated. Cell 57: 1167–1177 [DOI] [PubMed] [Google Scholar]
- 29. Rowinsky EK. 2006. Lately, it occurs to me what a long, strange trip it's been for the farnesyltransferase inhibitors. J. Clin. Oncol. 24: 2981–2984 [DOI] [PubMed] [Google Scholar]
- 30. Sebti SM, Der CJ. 2003. Searching for the elusive targets of farnesyltransferase inhibitors. Nat. Rev. Cancer 3: 945–951 [DOI] [PubMed] [Google Scholar]
- 31. Cox AD, Hisaka MM, Buss JE, Der CJ. 1992. Specific isoprenoid modification is required for function of normal, but not oncogenic, Ras protein. Mol. Cell. Biol. 12: 2606–2615 [DOI] [PMC free article] [PubMed] [Google Scholar]
- 32. Hancock JF, Cadwallader K, Paterson H, Marshall CJ. 1991. A CAAX or a CAAL motif and a second signal are sufficient for plasma membrane targeting of ras proteins. EMBO J. 10: 4033–4039 [DOI] [PMC free article] [PubMed] [Google Scholar]
- 33. Konstantinopoulos PA, Karamouzis MV, Papavassiliou AG. 2007. Post-translational modifications and regulation of the RAS superfamily of GTPases as anticancer targets. Nat. Rev. Drug Discov. 6: 541–555 [DOI] [PubMed] [Google Scholar]
- 34. Hancock JF. 2003. Ras proteins: different signals from different locations. Nat. Rev. Mol. Cell Biol. 4: 373–384 [DOI] [PubMed] [Google Scholar]
- 35. Hancock JF, Parton RG. 2005. Ras plasma membrane signalling platforms. Biochem. J. 389: 1–11 [DOI] [PMC free article] [PubMed] [Google Scholar]
- 36. Willumsen BM, Christensen A, Hubbert NL, Papageorge AG, Lowy DR. 1984. The p21 ras C-terminus is required for transformation and membrane association. Nature 310: 583–586 [DOI] [PubMed] [Google Scholar]
- 37. Prior IA, Harding A, Yan J, Sluimer J, Parton RG, Hancock JF. 2001. GTP-dependent segregation of H-ras from lipid rafts is required for biological activity. Nat. Cell Biol. 3: 368–375 [DOI] [PubMed] [Google Scholar]
- 38. Clarke S, Vogel JP, Deschenes RJ, Stock J. 1988. Posttranslational modification of the Ha-ras oncogene protein: evidence for a third class of protein carboxyl methyltransferases. Proc. Natl. Acad. Sci. U. S. A. 85: 4643–4647 [DOI] [PMC free article] [PubMed] [Google Scholar]
- 39. Gutierrez L, Magee AI, Marshall CJ, Hancock JF. 1989. Post-translational processing of p21ras is two-step and involves carboxyl-methylation and carboxy-terminal proteolysis. EMBO J. 8: 1093–1098 [DOI] [PMC free article] [PubMed] [Google Scholar]
- 40. Hancock JF, Prior IA. 2005. Electron microscopic imaging of Ras signaling domains. Methods 37: 165–172 [DOI] [PMC free article] [PubMed] [Google Scholar]
- 41. Prior IA, Muncke C, Parton RG, Hancock JF. 2003. Direct visualization of Ras proteins in spatially distinct cell surface microdomains. J. Cell Biol. 160: 165–170 [DOI] [PMC free article] [PubMed] [Google Scholar]
- 42. Ripley BD. 1977. Modelling spatial patterns. J. R. Stat. Soc. B 39: 172–192 [Google Scholar]
- 43. Diggle PJ, Mateu J, Clough HE. 2000. A comparison between parametric and non-parametric approaches to the analysis of replicated spatial point patterns. Adv. Appl. Probab. 32: 331–343 [Google Scholar]
- 44. Plowman SJ, Muncke C, Parton RG, Hancock JF. 2005. H-ras, K-ras and inner plasma membrane raft proteins operate in nanoclusters that exhibit differential dependence on the actin cytoskeleton. Proc. Natl. Acad. Sci. U. S. A. 102: 15500–15505 [DOI] [PMC free article] [PubMed] [Google Scholar]
- 45. Roy S, Lane A, Yan J, McPherson R, Hancock JF. 1997. Activity of plasma membrane-recruited Raf-1 is regulated by Ras via the Raf zinc finger. J. Biol. Chem. 272: 20139–20145 [DOI] [PubMed] [Google Scholar]
- 46. Grynkiewicz G, Poenie M, Tsien RY. 1985. A new generation of Ca2+ indicators with greatly improved fluorescence properties. J. Biol. Chem. 260: 3440–3450 [PubMed] [Google Scholar]
- 47. Eisenberg S, Giehl K, Henis YI, Ehrlich M. 2008. Differential interference of chlorpromazine with the membrane interactions of oncogenic K-Ras and its effects on cell growth. J. Biol. Chem. 283: 27279–27288 [DOI] [PubMed] [Google Scholar]
- 48. Bayer R, Mannhold R. 1987. Fendiline: a review of its basic pharmacological and clinical properties. Pharmatherapeutica 5: 103–136 [PubMed] [Google Scholar]
- 49. Huang C, Cheng J, Liu S, Chen I, Tsai J, Chou C, Tseng P, Jan C. 2009. Fendiline-evoked [Ca2+]i rises and non-Ca2+-triggered cell death in human oral cancer cells. Hum. Exp. Toxicol. 28: 41–48 [DOI] [PubMed] [Google Scholar]
- 50. Jan CR, Lee KC, Chou KJ, Cheng JS, Wang JL, Lo YK, Chang HT, Tang KY, Yu CC, Huang JK. 2001. Fendiline, an anti-anginal drug, increases intracellular Ca2+ in PC3 human prostate cancer cells. Cancer Chemother. Pharmacol. 48: 37–41 [DOI] [PubMed] [Google Scholar]
- 51. Lin MC, Jan CR. 2002. The anti-anginal drug fendiline elevates cytosolic Ca(2+) in rabbit corneal epithelial cells. Life Sci. 71: 1071–1079 [DOI] [PubMed] [Google Scholar]
- 52. Wang J, Cheng J, Chan R, Tseng L, Chou K, Tang K, Chung Lee K, Lo Y, Jan C. 2001. The anti-anginal drug fendiline increases intracellular Ca(2+) levels in MG63 human osteosarcoma cells. Toxicol. Lett. 119: 227–233 [DOI] [PubMed] [Google Scholar]
- 53. Yeung T, Terebiznik M, Yu L, Silvius J, Abidi WM, Philips M, Levine T, Kapus A, Grinstein S. 2006. Receptor activation alters inner surface potential during phagocytosis. Science 313: 347–351 [DOI] [PubMed] [Google Scholar]
- 54. Bivona TG, Quatela SE, Bodemann BO, Ahearn IM, Soskis MJ, Mor A, Miura J, Wiener HH, Wright L, Saba SG, Yim D, Fein A, Perez de Castro I, Li C, Thompson CB, Cox AD, Philips MR. 2006. PKC regulates a farnesyl-electrostatic switch on K-Ras that promotes its association with Bcl-XL on mitochondria and induces apoptosis. Mol. Cell 21: 481–493 [DOI] [PubMed] [Google Scholar]
- 55. Navarro-Lerida I, Sanchez-Perales S, Calvo M, Rentero C, Zheng Y, Enrich C, Del Pozo MA. 2012. A palmitoylation switch mechanism regulates Rac1 function and membrane organization. EMBO J. 31: 534–551 [DOI] [PMC free article] [PubMed] [Google Scholar]
- 56. Harding A, Hsu V, Kornfeld K, Hancock JF. 2003. Identification of residues and domains of Raf important for function in vivo and in vitro. J. Biol. Chem. 278: 45519–45527 [DOI] [PubMed] [Google Scholar]
- 57. Buick RN, Filmus J, Quaroni A. 1987. Activated H-ras transforms rat intestinal epithelial cells with expression of alpha-TGF. Exp. Cell Res. 170: 300–309 [DOI] [PubMed] [Google Scholar]
- 58. Ciardiello F, Kim N, McGeady ML, Liscia DS, Saeki T, Bianco C, Salomon DS. 1991. Expression of transforming growth factor alpha (TGF alpha) in breast cancer. Ann. Oncol. 2: 169–182 [DOI] [PubMed] [Google Scholar]
- 59. Hamilton M, Wolfman A. 1998. Ha-Ras and N-ras regulate MAPK activity by distinct mechanisms in vivo. Oncogene 16: 1417–1428 [DOI] [PubMed] [Google Scholar]
- 60. Hamilton M, Wolfman A. 1998. Oncogenic Ha-Ras-dependent mitogen-activated protein kinase activity requires signaling through the epidermal growth factor receptor. J. Biol. Chem. 273: 28155–28162 [DOI] [PubMed] [Google Scholar]
- 61. Oldham SM, Clark GJ, Gangarosa LM, Coffey RJ, Jr, Der CJ. 1996. Activation of the Raf-1/MAP kinase cascade is not sufficient for Ras transformation of RIE-1 epithelial cells. Proc. Natl. Acad. Sci. U. S. A. 93: 6924–6928 [DOI] [PMC free article] [PubMed] [Google Scholar]
- 62. Weyhenmeyer R, Fenzl E, Apecechea M, Rehm KD, Dyde CJ, Johnson KJ, Friedel R. 1987. Tolerance and pharmacokinetics of oral fendiline. Arzneimittelforschung 37: 58–62 [PubMed] [Google Scholar]
- 63. Plowman SJ, Ariotti N, Goodall A, Parton RG, Hancock JF. 2008. Electrostatic interactions positively regulate K-Ras nanocluster formation and function. Mol. Cell. Biol. 28: 4377–4385 [DOI] [PMC free article] [PubMed] [Google Scholar]
- 64. Elad G, Paz A, Haklai R, Marciano D, Cox A, Kloog Y. 1999. Targeting of K-Ras 4B by S-trans,trans-farnesyl thiosalicylic acid. Biochim. Biophys. Acta 1452: 228–242 [DOI] [PubMed] [Google Scholar]
- 65. Shalom-Feuerstein R, Plowman SJ, Rotblat B, Ariotti N, Tian T, Hancock JF, Kloog Y. 2008. K-ras nanoclustering is subverted by overexpression of the scaffold protein galectin-3. Cancer Res. 68: 6608–6616 [DOI] [PMC free article] [PubMed] [Google Scholar]
- 66. Zhou Y, Cho KJ, Plowman SJ, Hancock JF. 2012. Nonsteroidal anti-inflammatory drugs alter the spatiotemporal organization of ras proteins on the plasma membrane. J. Biol. Chem. 287: 16586–16595 [DOI] [PMC free article] [PubMed] [Google Scholar]
- 67. Zhou Y, Plowman SJ, Lichtenberger LM, Hancock JF. 2010. The anti-inflammatory drug indomethacin alters nanoclustering in synthetic and cell plasma membranes. J. Biol. Chem. 285: 35188–35195 [DOI] [PMC free article] [PubMed] [Google Scholar]
- 68. Bhagatji P, Leventis R, Rich R, Lin CJ, Silvius JR. 2010. Multiple cellular proteins modulate the dynamics of K-ras association with the plasma membrane. Biophys. J. 99: 3327–3335 [DOI] [PMC free article] [PubMed] [Google Scholar]
- 69. Jan CR, Yu CC, Huang JK. 2001. Dual effect of the antianginal drug fendiline on bladder female transitional carcinoma cells: mobilization of intracellular Ca2+ and induction of cell death. Pharmacology 62: 218–223 [DOI] [PubMed] [Google Scholar]
- 70. Wander SA, Hennessy BT, Slingerland JM. 2011. Next-generation mTOR inhibitors in clinical oncology: how pathway complexity informs therapeutic strategy. J. Clin. Invest. 121: 1231–1241 [DOI] [PMC free article] [PubMed] [Google Scholar]
- 71. Carracedo A, Ma L, Teruya-Feldstein J, Rojo F, Salmena L, Alimonti A, Egia A, Sasaki AT, Thomas G, Kozma SC, Papa A, Nardella C, Cantley LC, Baselga J, Pandolfi PP. 2008. Inhibition of mTORC1 leads to MAPK pathway activation through a PI3K-dependent feedback loop in human cancer. J. Clin. Invest. 118: 3065–3074 [DOI] [PMC free article] [PubMed] [Google Scholar]
- 72. Dlugosz AA, Cheng C, Williams EK, Darwiche N, Dempsey PJ, Mann B, Dunn AR, Coffey RJ, Jr, Yuspa SH. 1995. Autocrine transforming growth factor alpha is dispensible for v-rasHa-induced epidermal neoplasia: potential involvement of alternate epidermal growth factor receptor ligands. Cancer Res. 55: 1883–1893 [PubMed] [Google Scholar]
- 73. Larsson-Backstrom C, Arrhenius E, Sagge K. 1985. Comparison of the calcium-antagonistic effects of terodiline, nifedipine and verapamil. Acta Pharmacol. Toxicol. (Copenh) 57: 8–17 [DOI] [PubMed] [Google Scholar]
- 74. Nawrath H, Klein G, Rupp J, Wegener JW, Shainberg A. 1998. Open state block by fendiline of L-type Ca++ channels in ventricular myocytes from rat heart. J. Pharmacol. Exp. Ther. 285: 546–552 [PubMed] [Google Scholar]
- 75. Opie LH. 1987. Calcium channel antagonists. I. Fundamental properties: mechanisms, classification, sites of action. Cardiovasc. Drugs Ther. 1: 411–430 [DOI] [PubMed] [Google Scholar]
- 76. Schreibmayer W, Tripathi O, Tritthart HA. 1992. Kinetic modulation of guinea-pig cardiac L-type calcium channels by fendiline and reversal of the effects of Bay K 8644. Br. J. Pharmacol. 106: 151–156 [DOI] [PMC free article] [PubMed] [Google Scholar]
- 77. Thomas G, Gurung IS, Killeen MJ, Hakim P, Goddard CA, Mahaut-Smith MP, Colledge WH, Grace AA, Huang CL. 2007. Effects of L-type Ca2+ channel antagonism on ventricular arrhythmogenesis in murine hearts containing a modification in the Scn5a gene modelling human long QT syndrome 3. J. Physiol. 578: 85–97 [DOI] [PMC free article] [PubMed] [Google Scholar]
- 78. Zahradnik I, Minarovic I, Zahradnikova A. 2008. Inhibition of the cardiac L-type calcium channel current by antidepressant drugs. J. Pharmacol. Exp. Ther. 324: 977–984 [DOI] [PubMed] [Google Scholar]