


Abstract
More and more evidences demonstrate that the long non-coding RNAs (lncRNAs) play many key roles in diverse biological processes. There is a critical need to annotate the functions of increasing available lncRNAs. In this article, we try to apply a global network-based strategy to tackle this issue for the first time. We develop a bi-colored network based global function predictor, long non-coding RNA global function predictor (‘lnc-GFP’), to predict probable functions for lncRNAs at large scale by integrating gene expression data and protein interaction data. The performance of lnc-GFP is evaluated on protein-coding and lncRNA genes. Cross-validation tests on protein-coding genes with known function annotations indicate that our method can achieve a precision up to 95%, with a suitable parameter setting. Among the 1713 lncRNAs in the bi-colored network, the 1625 (94.9%) lncRNAs in the maximum connected component are all functionally characterized. For the lncRNAs expressed in mouse embryo stem cells and neuronal cells, the inferred putative functions by our method highly match those in the known literature.
INTRODUCTION
A large number of long non-coding RNAs (lncRNAs) have been identified by large-scale analyses of full-length complementary DNA (cDNA) sequences (1–3), chromatin-state maps (4,5) or other analyses (6,7) based on RNA-seq data (8). LncRNAs are involved in diverse cellular processes, such as cell differentiation, imprinting control, immune responses, human diseases and tumorigenesis. See (9–13) for more details. In the genome-wide analysis of lncRNA stability, they found out that lncRNA half-lives vary over a wide range, suggesting the existence of complex metabolism and widespread functionality of lncRNAs (14). In another study by Guttman et al. (15), they provided an emerging model where lncRNAs might achieve regulatory specificity through modularity, assembling diverse combinations of proteins and possibly RNA and DNA interactions. All of these suggest the diversity and complexity of lncRNA functions.
Investigating the functions of lncRNAs is important in uncovering the mechanisms of biological processes. However, the functions of most lncRNAs remain to be determined. Functional characterization of lncRNAs is a challenging task. First, our knowledge on lncRNAs is limited; even the functional elements in the primary sequence of non-coding genes, if exist, remain unknown (16). Second, the poor sequence conservation of lncRNAs (17) makes it difficult to infer putative functions for lncRNAs by genomic comparison. Third, the lack of collateral information, such as molecular interaction data and expression profiles, also hampers the functional annotation of lncRNAs. Fourth, to examine the functions of lncRNAs based on their secondary-structure information is still infeasible because of the little associations between functions and secondary-structure for lncRNAs (18).
Previous work on function prediction of lncRNAs has been almost exclusively based on a local strategy, and only a small part of lncRNAs in their data set can be functionally characterized. Guttman et al. (4) used chromatin-state maps to identify ∼1600 long-intervening non-coding RNAs, lincRNAs, and developed an approach for function assignment of lincRNAs. By the same method, Khalil et al. (19) identified ∼3300 lincRNAs in six human cell types and further examined the associations between these lincRNAs and polycomb repressive complex 2 (PRC2). Liao et al. (20) constructed a coding–non-coding co-expression network based on gene expression data and predicted the probable functions for lncRNAs in the network. Cabili et al. (6) defined a reference catalog of >8000 human lincRNAs and functionally characterized them through co-expressions between protein-coding and non-coding genes. Although all these work have augmented our knowledge on lncRNAs, only gene expression data and local information are exploited in their methods.
Inspired by the work for protein function annotation (21), we studied in this article the possibility of exploiting a global network-based strategy to predict probable functions for lncRNAs at large scale. We developed a long non-coding RNA global function predictor (‘lnc-GFP’). In this method, a bi-colored biological network is constructed using coding–non-coding co-expression data and protein interaction data. Here, ‘bi-colored’ means the inclusion of two kinds of vertices—protein-coding and non-coding genes and the integration of two kinds of edges—co-expression and protein–protein interactions in the network. It is well known that macro molecules, such as proteins, nucleic acids and carbohydrates, are co-operating in the biological function, instead of playing roles alone. We expect that by making use of lncRNAs and protein-coding genes in our bi-colored networks, we are able to model the real biological processes as accurate as possible. A global propagation algorithm is designed to infer putative functions for lncRNAs at large scale in the bi-colored network. lnc-GFP is validated on protein-coding genes with known function annotations by 10-fold cross-validation tests. It achieves a precision of 90% at rank threshold 100 (i.e. genes ranked within top 100 among all the genes in the bi-colored network based on the association scores for a given function category), and it is also robust to different kinds of noise in the network. Using our method, we were able to predict putative functions for 1625 lncRNAs, covering 94.9% of all the 1713 lncRNAs in the bi-colored network of mouse. The predicted functions suggest that lncRNAs are implicated in a variety of biological processes. In the case study, the inferred putative functions for some lncRNAs expressed in mouse embryo stem cells (mESCs) and neuronal cells highly match the known literature.
MATERIALS AND METHODS
Principles of lnc-GFP
The common algorithms for protein function annotation are based on the observation that genes in the vicinity of the target gene are more likely to have identical or similar functions (21). Analogously, our method, lnc-GFP, also exploits the observation. First, a bi-colored network is constructed whose vertices are protein-coding and non-coding genes, and edges are co-expression and protein interaction. Then a global propagation algorithm is designed on the bi-colored network, which takes the known function annotations for genes as the sources of ‘function flow’. And the ‘function flow’ propagates on the network iteratively. Based on the amount of ‘function flow’ that a gene receives during the propagation process, an association score is computed for each unannotated lncRNA, measuring how much it can be annotated with a function. The scoring scheme of lnc-GFP is illustrated in Figure 1. The bi-colored network is expressed as an edge weighted graph. The weight is used to measure the confidence of the edge connecting the two vertices in the network. A final association score is used to measure how much a gene can be annotated by a given function category. The calculation of the association score considers global and local constraints imposed by the network topology. The global constraint simulates the iterative propagation of ‘function flow’ on the network, whereas the local constraint represents the previous knowledge score, which is computed based on a local ‘voting-rule’.
Figure 1.

Principles of lnc-GFP. (A) The coding–non-coding bi-colored network is represented as a graph. (B) Function T is used to compute the previous knowledge score between an unannotated lncRNA v and the given function category f. (C) Function S is used to compute the final association score between v and f based on the genes known to be annotated with f. The computation not only simulates the iterative propagation of the ‘function flow’ on the network but also considers the local constraint on behalf of previous knowledge score.
Data sources
Similar to the integration of multiple data sources for the annotation task of proteins, we integrate co-expression data and protein interaction data to construct a weighted bi-colored network in a naïve Bayesian fashion (22) as follows,
| (1) |
Here,  ,
,
 and
and  denote the weighted co-expression, the weighted protein interaction and
the weighted relation in the bi-colored network between gene i and gene
j, respectively. More details of the network construction have been
described in Supplementary
Methods.
denote the weighted co-expression, the weighted protein interaction and
the weighted relation in the bi-colored network between gene i and gene
j, respectively. More details of the network construction have been
described in Supplementary
Methods.
Regarding to the analysis of co-expression data, Liao et al. designed a strict computational pipeline to re-annotate the probes corresponding to coding and non-coding genes in the Affymetrix Mouse Genome 430 2.0 Array (Mouse 430 2.0 array). Based on re-annotated microarray data, a coding–non-coding co-expression network is constructed, where a node represents a molecule (coding or non-coding gene), and an edge represents an expressional correlation (20). In their method, the co-expression network was constructed using 34 microarray data sets and a stringent pipeline to eliminate the vast amount of ‘noise’ in microarray data and to represent all developmental stages and issues (20). As genes with similar expression patterns under multiple, but resembling, experimental conditions have a higher probability of sharing similar functions (23) or being involved in related biological pathways (24), using co-expression data is viable to capture the functional relations among protein-coding and lncRNA genes. According to the same analysis and the same microarray data used in Liao’s method, 59 173 weighted co-expressions are constructed and used in our method, which spans in 10 381 protein-coding genes defined in RefSeq database (25) and 1713 long non-coding genes defined in FANTOM3 project (26). In this paper, a lncRNA is denoted by its transcriptional framework (TK) number which is provided in FANTOM3 database. The detailed information of 1713 long non-coding genes is provided in Supplementary Table S1. To cover more and reliable protein–protein interactions in our bi-colored network, we downloaded 1 393 102 weighted protein interaction data derived from high-throughput experiments from STRING database (27) (downloaded on 5 April 2011). According to 10 381 protein-coding genes defined in the co-expression data, we remove the redundant protein–protein interactions, resulting in 29 393 protein–protein interactions in our bi-colored network. As for function category, we used the function vocabulary defined in the Gene Ontology (GO) project (28) to annotate lncRNAs by our method. The known ‘gene2go’ associations are downloaded from NCBI database (downloaded on 26 May 2011), and there are 6027 biological-process (BP) GO function terms involved in our data set of the known ‘gene2go’ associations.
Global propagation algorithm
Our global propagation algorithm is based on a semi-supervised learning algorithm (29), which has applied to prioritize disease
genes successfully (30). The input to this
algorithm consists of a set of known ‘gene2go’ annotations with a set of
function categories P, a query function category f and
the bi-colored network defined as a simple weighted undirected graph
 . In this graph, a vertex
 represents a gene, an edge
 between nodes u and
v exists if the corresponding genes are known to be connected in the
bi-colored network, and the weight function w denotes the reliability of
each edge. The goal is to rank all the unannotated genes in V with
respect to the function category f. It is assumed in our method that the
top ranked genes can be functionally annotated with function category
f.
between nodes u and
v exists if the corresponding genes are known to be connected in the
bi-colored network, and the weight function w denotes the reliability of
each edge. The goal is to rank all the unannotated genes in V with
respect to the function category f. It is assumed in our method that the
top ranked genes can be functionally annotated with function category
f.
By N(v), we denote the direct neighbors of vertex
v. Let  represent a function, quantifying the extent to which a gene v is
associated with a function category f. Here, S is called
prediction function that corresponds to the classification function for semi-supervised
learning problem. Let
represent a function, quantifying the extent to which a gene v is
associated with a function category f. Here, S is called
prediction function that corresponds to the classification function for semi-supervised
learning problem. Let  represent a previous knowledge score of function annotation, which assigns value
‘1’ to the nodes that are known to be annotated with function category
f, and otherwise a value computed by the function T.
See ‘Incorporating local function enrichment information’ section for a more
detailed description of T.
represent a previous knowledge score of function annotation, which assigns value
‘1’ to the nodes that are known to be annotated with function category
f, and otherwise a value computed by the function T.
See ‘Incorporating local function enrichment information’ section for a more
detailed description of T.
The key to semi-supervised learning problem is the previous assumption of consistency (29). In our function annotation problem, consistency means that the prediction function S is smooth over the graph G in the sense that (i) adjacent genes are assigned with similar function categories; and (ii) the similar values of function S and T should be assigned to the genes. To meet the consistency requirements, the prediction function S are expressed formally as Equation (2) with respect to function category f,
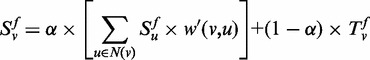 |
(2) |
where the parameter  weights the relative importance of the global and local constraints,
w′ is a normalized form of w, as is described in
the work of Vanunu et al. (30).
weights the relative importance of the global and local constraints,
w′ is a normalized form of w, as is described in
the work of Vanunu et al. (30).
With respect to all the function categories, the prediction function S can be rewritten in matrix form as follows:
| (3) |
where W′ is a |V| × |V| normalized adjacent matrix of weighted graph G, S is a |P| × |V| association score matrix and T is a |P| × |V| matrix representing previous knowledge of ‘gene2go’.
An iterative process (30) is applied to compute the prediction function S as follows,
| (4) |
where  .
This iterative computation is guaranteed to converge to the system’s solution (29,31,32).
.
This iterative computation is guaranteed to converge to the system’s solution (29,31,32).
Finally, given a function category, all the genes are ranked according to the association scores with it. The top ranked genes are annotated with the given function category.
In the literature, there are many wonderful works on function prediction for proteins based on network (21). To infer candidate functions for as many as possible lncRNAs in the bi-colored network, we draw inspiration from the work of function prediction for proteins (21) to develop a global propagation-based method to predict probable functions for lncRNAs. Sharan et al. surveyed the growing body of work on functional annotation of proteins through their network of interactions. According to their analysis (21), the Markov random field method of Deng et al. (33) outperformed the other three methods (34–36) by a significant margin, whereas the others exhibited similar performance. In the current work, we have applied a simple global propagation method instead. The chief reason is that our bi-colored network, containing two kinds of genes (coding or non-coding), is a heterogeneous network, and consequently, standard golden data for lncRNA function annotation are absent, which are critical for parameter estimation in Markov random field method. Our propagation method simulates the information flow in the network where genes with known function annotation propagate the information to its neighbors iteratively. As all the genes in the connected network can receive information flowed into them, our method can functionally characterize as many genes as possible.
Incorporating local function enrichment information
Akin to the work of function prediction for proteins (37), in which the number of times each function annotation occurs in all neighboring proteins of each protein is used as the confidence score for a particular function, we compute a primary score for each association between function category and gene based on a ‘voting-rule’. A scoring function T based on the primary voting score is then defined to represent the previous knowledge score as follows:
Primary voting score. When a gene is not known to be annotated with a function category, the primary voting score for the association between the gene and the function category is defined as the fraction of neighboring genes that are annotated with the function. For a gene, the primary voting score and the final previous knowledge score are set to “1” if the gene is known to be annotated with a function.
Previous knowledge score. For a given function category f and a gene v, which is not annotated with f,
 denotes the number of neighboring
genes of gene v, which are annotated with f,
N(v) is the number of neighboring genes,
σ is a user defined parameter and the function
T is defined in Equation (5) to compute the previous knowledge score between gene v
and function f.
denotes the number of neighboring
genes of gene v, which are annotated with f,
N(v) is the number of neighboring genes,
σ is a user defined parameter and the function
T is defined in Equation (5) to compute the previous knowledge score between gene v
and function f.
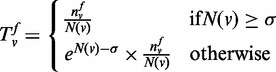 |
(5) |
Parameter tuning for function prediction
There are three parameters in our propagation algorithm: the parameter α, the parameter σ and the number of iterations. In the following, we describe their roles and the details about their tuning.
The parameter α is used in the prediction function S to give the relative importance of global and local constraints, which simulates information flow and the previous knowledge, respectively. In cross-validation test, we randomly choose 1000 genes with known function annotations and removed their function annotation. Then, the algorithm is applied to predict probable functions for these 1000 genes with different values for the parameter α. It was found out that setting α to the value within the interval (0.1–0.9), our method can give similar performance, and setting α to the ‘0.618’ can give a slightly better performance. And this is shown in Supplementary Figure S1.
The parameter σ serves as the threshold for the degree of a gene (i.e. N(v)) and is used in the function T to compute previous knowledge on function annotation. In the definition of function T, not only the ratio of
 to
N(v) but also the magnitude of
N(v) are considered. The ratio of
to
N(v) but also the magnitude of
N(v) are considered. The ratio of
 to
N(v) for the genes with a small number of
neighbors should be treated carefully (e.g. consider a gene with only one neighbor
that is annotated with function f. Although the ratio of
to
N(v) for the genes with a small number of
neighbors should be treated carefully (e.g. consider a gene with only one neighbor
that is annotated with function f. Although the ratio of
 to
N(v) is ‘1’, it is not reasonable to
set the previous knowledge score as ‘1’). Similar cross-validation tests
to those used for tuning the parameter α as aforementioned
are applied to tune the parameter σ. The overall performance
is not sensitive to the choice of σ. In our method, setting
σ = 5 can give a good performance (shown in
Supplementary Figure S1). As for the choice of ‘5’ other
than other larger or smaller number, it is a trade-off between global prediction and
local previous knowledge (i.e. to predict functions for as many lncRNAs as possible
based on global propagation and also consider the local function annotation of
neighbors).
to
N(v) is ‘1’, it is not reasonable to
set the previous knowledge score as ‘1’). Similar cross-validation tests
to those used for tuning the parameter α as aforementioned
are applied to tune the parameter σ. The overall performance
is not sensitive to the choice of σ. In our method, setting
σ = 5 can give a good performance (shown in
Supplementary Figure S1). As for the choice of ‘5’ other
than other larger or smaller number, it is a trade-off between global prediction and
local previous knowledge (i.e. to predict functions for as many lncRNAs as possible
based on global propagation and also consider the local function annotation of
neighbors).The number of iterations. The mean square deviation of the adjacent prediction score matrices, set as ‘1.0E-5’, is used to control the iterative computation, that is, once the mean square deviation of St + 1 and St is no >‘1.0E-5’, the iterative computation will stop. In our implementation, the prediction score matrix has a size of 6027 × 12 094, where 6027 is the number of GO terms and 12 094 is the number of genes in the bi-colored network. Hence, when the mean square deviation is no >‘1.0E-5’, the two matrices of this size can be regarded as identical; therefore, we can conclude the iterative process has converged.
Cross-validation test
The cross-validation test is used with an immediate purpose to test the performance of
lnc-GFP and is used to tune the parameters in our method. To perform cross-validation
test, a set of coding genes with known function annotations are randomly chosen, and their
function annotations are removed. Our method will be evaluated by its success rate in
reconstructing the hidden function annotations. The removed function annotations are
considered as golden standard positive (GSP) data. For each chosen gene, we also
artificially associate it with a set of function categories selected randomly from those
categories that are not known to be related with the gene. We call this set of artificial
association the golden standard negative (GSN) data. For every function category
f, the top k ranked genes are considered to be
functionally characterized by f in our method. The part of GSP data
within the top k prediction results are regarded as the true positive
(TP) data, the other part of GSP as false negative (FN) data, and the part of GSN data
within the top k prediction results are regarded as false positive (FP)
data, the other part of GSN as true negative (TN) data. Our function predictor lnc-GFP is
evaluated in terms of precision and recall when varying the rank threshold
 . The precision and recall are defined as
follows:
. The precision and recall are defined as
follows:
| (6) |
The measures used here are similar to that in function prediction. In function prediction for proteins, several measures have been suggested to evaluate the quality of an annotation method (33,36). The evaluation is based on measuring the precision and recall of an annotation method and is performed in a leave-one-out cross-validation test (i.e. the known annotation of a single protein is hidden, one at a time, and is predicted using the network and the annotations of all other proteins), taking into account multiple annotations per protein. Here in our method, n-fold cross-validation test are used to evaluate the performance of algorithm (i.e. first, all the genes with known annotations are divided into n parts evenly, then the function annotations for one part of genes are removed and predicted based on the annotations of all other parts of genes. The average precision and recall of n tests are used to measure the performance). In these tests, randomized bi-colored networks are used in the experiments, which are described in the Supplementary Methods.
RESULTS
Topological structure analysis of the bi-colored network
In this network, there were 87 874 edges (59 173 co-expressions, 29 393 protein–protein interactions and 692 both co-expression and protein–protein interaction) covering 12 094 genes (including 10 381 protein-coding genes and 1713 lncRNAs), which is shown in Figure 2B. The maximum connected subnetwork of the bi-colored network and a small part of it are shown in Figure 2A. The degree distribution of the bi-colored network obeys a power law distribution, that is, the bi-colored network is a scale-free network, which is also depicted in Figure 2C.
Figure 2.

Coding–non-coding bi-colored biological network. (A) A maximum connected subnetwork of the bi-colored network of mouse is shown; here, the red node represents protein coding gene and the green node represents lncRNA, the blue line represents co-expression between two genes, the light blue line represents co-expression and protein interaction between two genes and the black line represents protein interaction between two genes. (B) The distribution of ‘co-expression’ edges and ‘protein interaction’ edges in the bi-colored network. (C) The degree distribution of the bi-colored network. Here, k is degree, P(k) denotes the probability with a degree k. (D) Superior performance of our bi-colored network.
The effects of incorporating protein interaction data
In the bi-colored network, there are 692 edges covered by co-expression and protein interaction. This number is small in comparison with the number of edges, 87 874; therefore, the constructed bi-colored network is not biased to the gene relations described by the co-expressions data among protein-coding genes. In fact, the incorporating of the protein interaction data makes the density of the network larger than before. The protein interaction data are able to facilitate the propagation of ‘function flow’ in the network and help improve the effectiveness of our method of function prediction for lncRNAs. To confirm this, lnc-GFP is applied to the bi-colored network, co-expression network and co-expression network integrated with randomized protein interaction data. The influences of the integration of protein interaction data and co-expression are analyzed, and the results are depicted in Figure 2D. The performance of lnc-GFP in the three networks is tested by cross-validation tests on 1000 protein-coding genes with known functions. The result of our method for the bi-colored network is better than the co-expression network. For rank threshold 50, lnc-GFP can achieve a precision of 95% in the bi-colored network and 83% in the co-expression network. To further evaluate the influence of protein interaction data, we randomize the protein interaction data completely and construct a ‘false’ bi-colored network by integrating randomized protein interaction data. Experiments show that the performance of our method drops sharply for the ‘false’ bi-colored network. All the experiments show the power of the integration of gene expression data and protein interaction data in the bi-colored network.
Performance of lnc-GFP
We perform experiments with 2-, 3-, 5-, and 10-fold cross-validation. All our
cross-validation tests give qualitatively similar results. In a single n-fold
cross-validation test, we remove the known function annotations for one part of randomly
chosen annotated protein-coding genes, then lnc-GFP is evaluated by the performance of
reconstructing the hidden function annotations in terms of overall precision versus recall
when varying the rank threshold  .
The precision is the fraction of the true ‘gene2go’ annotations ranked within
the top k in the corresponding trial of the cross-validation procedure,
and recall is the fraction of the hidden annotations that are recovered as one of the top
k. The result of cross-validation tests are depicted in Figure 3A. With respect to the result of 10-fold
cross-validation test, lnc-GFP can achieve a precision of 94% for the rank
threshold 20. Even for rank threshold 1000, a precision of 74% and a recall of
37% are still achieved. The use of the rank threshold 1000 is a trade-off of
precision and recall for the performance of our algorithm, and we will use this threshold
in function prediction for lncRNAs for further analysis and evaluation later.
.
The precision is the fraction of the true ‘gene2go’ annotations ranked within
the top k in the corresponding trial of the cross-validation procedure,
and recall is the fraction of the hidden annotations that are recovered as one of the top
k. The result of cross-validation tests are depicted in Figure 3A. With respect to the result of 10-fold
cross-validation test, lnc-GFP can achieve a precision of 94% for the rank
threshold 20. Even for rank threshold 1000, a precision of 74% and a recall of
37% are still achieved. The use of the rank threshold 1000 is a trade-off of
precision and recall for the performance of our algorithm, and we will use this threshold
in function prediction for lncRNAs for further analysis and evaluation later.
Figure 3.

Performance of lnc-GFP. (A) The performance of lnc-GFP in cross-validation tests. (B) The performance of lnc-GFP in noisy bi-colored networks with part of edges randomized. (C) The performance of lnc-GFP in noisy bi-colored networks with part of edges deleted.
The robustness analysis is also performed by adding noise to the bi-colored network. Specifically, the noisy bi-colored networks are constructed with 1/10, 2/10, 3/10, 4/10 and 5/10 edges randomized in the original bi-colored network. The cross-validation test is repeated 10 times in every kind of noisy bi-colored network on the 1000 annotated protein-coding genes, and the average performance of 10 repeated tests in every kind of noisy bi-colored network is evaluated. The average performance in 10 completely randomized bi-colored networks is also evaluated. The results are compared with that in original bi-colored network and are shown in Figure 3B. In the noisy network with 1/10 edges randomized, the performance is slightly inferior to that in the original bi-colored network. As for the rank threshold 15, lnc-GFP achieves a precision of 97.2% in the noisy bi-colored network with 1/10 edges randomized, which is slightly smaller than that of 97.8% in the original bi-colored network. The results of lnc-GFP in other noisy networks with 2/10, 3/10, 4/10 and 5/10 edges randomized, even the completely randomized bi-colored network are also analyzed. It is in line with our expectations that the noisier the network is, the worse is the prediction performance.
Furthermore, we apply lnc-GFP for ‘edge-deleted’ noisy networks with part of edges deleted. With 1/10, 2/10, 3/10, 4/10 and 5/10 edges in the bi-colored network deleted, the corresponding noisy bi-colored networks are constructed. The same cross-validation test as aforementioned is repeated 10 times for each kind of noisy bi-colored network. The average performance in terms of precision versus recall for each noisy network is evaluated and the results are depicted in Figure 3C. Although with 1/10, 2/10 or 3/10 edges deleted, the performance is slightly inferior to that in the original bi-colored network, with 4/10 and 5/10 edges removed, the performance drops sharply. All the experiments show that lnc-GFP is robust to the ‘deletion noise’ in the network. This can be attributed to the property of the global propagation method—as long as the network is connected, the ‘function flow’ can propagate effectively.
Function prediction for lncRNAs
lncRNAs are involved in diverse biological processes
Our function predictor lnc-GFP is applied to infer putative functions for all the lncRNAs characterized in the bi-colored network of mouse. Given a function category (a GO term), the association score with each gene is calculated. All the genes are ranked based on the association scores with the given function. The given function category is assigned to the lncRNAs among the top ranked genes. Here, we set a rank threshold 1000, and assign the corresponding functions to the lncRNAs ranked within top 1000. In total, 1625 lncRNAs in the maximum connected subnetwork of the bi-colored network are functionally characterized successfully. The function annotations for these 1625 lncRNAs, ‘R1000_MCS’ (maximum connected subnetwork), will be analyzed further and are available on request.
The prediction results for these 1625 lncRNAs show that they may be involved in diverse biological processes. In ‘R1000_MCS’, there are 5984 of the 6027 GO terms ascribed to lncRNAs, and with a rank threshold 100, there are also 5284 GO terms involved in the function annotation for lncRNAs. To further analyze the diversity of the GO terms with which the lncRNAs are associated, the level of a GO term in the tree-like organized GO vocabulary system is also considered. The deeper the level of a GO term is, the more specific is the GO term. The statistics of the GO terms and the lncRNAs in ‘lnc2go’ associations are depicted in Figure 4 for rank thresholds. As shown in Figure 4 for the rank threshold 100, there are 1300 lncRNAs involved in 5284 GO terms, and the level for 87.7% of these GO terms is >3. Based on the GO slims, a cut-down versions of GO (28), and ‘R1000_MCS’, we constructed ‘lnc2goSlim’ associations (details are described in Supplementary Methods). A function atlas for the 1625 lncRNAs is drawn based on ‘lnc2goSlim’ map and is shown in Supplementary Figure S2. As the lncRNAs can act in cis or in trans regulation (38), the lncRNAs are divided into three classes according to their genomic loci relative to the protein-coding genes, that is, ‘intergenic-lncRNA’, which lie in the intergenetic region of coding genes, ‘intron-lncRNA’ in the intron of a coding gene and ‘overlap-lncRNA’ that overlaps with or is close to a coding gene. The details of our classification are described in the Supplementary Methods. To investigate the difference of function annotations, we draw the functional atlas for the three classes of lncRNAs based on ‘lnc2goSlim’ map. The details are shown in Supplementary Figure S3–S5. All these indicate that lncRNAs may play diverse roles in a biological process, but collectively, lncRNAs are not likely to have different roles at three kinds of distinct genomic loci. Their function annotation profile is similar to that observed for the protein-coding genes with known function annotations.
Figure 4.

LncRNAs involved in diverse GO BPs. Here, the rank denotes the rank threshold. For the given rank threshold, the number of lncRNAs and GO BPs involved in the predicted ‘lnc2go’associations are given on the top of bars.
Comparison with other methods
Computational approaches have been used in function prediction for lncRNAs (4,5,6,19,20). We compare lnc-GFP with Liao et al.’s (20) network-based method. Our method lnc-GFP inferred candidate functions for 1625 lncRNAs in the maximum connected component of the bi-colored network, and only 340 lncRNAs have been functionally characterized by Liao et al.’s method. Regarding our predicted function annotations, almost all of them are consistent with, and in many cases elaborated on, Liao et al.’s prediction results. For the details, 5776 (95.3%) of 6059 ‘lnc2go’ associations predicted by Liao et al.’s hub-based and module-based methods are consistent with ‘R1000_MCS’ by lnc-GFP. In all, 2686 (44.3%) of 6059 ‘lnc2go’ associations are predicted with more specific function categories by lnc-GFP in ‘R1000_MCS’ (e.g. when a lncRNA is predicted with a GO term A, which is a descendant of GO term B in the organized GO hierarchy, it means that the function annotation—the lncRNA annotated with GO term A, is more specific than the function annotation—the lncRNA annotated with GO term B). For example, the known lncRNA TK170500 (AK132348, Dlx1as) is assigned more specific functions than that in Liao et al.’s result, such as central nervous system projection neuron axonogenesis, brain and central nervous system development, neuron differentiation, regulation of dendrite morphogenesis, skeletal muscle fiber development and other functions related to development and differentiation. All of these are consistent with the report that Dlx1as is expressed in forebrain and in regions associated with neurogenesis in the mESCs (39).
Liao et al.’s module-based method is also re-implemented and tested on our bi-colored network, and 237 lncRNAs are functionally annotated (P = 1.0E-15). The results are also compared with ‘R1000_MCS’. The same observation as aforementioned is made for this comparison. A total of 78 (13.8%) ‘gene2go’ associations are predicted more specifically, 466 (82.2%) are perfectly consistent, 5 (0.8%) behave common ancestor GO terms and 18(3.17%) are not in ‘R1000_MCS’. The experiment shows that lnc-GFP is superior over Liao et al.’s (20) local network-based method. Especially for large-scale function prediction of lncRNAs, 94.9% lncRNAs in the network are functionally characterized by lnc-GFP in comparison with 19.8% by Liao et al.’s method, and in many cases, more specific functions are assigned for some lncRNAs by lnc-GFP. In summary, we see that lnc-GFP can predict the functions of more lncRNAs with more accurate function annotations.
In the following, we discuss the differences between our method and the ‘guilt by association’ method used by other researchers (4,6,19). Their ‘guilt by association’ method is based on a local strategy and gene expression data. The co-expression pattern between protein-coding genes and lncRNAs are mined and used to functionally characterize the lncRNAs by the functions enriched in the co-expression pattern. Our method is based on a global strategy and the multiple data sources, including the gene co-expressions and the protein interactions. The global algorithm is applied to infer putative functions for all the lncRNAs characterized in the bi-colored network. As a result, our method can perform large-scale function predictions for lncRNAs. In the study of Guttman et al. (4), they found the genes neighboring lincRNAs were strongly biased toward those encoding transcription factors and other proteins factors related to transcription. We examined our prediction results for the lncRNAs and filtered out the lncRNAs functionally annotated with the functions enriched in the neighboring genes of lincRNAs. The filtered lncRNAs are preferred to be linked together in the bi-colored network, forming a network module. The same situation occurs for the protein-coding genes annotated with these functions. The lncRNAs and the protein-coding genes can form a larger subnetwork in the bi-colored network. These subnetworks are shown in Supplementary Figure S6–S8. These functional modules may suggest the hidden functional links between the lincRNAs and their neighboring genes.
Similar work on the function annotation is also done in other areas, such as predicting
the associations between genes and specific traits for Arabidopsis
thaliana by Lee et al. (40). Their method scored every gene in the network by summing
network edge weights connecting that gene to known genes in that process. Based on the
scores, the top ranked genes are considered to be associated with that process. We
re-implemented their method and applied it to our weighted bi-colored network. The
results show that the two methods have similar performance in precision with varying
rank threshold values  , but the recall of their method is inferior to that of our method
(Supplementary
Figure S9). When the neighboring genes of a gene are associated with
specific traits, their method can easily compute a score to that gene. Their scoring
scheme favor high connected genes, and usually overlook genes whose direct neighbors are
not associated with the traits. As the method of Lee et al. (40) is applied to infer putative functions for
the lncRNAs, only 759 lncRNAs in the network are functionally characterized by 3063
function categories.
, but the recall of their method is inferior to that of our method
(Supplementary
Figure S9). When the neighboring genes of a gene are associated with
specific traits, their method can easily compute a score to that gene. Their scoring
scheme favor high connected genes, and usually overlook genes whose direct neighbors are
not associated with the traits. As the method of Lee et al. (40) is applied to infer putative functions for
the lncRNAs, only 759 lncRNAs in the network are functionally characterized by 3063
function categories.
Verified by KEGG pathway
Inspired by the work of Cui et al. (41,42), we want to see which non-coding RNAs could be intertwined with the signaling networks and signaling regulation and to further verify the obtained function prediction for the lncRNAs by lnc-GFP. We estimate it by the analysis of KEGG (43) pathway enrichment in the bi-colored network. First, all the genes in the bi-colored network are mapped to the KEGG pathways according to the involvement of the genes in the KEGG pathway (43). Then, by considering the lncRNAs with no <10 direct protein-coding neighbors and with at least one coding neighbor involved in some KEGG pathway, we estimate a lncRNA involved in a KEGG pathway with the use of the hypergeometric-distribution-based P-value of a pathway enrichment in its protein-coding neighbors. Next, we set the threshold for the P-value as 1.0E-5 to associate the lncRNA with the pathway. There are 56 lncRNAs involved in 58 KEGG pathway. The details of the lncRNAs involved in the KEGG pathways are shown in Supplementary Table S2. Based on the KEGG pathway associated with the lncRNAs, we estimate the function prediction for these 56 lncRNAs. High concordance is observed between the KEGG pathway involvement and the GO function prediction for the lncRNAs by lnc-GFP. For example, the lncRNA TK4 is inferred to be involved in T-cell receptor signaling pathway (P = 1.90464E-011), hematopoietic cell lineage pathway (P = 1.89484E-010) and primary immunodeficiency pathway (P =3.53456E-008). Interestingly, TK4 is also predicted to associate with the function category as T-cell receptor signaling pathway (rank = 58) successfully by lnc-GFP. TK4 is also involved in such GO function categories as T-cell and B-cell proliferation and differentiation, cell surface receptor linked signaling pathway, response to inflammatory and virus and immune response. All these show the perfect consistence between the GO function prediction by lnc-GFP and KEGG pathway enrichment analysis for the lncRNA TK4. Another example is about the lncRNA TK102964. It is ascribed to be involved in the neuroactive ligand–receptor interaction pathway (P = 1.14E-11), retrograde endocannabinoid signaling pathway (P =1.28E-9), nicotine addiction pathway (P = 2.34E-11), GABAergic (gamma-aminobutyric acid, GABA) synapse pathway (P = 1.27E-6) and morphine addiction pathway (P = 9.7E-7). lnc-GFP successfully annotated the lncRNA TK102964 with function categories that are related to neuron and nerve systems, which is shown in Supplementary Table S2.
Case study: lncRNAs involved in pluripotency and differentiation
LncRNAs have been implicated in some developmental events of cell (44). Recently, Guttman et al. (45) performed loss-of-function studies on most lincRNAs expressed in the mESCs and demonstrated that lincRNAs have key roles in the circuitry controlling Embryo Stem (ES) cell state. Mohamed et al. (46) identified four mESC-expressed, conserved lncRNAs, and suggested that these lncRNAs have potential roles in pluripotency. We examined our function annotations for the lncRNAs related to pluripotency and differentiation. The similarity between the lincRNAs expressed in mESCs (45) and the lncRNAs in our bi-colored network are computed by Basic Local Alignment Search Tool (BLAST) (with default parameters and E = 1.0E-10) (47). The lincRNAs similar to our lncRNAs are annotated with the function categories related to pluripotency and differentiation by lnc-GFP. For example, the lncRNA TK119380 (AK160141), also identified as linc1609 (5), is expressed in mESC and is involved in pluripotency and differentiation (45). It is interesting to note that lnc-GFP ascribes TK119380 to the related functions, including epithelial cell differentiation, mammary gland alveolus development, sinoatrial node cell differentiation and development, lateral mesodermal cell differentiation and development, secondary heart field specification and right lung morphogenesis. TK119380 is also found to be characterized with positive regulation of hepatocyte differentiation and metanephric glomerular visceral epithelial cell development. All these suggest that TK119380 is an important functional RNA molecule associated with the pluripotency and differentiation of the ESC and is implicated in diverse biological development events. The detailed function predictions for these lincRNAs are shown in Supplementary Table S3.
The study of Mohamed et al. (46) suggests that conserved Oct4-activated lncRNA TK113387 (AK028326) contributes to the regulation of mESC pluripotency and differentiation. Another study of Blackshaw et al. (48) shows that TK113387 was dynamically and specifically expressed in developing and mature retinal cells. With the method lnc-GFP, we predicted that TK113387 is associated with related functions, such as retinal bipolar neuron differentiation, eye photoreceptor cell fate commitment, retinal rod cell development, embryo development ending in birth or egg hatching, negative regulation of dendrite development and negative regulation of hepatocyte differentiation. We also predict TK113387 to be implicated in function categories as the development and differentiation of neuron system, such as forebrain neuron development, cerebellar Purkinje cell level development, striatal medium spiny neuron differentiation and central nervous system neuron differentiation. Our study further confirms the argument that the lncRNA TK113387 plays many key roles in mESCs and in developing mature retinal cells.
We filtered out GO function terms related to mESCs by text mining, and the lncRNAs that are ranked within top 100 by lnc-GFP for these filtered GO terms are also given in Supplementary Table S4. These results can give suggestions for function investigation of the lncRNAs that are probable to be involved in pluripotency and differentiation.
Case study: lncRNAs related to neuronal system and expressed in brain
Many lncRNAs have been shown to be developmentally regulated and/or expressed in specific tissues (49). For example, Mercer et al. (50) identified 849 lncRNAs that are expressed in the adult mouse brain, and they found out that the majority showed specific expression patterns in adult mouse brain. Here, we examined our function annotations for the lncRNAs characterized in the study of Mercer et al. (50). Among the identified 849 lncRNAs by Mercer et al., 29 lncRNAs exist in our bi-colored network. The function annotation for 23 of these 29 lncRNAs by lnc-GFP is highly consistent with the study of Mercer et al. For example, the three lncRNAs TK104684 (AK032694), TK16243(AK032566) and TK85669(AK046289) exhibit enriched expression in all the 11 neuroanatomical regions of mouse brain, and they are inferred to many related function terms, such as central nervous system development, neuronal action potential propagation, ear development, olfactory nerve structural organization and sleep. The function annotation for these 23 lncRNAs by lnc-GFP is provided as Supplementary Table S5. In a subsequent study by Mercer et al. (51), they observed that the lncRNAs are expressed in mouse neural stem cells, associated with neuronal and glial cell differentiation and are expressed dynamically with modification of chromatin architecture. For example, they distinguished four lncRNAs that may be involved specifically in GABAergic neuron lineage commitment by selecting non-coding RNAs upregulated during GABAergic neuron differentiation but downreguated during oligodendrocyte differentiation, and the lncRNA TK78533(AK044422) in our bi-colored network is included. Consistently, lnc-GFP ascribes TK78533 to be involved in diverse roles in neuron stem cell, which are shown in detail in Supplementary Table S6. More importantly, the lncRNA TK78533 is high scoring ranked to function categories such as positive regulation of oligodendrocyte differentiation, negative regulation of synaptic transmission, GABAergic, cell–cell adhesion involved in neuronal–glial interactions involved in cerebral cortex radial glia guided migration, cerebral cortex GABAergic interneuron differentiation and fate commitment and cerebral cortex GABAergic interneuron migration. Our method lnc-GFP also predicts the proper functions for many lncRNAs dynamically expressed in different stages of oliogodendrocyte and neuronal differentiation in their study (these lncRNAs are provided in Supplementary Table S7, and the function annotation for these data is available on request), and more case studies are described in Supplementary Methods.
We also filtered out GO function terms related to mouse brain and neurons by text mining, and the lncRNAs, which are ranked within top 100 by lnc-GFP for these filtered GO terms, are also given in Supplementary Table S8. These results can give suggestions for function investigation of the lncRNAs that are probable to be involved in mouse brain and nervous system.
More case studies are included in Supplementary Methods. Taken together, our study suggests that lncRNAs may be involved in many diverse biological functions. The prediction result of lnc-GFP may assist further investigation of the functions of the lncRNAs.
Function prediction for homologous human lncRNAs
To enhance the general interest of the scientific community, we try to transfer the
function annotation for mouse lncRNAs to any homologue lncRNA in human. To do this, we
search similar human lncRNAs to our mouse lncRNAs by BLAST tool (program with BLASTN,
 , with others default), the sequences for
human and mouse lncRNAs are downloaded from NONCODE 3.0 database (downloaded on 27
February 2012). The mouse lncRNAs and human lncRNAs are formatted as the database and
another as query to perform blastall command, respectively. A human lncRNA is considered
as a homologue of a mouse lncRNA as the similarity from human to mouse and that from
mouse to human have an identity score no <0.9 and e-value no >1.0E-10. Finally, 32
homologous lncRNAs in human have been found, which are provided in Supplementary
Table S9. Based on the function prediction for mouse lncRNAs, the
functional roles for these 32 homologous lncRNAs in human can be suggested. For example,
the human lncRNA MALAT1 is a homologue to the mouse lncRNA TK102932 (AK141413). MALAT1
depletion resulted in aberrant mitosis, with a large fraction of cells accumulating at
G2/M boundary and increased cell death (52). The lncRNA TK102932 was ascribed to such function term as negative
regulation of G2/M transition of mitotic cell cycle.
, with others default), the sequences for
human and mouse lncRNAs are downloaded from NONCODE 3.0 database (downloaded on 27
February 2012). The mouse lncRNAs and human lncRNAs are formatted as the database and
another as query to perform blastall command, respectively. A human lncRNA is considered
as a homologue of a mouse lncRNA as the similarity from human to mouse and that from
mouse to human have an identity score no <0.9 and e-value no >1.0E-10. Finally, 32
homologous lncRNAs in human have been found, which are provided in Supplementary
Table S9. Based on the function prediction for mouse lncRNAs, the
functional roles for these 32 homologous lncRNAs in human can be suggested. For example,
the human lncRNA MALAT1 is a homologue to the mouse lncRNA TK102932 (AK141413). MALAT1
depletion resulted in aberrant mitosis, with a large fraction of cells accumulating at
G2/M boundary and increased cell death (52). The lncRNA TK102932 was ascribed to such function term as negative
regulation of G2/M transition of mitotic cell cycle.
DISCUSSION
Although the mammalian genome encodes thousands of lncRNAs, only a minority have been functionally characterized in detail. Several other methods for the function annotation of the lncRNAs have been reported, but these have mainly been directed at cell line-specific or tissue-specific lncRNAs (5,6,45). A network-based prediction method is reported by Liao et al. (20), but only 340 of all the 1720 lncRNAs are functionally annotated. Function prediction for the lncRNAs in these methods is based on local function enrichment in a specific gene set. In this work, a global network-based strategy is used for the first time to predict probable functions for the lncRNAs at large scale, and a function predictor lnc-GFP is developed for lncRNAs.
A coding–non-coding bi-colored biological network is constructed based on gene expression data and protein interaction data, which is inspired by the construction of coding–non-coding co-expression network in Liao et al. (20) and many wonderful works on function prediction for proteins (21). The advantage of bi-colored network can be attributed to the better connectivity of the bi-colored network than that in co-expression network. Moreover, this may be ascribed to the exploiting of the comprehensive interactions among different types of molecules. A few of recent studies reported comprehensive interactions between RNAs and proteins (53,54). Furthermore, the physical interactions between the lncRNAs and protein complexes have been identified in several other studies (19,55). All these findings are in favor of the integration of coding–non-coding co-expression data and protein interaction data to functionally characterize the lncRNAs in the network. Of course, such interaction data can also be incorporated into the construction of bi-colored network for better function annotations of lncRNAs.
To functionally characterize as many lncRNAs as possible in the network, we designed a global propagation algorithm based on the bi-colored network in lnc-GFP. In this global propagation algorithm, local and global topological properties of every node are exploited to infer putative functions for unannotated lncRNAs based on the known function annotations. Among the 1713 lncRNAs in the bi-colored network, the 1625 (94.9%) lncRNAs in the maximum connected component are all functionally characterized. The prediction results for the lncRNAs show that they involve in diverse biological functions, but lncRNAs are not likely to have different roles relative to the three kinds of distinct genomic loci. The results also show that lnc-GFP can infer more specific functions for much more lncRNAs than other methods. The function annotations for many lncRNAs highly match those in the known literature, especially the lncRNAs expressed in ESCs and neuronal cells.
Although a global network-based strategy is successfully exploited in lnc-GFP for function annotations of lncRNAs, our method can be improved in the following directions. First, it is limited to the lncRNAs, which can be characterized in the bi-colored network. Further expanding the bi-colored network to embrace more reliable interactions between lncRNAs and other molecules may increase the power of lnc-GFP. As for exploiting gene expression data in our method, it should be considered that when different expression data sets by other studies or a small part of our expression data sets are used, how will be the final bi-colored network and the function prediction performance? According to other studies of co-expression among genes (23,56), they consider the two genes are co-expressed in at least three data sets. In our method, ‘3’ is also used to construct the co-expressions among the genes. To construct reliable co-expression relations among genes, the number of data sets used to construct the reliable co-expressions should not be too small. To further investigate the influence of the number of microarray data sets used in our method, we simulate it using only a small fraction of all 34 data sets in our method by randomly removing a fraction of co-expressions in our original co-expression relations. To do this, we randomly removed 1/10, 2/10, 3/10, 4/10 and 5/10 co-expression relations among all the genes from original weighted co-expressions and then constructed the corresponding bi-colored networks. Based on these bi-colored networks, we evaluated the performance of our method. These tests are performed on five different sets of randomly chosen protein-coding genes. And the average precision and recall are computed to evaluate the performance of our method, which are shown in Supplementary Figure S10. When lnc-GFP is applied in the bi-colored network with a fraction of co-expression removed, the performance drops slightly in comparison with that in original bi-colored network. It can be concluded that: (i) when only a small fraction of all 34 data sets are used, the final co-expression network becomes smaller and sparser than before; and (ii) the function prediction performance will drop slightly. These can be attributed that the bi-colored network becomes smaller and sparser and includes more disconnected small components than before, and all these will not be helpful in the information flow of the network. As for exploiting other data sources, we suggest that the ongoing discovery of interactions between lncRNAs and other biological molecules are valuable for the study of lncRNAs, including the function prediction. Second, in this work, not only a function predictor is provided but also an open computational framework is given. As a result, a simple global propagation method is applied. Other network-based prediction algorithms should be incorporated to acquire a better performance with a low false positive rate. Third, the GO (28) function categories are used to annotate the lncRNAs in the network, the co-relation among the GO terms may lead to the co-related function annotations for the lncRNAs. The function classification for lncRNAs is not feasible based on these co-related function annotations currently. And other function labels should be characterized for the lncRNAs in the future.
Taken together, based on a global network-based strategy, our global function predictor lnc-GFP illustrates well the power in function prediction of lncRNAs. It is expected that by computational function prediction and knock-out experiments at the same time (6), the two benefit each other and facilitate the study of lncRNAs.
SUPPLEMENTARY DATA
Supplementary Data are available at NAR Online: Supplementary Tables 1–9, Supplementary Figures 1–10, Supplementary Methods and Supplementary References [6,20,26,27,39,49,51,57–61].
FUNDING
Funding for open access charge: National Natural Science Foundation of China [No. 60933009, 91130006 and 31071137]; Beijing Municipal Natural Science Foundation [5122029]; the National Center for Mathematics and Interdisciplinary Sciences, CAS, Knowledge Innovation Program of the Chinese Academy of Sciences [KSCX2-EW-R-01]; 2010 Innovation Program of Beijing Institutes of Life Science, the Chinese Academy of Sciences [2010-Biols-CAS-0301]; National Program on Key Basic Research Project [No. 2009CB825400]; The Natural Science Foundation of Jiangsu province [BK2008231]; Sci-tech Innovation Team of Jiangsu University [2008-018-02]; and the Fundamental Research Funds for the Central Universities [K5051223005].
Conflict of interest statement. None declared.
Supplementary Material
ACKNOWLEDGEMENTS
The authors are indebted to all of their colleagues who focus much of their research efforts on the discussions about the authors work. They also thank Bingbo Wang for useful discussions on pictures and writings of this manuscript. Also thanks to Professor Yong Gao (UBC OKANAGAN) for his patient and helpful discussions. They thank editor and anonymous reviewers greatly for their time and helpful comments. That makes this article more interesting and informative.
REFERENCES
- 1.Okazaki Y, Furuno M, Kasukawa T, Adachi J, Bono H, Kondo S, Nikaido I, Osato N, Saito R, Suzuki H, et al. Analysis of the mouse transcriptome based on functional annotation of 60,770 full-length cDNAs. Nature. 2002;420:563–573. doi: 10.1038/nature01266. [DOI] [PubMed] [Google Scholar]
- 2.Ota T, Suzuki Y, Nishikawa T, Otsuki T, Sugiyama T, Irie R, Wakamatsu A, Hayashi K, Sato H, Nagai K, et al. Complete sequencing and characterization of 21,243 full-length human cDNAs. Nat. Genet. 2003;36:40–45. doi: 10.1038/ng1285. [DOI] [PubMed] [Google Scholar]
- 3.Tupy JL, Bailey AM, Dailey G, Evans-Holm M, Siebel CW, Misra S, Celniker SE, Rubin GM. Identification of putative noncoding polyadenylated transcripts in Drosophila melanogaster. Proc. Natl. Acad. Sci. USA. 2005;102:5495–5500. doi: 10.1073/pnas.0501422102. [DOI] [PMC free article] [PubMed] [Google Scholar]
- 4.Guttman M, Amit I, Garber M, French C, Lin MF, Feldser D, Huarte M, Zuk O, Carey BW, Cassady JP, et al. Chromatin signature reveals over a thousand highly conserved large non-coding RNAs in mammals. Nature. 2009;458:223–227. doi: 10.1038/nature07672. [DOI] [PMC free article] [PubMed] [Google Scholar]
- 5.Guttman M, Garber M, Levin JZ, Donaghey J, Robinson J, Adiconis X, Fan L, Koziol MJ, Gnirke A, Nusbaum C, et al. Ab initio reconstruction of cell type-specific transcriptomes in mouse reveals the conserved multi-exonic structure of lincRNAs. Nat. Biotechnol. 2010;28:503–510. doi: 10.1038/nbt.1633. [DOI] [PMC free article] [PubMed] [Google Scholar]
- 6.Cabili MN, Trapnell C, Goff L, Koziol M, Tazon-Vega B, Regev A, Rinn JL. Integrative annotation of human large intergenic noncoding RNAs reveals global properties and specific subclasses. Genes Dev. 2011;25:1915–1927. doi: 10.1101/gad.17446611. [DOI] [PMC free article] [PubMed] [Google Scholar]
- 7.Kim TK, Hemberg M, Gray JM, Costa AM, Bear DM, Wu J, Harmin DA, Laptewicz M, Barbara-Haley K, Kuersten S, et al. Widespread transcription at neuronal activity-regulated enhancers. Nature. 2010;465:182–187. doi: 10.1038/nature09033. [DOI] [PMC free article] [PubMed] [Google Scholar]
- 8.Mortazavi A, Williams BA, McCue K, Schaeffer L, Wold B. Mapping and quantifying mammalian transcriptomes by RNA-Seq. Nat. Methods. 2008;5:621–628. doi: 10.1038/nmeth.1226. [DOI] [PubMed] [Google Scholar]
- 9.Taft RJ, Pang KC, Mercer TR, Dinger M, Mattick JS. Non-coding RNAs: regulators of disease. J. Pathol. 2010;220:126–139. doi: 10.1002/path.2638. [DOI] [PubMed] [Google Scholar]
- 10.Wilusz JE, Sunwoo H, Spector DL. Long noncoding RNAs: functional surprises from the RNA world. Genes Dev. 2009;23:1494–1504. doi: 10.1101/gad.1800909. [DOI] [PMC free article] [PubMed] [Google Scholar]
- 11.Mercer TR, Dinger ME, Mattick JS. Long non-coding RNAs: insights into functions. Nat. Rev. Genet. 2009;10:155–159. doi: 10.1038/nrg2521. [DOI] [PubMed] [Google Scholar]
- 12.Gibb EA, Brown CJ, Lam WL. The functional role of long non-coding RNA in human carcinomas. Mol. Cancer. 2011;10:38. doi: 10.1186/1476-4598-10-38. [DOI] [PMC free article] [PubMed] [Google Scholar]
- 13.Koerner MV, Pauler FM, Huang R, Barlow DP. The function of non-coding RNAs in genomic imprinting. Development. 2009;136:1771–1783. doi: 10.1242/dev.030403. [DOI] [PMC free article] [PubMed] [Google Scholar]
- 14.Clark MB, Johnston RL, Inostroza-Ponta M, Fox AH, Fortini E, Moscato P, Dinger ME, Mattick JS. Genome-wide analysis of long noncoding RNA stability. Genome Res. 2012;22:885–898. doi: 10.1101/gr.131037.111. [DOI] [PMC free article] [PubMed] [Google Scholar]
- 15.Guttman M, Rinn JL. Modular regulatory principles of large non-coding RNAs. Nature. 2012;482:339–346. doi: 10.1038/nature10887. [DOI] [PMC free article] [PubMed] [Google Scholar]
- 16.Wapinski O, Chang HY. Long noncoding RNAs and human disease. Trends Cell Biol. 2011;21:354–361. doi: 10.1016/j.tcb.2011.04.001. [DOI] [PubMed] [Google Scholar]
- 17.Pang KC, Frith MC, Mattick JS. Rapid evolution of noncoding RNAs: lack of conservation does not mean lack of function. Trends Genet. 2006;22:1–5. doi: 10.1016/j.tig.2005.10.003. [DOI] [PubMed] [Google Scholar]
- 18.Pang KC, Dinger ME, Mercer TR, Malquori L, Grimmond SM, Chen W, Mattick JS. Genome-wide identification of long noncoding RNAs in CD8+ T cells. J. Immunol. 2009;182:7738–7748. doi: 10.4049/jimmunol.0900603. [DOI] [PubMed] [Google Scholar]
- 19.Khalil AM, Guttman M, Huarte M, Garber M, Raj A, Rivea Morales D, Thomas K, Presser A, Bernstein BE, Van Oudenaarden A, et al. Many human large intergenic noncoding RNAs associate with chromatin-modifying complexes and affect gene expression. Proc. Natl. Acad. Sci. USA. 2009;106:11667–11672. doi: 10.1073/pnas.0904715106. [DOI] [PMC free article] [PubMed] [Google Scholar]
- 20.Liao Q, Liu C, Yuan X, Kang S, Miao R, Xiao H, Zhao G, Luo H, Bu D, Zhao H, et al. Large-scale prediction of long non-coding RNA functions in a coding–non-coding gene co-expression network. Nucleic Acids Res. 2011;39:3864–3878. doi: 10.1093/nar/gkq1348. [DOI] [PMC free article] [PubMed] [Google Scholar]
- 21.Sharan R, Ulitsky I, Shamir R. Network-based prediction of protein function. Mol. Syst. Biol. 2007;3:88. doi: 10.1038/msb4100129. [DOI] [PMC free article] [PubMed] [Google Scholar]
- 22.Von Mering C, Jensen LJ, Snel B, Hooper SD, Krupp M, Foglierini M, Jouffre N, Huynen MA, Bork P. STRING: known and predicted proteinprotein associations, integrated and transferred across organisms. Nucleic acids research. 2005;33(Suppl 1):D433–D437. doi: 10.1093/nar/gki005. [DOI] [PMC free article] [PubMed] [Google Scholar]
- 23.Lee HK, Hsu AK, Sajdak J, Qin J, Pavlidis P. Coexpression analysis of human genes across many microarray data sets. Genome Res. 2004;14:1085–1094. doi: 10.1101/gr.1910904. [DOI] [PMC free article] [PubMed] [Google Scholar]
- 24.Eisen MB, Spellman PT, Brown PO, Botstein D. Cluster analysis and display of genome-wide expression patterns. Proc. Natl. Acad. Sci. USA. 1998;95:14863–14868. doi: 10.1073/pnas.95.25.14863. [DOI] [PMC free article] [PubMed] [Google Scholar]
- 25.Pruitt KD, Tatusova T, Klimke W, Maglott DR. NCBI Reference Sequences: current status, policy and new initiatives. Nucleic Acids Res. 2009;37:D32–D36. doi: 10.1093/nar/gkn721. [DOI] [PMC free article] [PubMed] [Google Scholar]
- 26.Carninci P, Kasukawa T, Katayama S, Gough J, Frith M, Maeda N, Oyama R, Ravasi T, Lenhard B, Wells C, et al. The transcriptional landscape of the mammalian genome. Science. 2005;309:1559–1563. doi: 10.1126/science.1112014. [DOI] [PubMed] [Google Scholar]
- 27.Jensen LJ, Kuhn M, Stark M, Chaffron S, Creevey C, Muller J, Doerks T, Julien P, Roth A, Simonovic M, et al. STRING 8—a global view on proteins and their functional interactions in 630 organisms. Nucleic Acids Res. 2009;37:D412–D416. doi: 10.1093/nar/gkn760. [DOI] [PMC free article] [PubMed] [Google Scholar]
- 28.Ashburner M, Ball CA, Blake JA, Botstein D, Butler H, Cherry JM, Davis AP, Dolinski K, Dwight SS, Eppig JT, et al. Gene Ontology: tool for the unification of biology. The Gene Ontology Consortium. Nat. Genet. 2000;25:25–29. doi: 10.1038/75556. [DOI] [PMC free article] [PubMed] [Google Scholar]
- 29.Zhou D, Bousquet O, Lal TN, Weston J, Schölkopf B. Learning with local and global consistency. Adv. Neural Inf. Process. Syst. 2004;16:321–328. [Google Scholar]
- 30.Vanunu O, Magger O, Ruppin E, Shlomi T, Sharan R. Associating genes and protein complexes with disease via network propagation. PLoS Comput. Biol. 2010;6:e1000641. doi: 10.1371/journal.pcbi.1000641. [DOI] [PMC free article] [PubMed] [Google Scholar]
- 31.Zhu X, Goldberg AB. Introduction to semi-supervised learning. Synth. Lect. Artif. Intell. Mach. Learn. 2009;3:1–130. [Google Scholar]
- 32.Jebara T, Wang J, Chang SF, Proceedings of the 26th Annual International Conference on Machine Learning . 2009. Graph construction and b-matching for semi-supervised learning; pp. 441–448. [Google Scholar]
- 33.Deng M, Zhang K, Mehta S, Chen T, Sun F. Prediction of protein function using protein-protein interaction data. J. Comput. Biol. 2003;10:947–960. doi: 10.1089/106652703322756168. [DOI] [PubMed] [Google Scholar]
- 34.Hishigaki H, Nakai K, Ono T, Tanigami A, Takagi T. Assessment of prediction accuracy of protein function from protein–protein interaction data. Yeast. 2001;18:523–531. doi: 10.1002/yea.706. [DOI] [PubMed] [Google Scholar]
- 35.Chua HN, Sung WK, Wong L. Exploiting indirect neighbours and topological weight to predict protein function from protein–protein interactions. Bioinformatics. 2006;22:1623–1630. doi: 10.1093/bioinformatics/btl145. [DOI] [PubMed] [Google Scholar]
- 36.Nabieva E, Jim K, Agarwal A, Chazelle B, Singh M. Whole-proteome prediction of protein function via graph-theoretic analysis of interaction maps. Bioinformatics. 2005;21:i302–i310. doi: 10.1093/bioinformatics/bti1054. [DOI] [PubMed] [Google Scholar]
- 37.Schwikowski B, Uetz P, Fields S. A network of protein-protein interactions in yeast. Nat. Biotechnol. 2000;18:1257–1261. doi: 10.1038/82360. [DOI] [PubMed] [Google Scholar]
- 38.Chang HY, Rinn JL. Genome regulation by long noncoding RNAs. Annu. Rev. Biochem. 2012;81:145–166. doi: 10.1146/annurev-biochem-051410-092902. [DOI] [PMC free article] [PubMed] [Google Scholar]
- 39.Dinger ME, Amaral PP, Mercer TR, Pang KC, Bruce SJ, Gardiner BB, Askarian-Amiri ME, Ru K, Soldà G, Simons C, et al. Long noncoding RNAs in mouse embryonic stem cell pluripotency and differentiation. Genome Res. 2008;18:1433–1445. doi: 10.1101/gr.078378.108. [DOI] [PMC free article] [PubMed] [Google Scholar]
- 40.Lee I, Ambaru B, Thakkar P, Marcotte EM, Rhee SY. Rational association of genes with traits using a genome-scale gene network for Arabidopsis thaliana. Nat. Biotechnol. 2010;28:149–156. doi: 10.1038/nbt.1603. [DOI] [PMC free article] [PubMed] [Google Scholar]
- 41.Cui Q, Ma Y, Jaramillo M, Bari H, Awan A, Yang S, Zhang S, Liu L, Lu M, O’Connor-McCourt M, et al. A map of human cancer signaling. Mol. Syst. Biol. 2007;3:152. doi: 10.1038/msb4100200. [DOI] [PMC free article] [PubMed] [Google Scholar]
- 42.Cui Q, Yu Z, Purisima EO, Wang E. Principles of microRNA regulation of a human cellular signaling network. Mol. Syst. Biol. 2006;2:46. doi: 10.1038/msb4100089. [DOI] [PMC free article] [PubMed] [Google Scholar]
- 43.Kanehisa M, Goto S, Sato Y, Furumichi M, Tanabe M. KEGG for integration and interpretation of large-scale molecular data sets. Nucleic Acids Res. 2012;40:D109–D114. doi: 10.1093/nar/gkr988. [DOI] [PMC free article] [PubMed] [Google Scholar]
- 44.Amaral PP, Mattick JS. Noncoding RNA in development. Mamm. Genome. 2008;19:454–492. doi: 10.1007/s00335-008-9136-7. [DOI] [PubMed] [Google Scholar]
- 45.Guttman M, Donaghey J, Carey BW, Garber M, Grenier JK, Munson G, Young G, Lucas AB, Ach R, Bruhn L, et al. lincRNAs act in the circuitry controlling pluripotency and differentiation. Nature. 2011;477:295–300. doi: 10.1038/nature10398. [DOI] [PMC free article] [PubMed] [Google Scholar]
- 46.Mohamed JS, Gaughwin PM, Lim B, Robson P, Lipovich L. Conserved long noncoding RNAs transcriptionally regulated by Oct4 and Nanog modulate pluripotency in mouse embryonic stem cells. RNA. 2010;16:324–337. doi: 10.1261/rna.1441510. [DOI] [PMC free article] [PubMed] [Google Scholar]
- 47.Altschul SF, Madden TL, Schäffer AA, Zhang J, Zhang Z, Miller W, Lipman DJ. Gapped BLAST and PSI-BLAST: a new generation of protein database search programs. Nucleic Acids Res. 1997;25:3389–3402. doi: 10.1093/nar/25.17.3389. [DOI] [PMC free article] [PubMed] [Google Scholar]
- 48.Blackshaw S, Harpavat S, Trimarchi J, Cai L, Huang H, Kuo WP, Weber G, Lee K, Fraioli RE, Cho SH, et al. Genomic analysis of mouse retinal development. PLoS Biol. 2004;2:e247. doi: 10.1371/journal.pbio.0020247. [DOI] [PMC free article] [PubMed] [Google Scholar]
- 49.Chodroff RA, Goodstadt L, Sirey TM, Oliver PL, Davies KE, Green ED, Molnár Z, Ponting CP. Long noncoding RNA genes: conservation of sequence and brain expression among diverse amniotes. Genome Biol. 2010;11:R72. doi: 10.1186/gb-2010-11-7-r72. [DOI] [PMC free article] [PubMed] [Google Scholar]
- 50.Mercer TR, Dinger ME, Sunkin SM, Mehler MF, Mattick JS. Specific expression of long noncoding RNAs in the mouse brain. Proc. Natl. Acad. Sci. USA. 2008;105:716–721. doi: 10.1073/pnas.0706729105. [DOI] [PMC free article] [PubMed] [Google Scholar]
- 51.Mercer TR, Qureshi IA, Gokhan S, Dinger ME, Li G, Mattick JS, Mehler MF. Long noncoding RNAs in neuronal-glial fate specification and oligodendrocyte lineage maturation. BMC Neurosci. 2010;11:14. doi: 10.1186/1471-2202-11-14. [DOI] [PMC free article] [PubMed] [Google Scholar]
- 52.Tripathi V, Ellis JD, Shen Z, Song DY, Pan Q, Watt AT, Freier SM, Bennett CF, Sharma A, Bubulya PA, et al. The nuclear-retained noncoding RNA MALAT1 regulates alternative splicing by modulating SR splicing factor phosphorylation. Mol. Cell. 2010;39:925–938. doi: 10.1016/j.molcel.2010.08.011. [DOI] [PMC free article] [PubMed] [Google Scholar]
- 53.Bellucci M, Agostini F, Masin M, Tartaglia GG. Predicting protein associations with long noncoding RNAs. Nat. Methods. 2011;8:444–445. doi: 10.1038/nmeth.1611. [DOI] [PubMed] [Google Scholar]
- 54.Khalil AM, Rinn JL. RNA-protein interactions in human health and disease. Semin. Cell Dev. Biol. 2011;22:359–365. doi: 10.1016/j.semcdb.2011.02.016. [DOI] [PMC free article] [PubMed] [Google Scholar]
- 55.Gupta RA, Shah N, Wang KC, Kim J, Horlings HM, Wong DJ, Tsai MC, Hung T, Argani P, Rinn JL, et al. Long non-coding RNA HOTAIR reprograms chromatin state to promote cancer metastasis. Nature. 2010;464:1071–1076. doi: 10.1038/nature08975. [DOI] [PMC free article] [PubMed] [Google Scholar]
- 56.Wu LF, Hughes TR, Davierwala AP, Robinson MD, Stoughton R, Altschuler SJ. Large-scale prediction of Saccharomyces cerevisiae gene function using overlapping transcriptional clusters. Nat. Genet. 2002;31:255–265. doi: 10.1038/ng906. [DOI] [PubMed] [Google Scholar]
- 57.Pellissier F, Gerber A, Bauer C, Ballivet M, Ossipow V. The adhesion molecule Necl-3/SynCAM-2 localizes to myelinated axons, binds to oligodendrocytes and promotes cell adhesion. BMC Neurosci. 2007;8:90. doi: 10.1186/1471-2202-8-90. [DOI] [PMC free article] [PubMed] [Google Scholar]
- 58.Sun Y, Da Costa N, Chang K. Cluster characterisation and temporal expression of porcine sarcomeric myosin heavy chain genes. J. Muscle Res. Cell Motil. 2003;24:561–570. doi: 10.1023/b:jure.0000009895.03111.b3. [DOI] [PubMed] [Google Scholar]
- 59.Ponjavic J, Oliver PL, Lunter G, Ponting CP. Genomic and transcriptional co-localization of protein-coding and long non-coding RNA pairs in the developing brain. PLoS Genet. 2009;5:e1000617. doi: 10.1371/journal.pgen.1000617. [DOI] [PMC free article] [PubMed] [Google Scholar]
- 60.Makarova JA, Kramerov DA. Noncoding RNA of U87 host gene is associated with ribosomes and is relatively resistant to nonsense-mediated decay. Gene. 2005;363:51–60. doi: 10.1016/j.gene.2005.08.010. [DOI] [PubMed] [Google Scholar]
- 61.Dong B, Zhang P, Chen X, Liu L, Wang Y, He S, Chen R. Predicting housekeeping genes based on Fourier analysis. PloS One. 2011;6:e21012. doi: 10.1371/journal.pone.0021012. [DOI] [PMC free article] [PubMed] [Google Scholar]
Associated Data
This section collects any data citations, data availability statements, or supplementary materials included in this article.