

Abstract
OBJECTIVE
To determine the extent of, and reasons for, ethnic differences in type 2 diabetes incidence in the U.K.
RESEARCH DESIGN AND METHODS
Population-based triethnic cohort. Participants were without diabetes, aged 40–69 at baseline (1989–1991), and followed-up for 20 years. Baseline measurements included fasting and postglucose bloods, anthropometry, and lifestyle questionnaire. Incident diabetes was identified from medical records and participant recall. Ethnic differences in diabetes incidence were examined using competing risks regression.
RESULTS
Incident diabetes was identified in 196 of 1,354 (14%) Europeans, 282 of 839 (34%) Indian Asians, and 100 of 335 (30%) African Caribbeans. All Indian Asians and African Caribbeans were first-generation migrants. Compared with Europeans, age-adjusted subhazard ratios (SHRs [95% CI]) for men and women, respectively, were 2.88 (95%, 2.36–3.53; P < 0.001) and 1.91 (1.18–3.10; P = 0.008) in Indian Asians, and 2.23 (1.64–3.03; P < 0.001) and 2.51 (1.63–3.87; P < 0.001) in African Caribbeans. Differences in baseline insulin resistance and truncal obesity largely attenuated the ethnic minority excess in women (adjusted SHRs: Indian Asians 0.77 [0.49–1.42]; P = 0.3; African Caribbeans 1.48 [0.89–2.45]; P = 0.13), but not in men (adjusted SHRs: Indian Asians 1.98 [1.52–2.58]; P < 0.001 and African Caribbeans, 2.05 [1.46–2.89; P < 0.001]).
CONCLUSIONS
Insulin resistance and truncal obesity account for the twofold excess incidence of diabetes in Indian Asian and African Caribbean women, but not men. Explanations for the excess diabetes risk in ethnic minority men remains unclear. Further study requires more precise measures of conventional risk factors and identification of novel risk factors.
The global prevalence of type 2 diabetes continues to increase, with the Indian subcontinent predicted to contribute the greatest increase in the number of people with diabetes by 2030 (1). Indian Asian migrant populations also experience greater prevalence of diabetes than host white populations (2,3). Although prevalence of diabetes in sub-Saharan Africa remains low, the prevalence in African-origin populations in other areas of the world is elevated compared with that of white populations (4,5). Few studies have explored explanations for ethnic differences in diabetes incidence. The Atherosclerosis Risk in Communities (ARIC) study found that although adiposity, lifestyle, and socioeconomic factors accounted for nearly 50% of the excess diabetes risk in African American women, none of the excess could be explained in men (6), echoing findings from the National Health and Nutrition Examination Survey (NHANES) (7,8). However, previous studies did not explore the role of insulin resistance and ectopic fat distribution. Further, there are no longitudinal studies to explain the excess diabetes risk in Indian Asians compared with Europeans.
We have reported a threefold prevalence of diabetes in men and women aged 40–70 years of Indian Asian and African Caribbean origin compared with Europeans in the SABRE (Southall And Brent REvisited) cohort. We now report incidence of diabetes and potential explanations for ethnic differences in incidence in this unique cohort with a 20-year follow-up to ages 60–89 years.
RESEARCH DESIGN AND METHODS
SABRE is a community-based cohort of Europeans, Indian Asians, and African Caribbeans from north and west London. Details of the cohort have been published (9). Participants aged 40–69 years at baseline (1988–1991) were randomly selected from age- and sex-stratified primary care physician lists (n = 4,063) and workplaces (n = 795) in the London districts of Southall and Brent (Fig. 1). Because primary care registration is free and the gateway to all health services in the U.K., this forms a representative and comprehensive sampling frame. The study was designed to investigate cardiometabolic risk in different ethnic groups, primarily in men.
Figure 1.
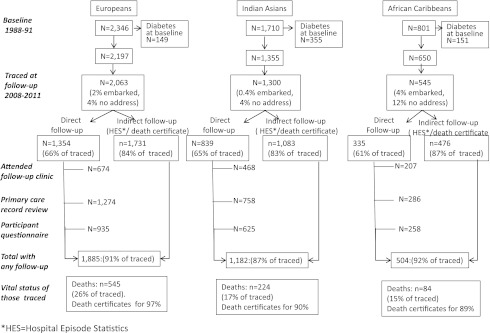
Follow-up of SABRE cohort, 1988–2011.
All Indian Asians and African Caribbeans were first-generation migrants. Ethnicity was interviewer-recorded based on parental origins and appearance and was subsequently confirmed by participants. Indian Asians originated from the Indian subcontinent. African Caribbeans originated from the Caribbean (91.5%) or from West Africa. At baseline, participants underwent fasting blood tests, blood pressure measurements, and anthropometry, and completed a health and lifestyle questionnaire. Those whose diabetes status was unknown underwent oral glucose tolerance testing (OGTT).
During 2008–2011, survivors were invited to participate in a morbidity follow-up, including a health and lifestyle questionnaire, primary care medical record review, and/or attendance at clinic at St. Mary’s Hospital, London. Clinic attendees fasted overnight and underwent measurements as at baseline, including OGTT.
All participants gave written informed consent. Approval for the baseline study was obtained from Ealing, Hounslow and Spelthorne, Parkside, and University College London research ethics committees, and at follow-up from St. Mary’s Hospital Research Ethics Committee (reference 07/H0712/109).
Identifying baseline and incident diabetes
Physician diagnosis or World Health Organization 1999 criteria (10) for fasting and OGTT blood glucose measurements defined baseline diabetes. Incident diabetes was identified from a positive report from one of the following sources:
Direct follow-up:
Primary care medical record review: recorded diagnosis of diabetes or prescription of antidiabetic medications.
Participant questionnaire: recall of physician-diagnosed diabetes plus either year of diagnosis or receipt of named antidiabetic medication.
Clinical follow-up at 20 years: fasting or OGTT plasma glucose results meeting World Health Organization 1999 criteria (10). Plasma glucose was measured using hexokinase/NADP methods (Abbott Diagnostics).
Indirect follow-up:
Hospital episode statistics (HES) or death certificates: diagnosis of diabetes at hospital discharge or diabetes listed as an underlying or contributory cause of death (ICD9 codes: 2500–2509; ICD10 codes: E100-E149) for sensitivity analyses only.
Age at diagnosis was identified at first report of diabetes in primary care medical records or age at follow-up for the 86 (15%) cases identified at follow-up clinic.
Baseline risk factor measurements
Height was measured using a stadiometer. Body fat included circumferences around the waist (halfway between costal margin and iliac crest), hip (over greater trochanter), and midthigh, and was measured using a fiberglass tape with a spring balance set to a constant tension of 600 g. Holtain Harpenden calipers were used to standard protocol to measure skinfold thicknesses. Subcutaneous truncal fat was estimated by addition of subscapular and suprailiac skinfold thicknesses.
For OGTT, plasma glucose and insulin were measured 2 h after 75 g oral glucose (9). Blood was analyzed at the same hospital laboratory (5). Glycated hemoglobin was measured in stored blood samples (Southall center only) using an immunoassay on a clinically validated automated analyzer (c311; Roche, Burgess Hill, U.K.); the high and low quality-control coefficients of variation were 2.9 and 3.3%. Baseline insulin resistance (IR) as a measure of hepatic IR and percentage β-cell function (HOMA2-B) were approximated using the HOMA2 calculator (11). The formula derived by Matsuda et al. (12) incorporates both fasting and postload measures, thus approximating both hepatic and peripheral IR (√(fasting glucose × 2-h glucose[mg/dL] × fasting insulin × 2 h insulin [µU/mL])/10,000).
Sitting blood pressure was the mean of two resting measurements using a random zero sphygmomanometer (Hawksley, Lancing, U.K.).
Physical activity was assessed by questionnaire. Methods based on the Allied Dunbar Fitness survey (13) were used to calculate energy expenditure for leisure activity, giving a summary estimate of total weekly energy expenditure (MJ) in sport, walking, cycling, and strenuous activities. An index of physical activity at work was generated (Supplementary Data).
Statistical analyses
Primary analyses relate to data obtained from direct follow-up sources for people without baseline diabetes. Indirect data (HES) and death certification data were not used for primary analyses because date of diagnosis could not be established. We amalgamated direct data sources to identify incident diabetes and found no evidence of heterogeneity between sources using a meta-analysis approach. Baseline characteristics by incident diabetes status were compared using parametric (Student t) or nonparametric (Wilcoxon rank sum/χ2) tests, as appropriate.
Competing risks regression (competing risk = death) based on Fine and Gray proportional subhazards methods (14) was used to describe ethnic differences in diabetes incidence and to examine baseline characteristics representing a series of prespecified parameters (anthropometric, metabolic, blood pressure, lifestyle, socioeconomic position) as predictors of incident diabetes in univariate models. Those predictors that most substantially and significantly altered the subhazard ratio (SHR) for ethnic difference were included in multivariate models. Interactions between ethnicity and baseline risk factors chosen for multivariate models were examined.
We tested interactions between follow-up time and each covariate. The small number of covariates in which the proportional hazards assumption was violated was included as time-varying covariates. We plotted cumulative incidence curves for each ethnic–sex group and examined Schoenfeld-like residuals. All analyses are stratified by ethnicity and sex. We repeated analyses of associations between baseline risk factors and ethnicity using logistic regression combining HES, death certificate, and directly collected data. All analyses were conducted in STATA version 12. All statistical tests were two-sided and statistical significance was accepted as P < 0.05.
RESULTS
Of those without baseline diabetes (N = 4,202), 3,908 (93%) were traced to a U.K. address. Direct follow-up data were available for 1,354 (66%), 839 (65%), and 335 (61%) of traced Europeans, Indian Asians, and African Caribbeans, respectively. Proportions with any follow-up data increased to 91, 87, and 92% of traced Europeans, Indian Asians, and African Caribbeans when HES and deaths data were included (Fig. 1).
Diabetes developed in 14% of Europeans, 33% of Indian Asians, and 30% of African Caribbeans between baseline (mean age, 51.8 ± 7.0 years) and follow-up (mean age, 70.5 ± 6.3 years). Cumulative incidence by age at follow-up is illustrated (Fig. 2).
Figure 2.

Cumulative incidence of diabetes during 20 years of follow-up.
Diabetes risk and determinants in men
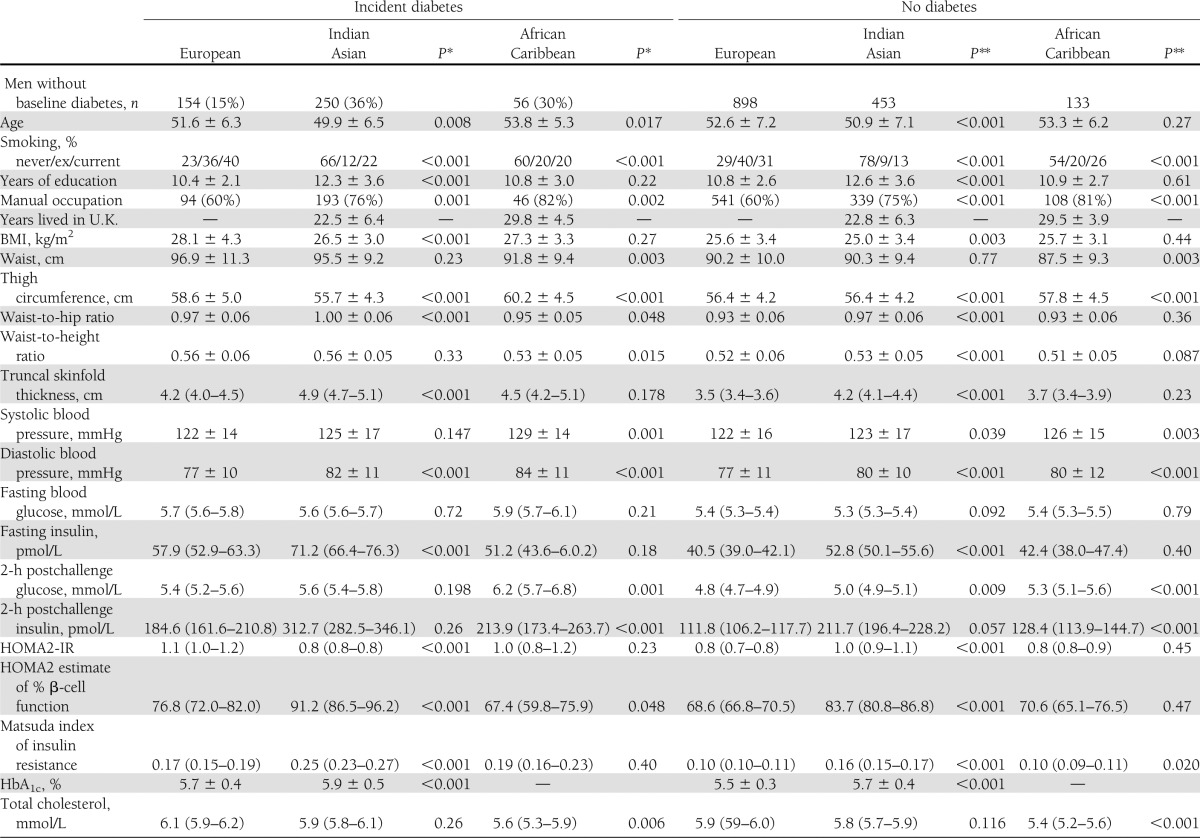
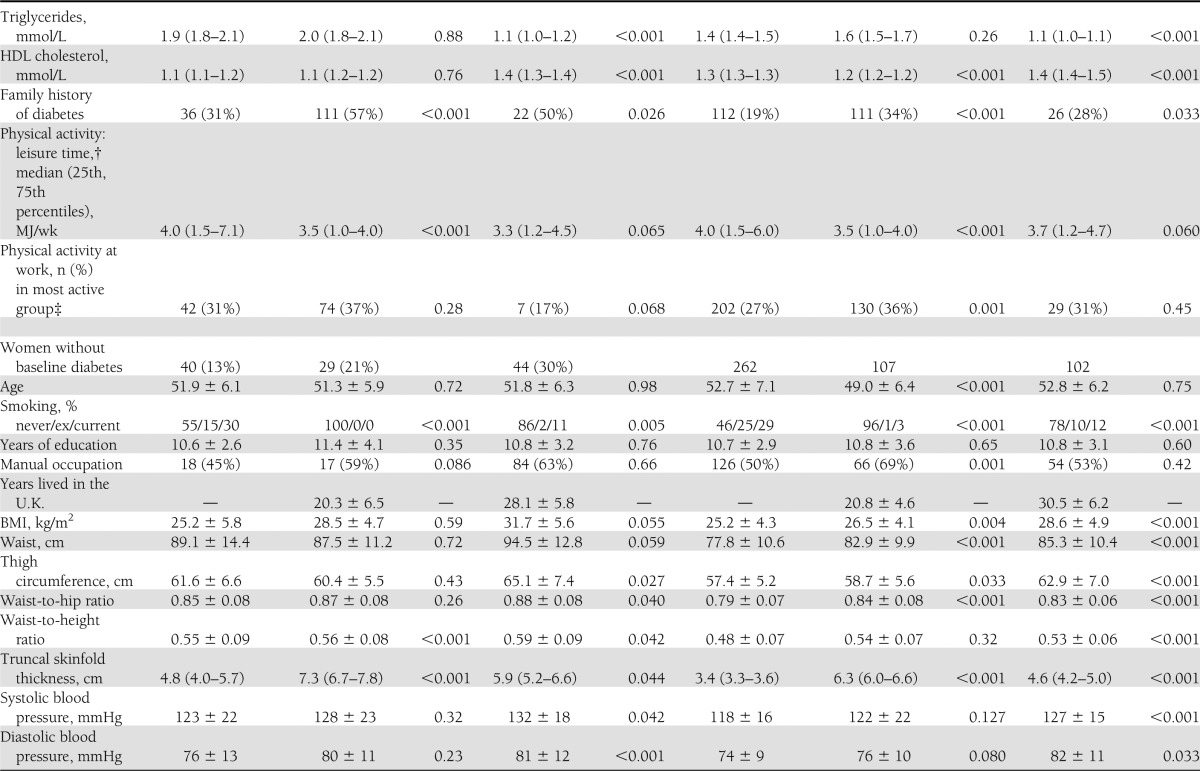
Indian Asians who had development of diabetes had lower BMI at baseline but were more centrally obese than Europeans (Table 1). Although baseline fasting and postload glucose did not differ, Indian Asians had higher fasting insulin, more adverse measures of insulin resistance, and higher calculated β-cell function than Europeans. In contrast, only the Matsuda IR index was elevated in African Caribbeans compared with Europeans. Fasting insulin and estimated β-cell function were lowest and fasting and postload glucose were highest in African Caribbeans who had development of diabetes (Table 1). Fasting HDL cholesterol was lower and triglyceride levels were higher in Europeans and Indian Asians who had development of diabetes. Leisure time energy expenditure was lower in Indian Asians and African Caribbeans regardless of diabetes status. African Caribbeans who had development of diabetes were also less active at work than Europeans. Smoking predicted diabetes incidence in European and Indian Asian men.
Table 1.
Baseline characteristics by ethnicity, sex, and incident diabetes status
Indian Asian men were nearly three times more likely to have development of diabetes than European men (Table 2) and were younger at diagnosis (median, 62 vs. 67 years; P < 0.001). Adjustment for baseline smoking increased the SHR for Indian Asians versus Europeans to 3.37 (95% CI, 2.67–4.26; P < 0.001). The Matsuda index of IR most attenuated, but did not abolish, the Indian Asian excess risk of diabetes (adjusted SHR, 2.16; 95% CI, 1.68–2.78; P < 0.001). Multivariate adjustment slightly further attenuated the ethnic differential (SHR, 1.98; 95% CI, 1.52–2.58; P < 0.001) truncal obesity and Matsuda IR were independent predictors (P < 0.05) (Table 2). Data on baseline HbA1c were available for 70% of Europeans and 77% of Indian Asians; that inclusion in the multivariable model did not explain ethnic differences in diabetes incidence (not shown).
Table 2.
Ethnic group differences in incidence of diabetes adjusted for baseline risk factors
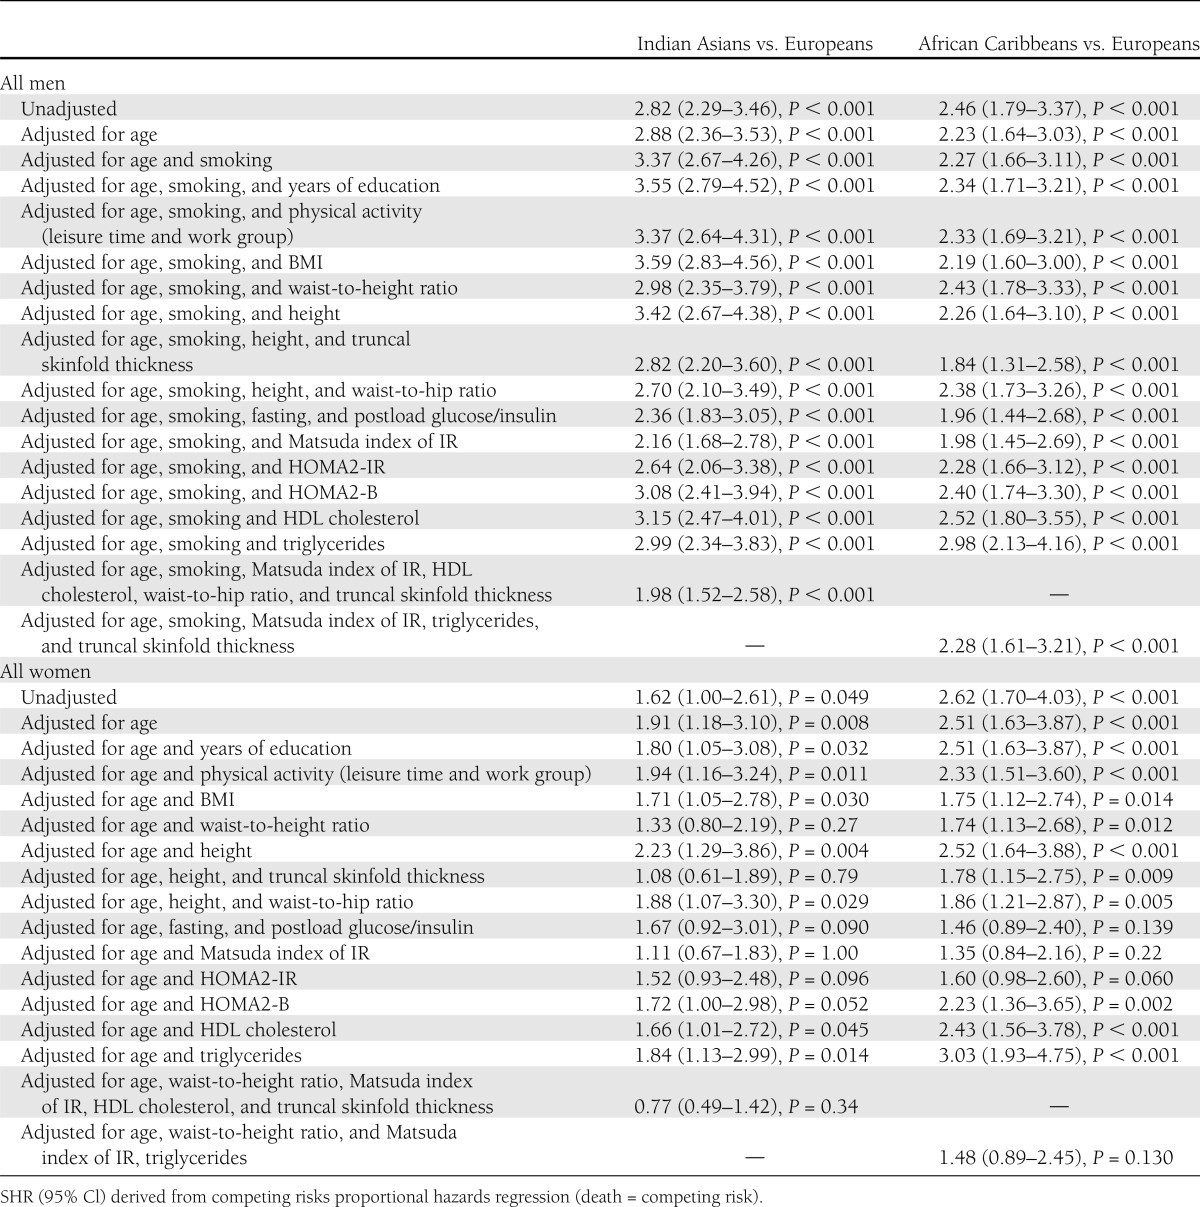
Although only available for 2,011 surviving participants who completed follow-up questionnaires, family history of diabetes was more prevalent in ethnic minority groups and most prevalent in those with incident diabetes. (Table 1). For this subgroup, ethnic differentials in diabetes incidence were similar to those of the whole group (age-adjusted SHR, 2.79; 95% CI, 2.22–3.51; P < 0.001). A positive family history independently accounted for a small part of the excess diabetes risk in Indian Asians when added to the multivariate model (family history-adjusted SHR, 1.82; 95% CI, 1.1.33–2.49, and P < 0.001 vs. 2.03; 95% CI, 1.48–2.77, and P < 0.001 when family history was not included).
African Caribbean men, whether of West African or Caribbean descent, had twice the incidence of diabetes compared with European men, although median age at diagnosis was similar (median, 68 vs. 67 years; P = 0.51). Because African Caribbean men were less centrally obese and had more favorable lipids than European men, adjustment for these factors exaggerated the ethnic difference in diabetes incidence. Adjustment for truncal skinfolds attenuated the ethnic difference (SHR, 1.84; 95% CI, 1.31–2.58; P < 0.001). Adjustment for Matsuda IR or its components provided the next greatest attenuation, bringing the SHR to 1.98 or 1.96 (P < 0.001). Further multivariate adjustment or adjustment for family history provided no additional attenuation (Table 2).
Diabetes risk and determinants in women
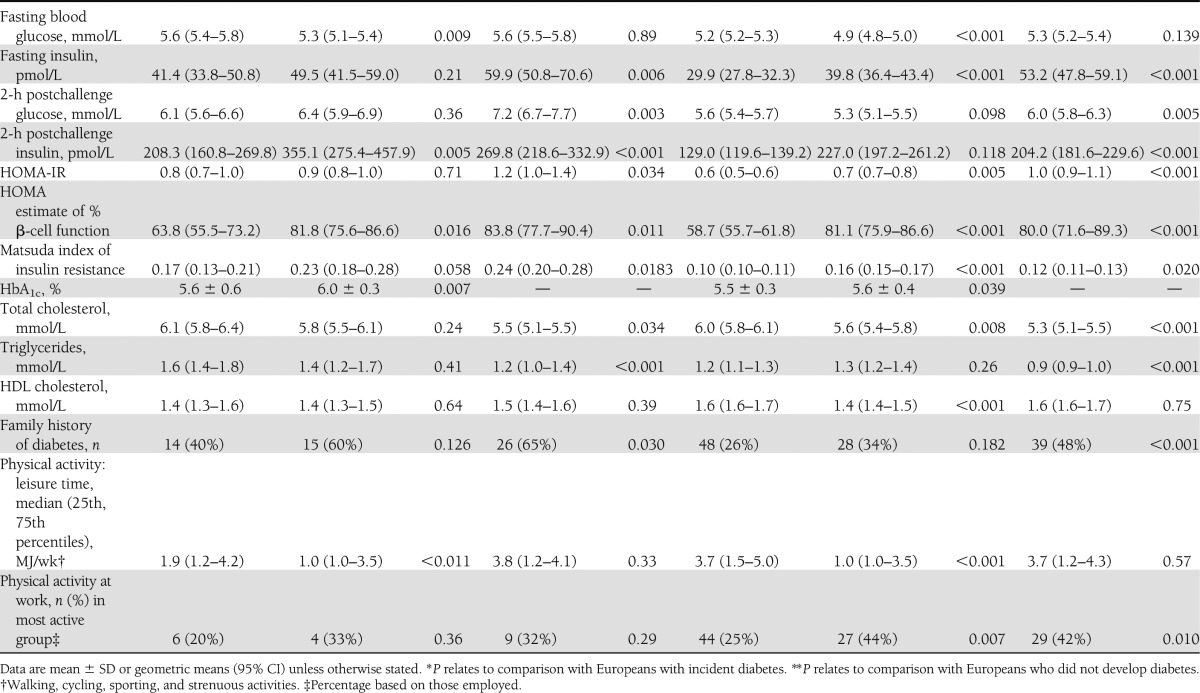
Patterns for women were similar to those for men with the following exceptions (Table 1). African Caribbean women were the most centrally obese. The sex difference in truncal skinfolds differed markedly by ethnicity in those who had development of diabetes. Baseline truncal skinfold was 0.6 cm greater in European women than in European men, but 2.4 cm greater in Indian Asian women and 1.4 cm greater in African Caribbean women than in men of the same ethnicities. Fasting insulin and HOMA-IR were highest in African Caribbean women and lowest in European women. Asian Indians and African Caribbeans had similarly elevated levels of Matsuda IR compared with Europeans. Fasting HDL cholesterol was lower and triglycerides were higher in European and African Caribbean women who later had development of diabetes, whereas there was no significant diabetes-related difference in lipid profiles in Indian Asian women. Leisure time physical activity was lowest in Indian Asian women, whereas African Caribbean and Indian Asian women were more active at work, regardless of diabetes status. Age at diagnosis of diabetes did not differ by ethnicity in women.
The ethnic differential in incident diabetes was less marked between Indian Asian and European women and disappeared on adjustment for truncal skinfold thickness (adjusted SHR, 1.08; 95% CI, 0.61–1.89; P = 0.79). Waist-to-height ratio and Matsuda IR also had a similarly marked attenuating effect (Table 2). Only truncal skinfold thickness (P = 0.041) and Matsuda IR (P < 0.001) were independent predictors.
African Caribbean women were 2.5 times more likely to have development of diabetes than European women. Adjustment for truncal or abdominal obesity partially attenuated the ethnic differential, but the Matsuda IR index had the greatest attenuating effect. In the multivariable model, the SHR was 1.48 (95% CI, 0.89–2.45) (Table 2). Only Matsuda IR (P < 0.001) and waist-to-height ratio (P = 0.016) were independent predictors.
No other baseline risk factor, including family history, physical activity, socioeconomic markers, medication use, and age at migration, further altered the excess diabetes risk in men and women of either ethnicity.
Sensitivity analyses
Hospital discharge (HES) data, based on 2,996 people without baseline diabetes, demonstrated incident diabetes in 11 and 8% of European men and women, 26 and 14% of Indian Asian men and women, and 21 and 15% of African Caribbean men and women. Findings from analyses of ethnic group differences in diabetes incidence were similar when we used logistic regression to compare HES data added to direct follow-up (n = 3,679) versus direct follow-up alone.
Smoking was unusual in Indian Asian and African Caribbean women; however, these analyses repeated in never-smoking women demonstrated similar ethnic differentials.
CONCLUSIONS
In this British population-based triethnic cohort with more than 20 years of follow-up, diabetes incidence is substantially elevated in people of African Caribbean and Indian Asian origin compared with Europeans. By age 80, 40–50% of British Indian Asian and African Caribbean men and women have diabetes, at least twice the prevalence observed in Europeans of the same age. Midlife measures of IR and of upper body fat deposition were already unfavorable in people who had development of diabetes approximately one decade later and were more adverse in the ethnic minorities. The Matsuda IR index contributed most to explaining the ethnic minority excess of diabetes in both sexes. Of obesity measures, adjustment for truncal fat provided the most consistent and independent attenuation of the ethnic differentials in both sexes Adjustment for these risk factors in women largely abolished the ethnic minority difference in diabetes incidence. In men, however, a twofold excess remained for both ethnic minority groups. ARIC (6) and NHANES (7,8) both suggest that their available lifestyle and adiposity measures could determine some of the African American excess in diabetes in women, but not in men. However, these previous studies did not use the OGTT, and a significant proportion of cases are diagnosed on postload values alone. Further, the role of measures of insulin resistance and ectopic fat deposition, beyond abdominal fat, were not explored, as we have performed here. Inequalities in access to health care may adversely affect risks of incident diabetes in African Americans; this is not an issue in the U.K., where health care is free at the point of delivery. There are no previous longitudinal studies comparing Indian Asians with Europeans.
Direct measures of insulin sensitivity are not feasible for epidemiological studies, which therefore need to rely on surrogates. There are many surrogates and no clear consensus regarding which works best. This reflects the choice of clamp technique used, the population studied, methods of validation used, and the purpose of prediction. In general, surrogate measures of IR that incorporate both fasting and postload values are stronger predictors of future diabetes than fasting levels alone (15–17), although beyond that the choice is less clear. Of the surrogates at our disposal, the Matsuda index mapped most closely to the ethnic/sex gradient in diabetes incidence and provided the most complete explanation for ethnic differences in risk. Comparison of OGTT-derived values of IR with hyperinsulinemic euglycemic clamp values suggests that they are valid markers of clamp-derived IR within Indian Asians (18) and within people of Black African descent (19), although these largely tested HOMA and not Matsuda indices. Calculated β-cell function at baseline was particularly low in African Caribbean men and lowest in those who had development of diabetes during follow-up. It is tempting to speculate that inadequate β-cell function explains elevated postchallenge glucose in African Caribbeans not matched by equivalently elevated postload insulin. However, smaller studies report C-peptide levels, a direct measure of β-cell function, that are similar in people of Black African descent in the U.K., U.S., or Africa compared with those of European origin; further, the acute insulin response to a glucose load is greater (20–22), even in those with established diabetes (23). In African Caribbeans, plasma insulin levels may be particularly affected by reduced hepatic insulin extraction and reduced insulin clearance (20,22,24), which could explain differences between variation in β-cell function and insulin concentrations. The pathogenesis of type 2 diabetes involves a prolonged period of insulin resistance initially compensated by increased β-cell function but latterly involving progressive β-cell deficit (25). European and Asian Indian men who would have development of type 2 diabetes had relatively elevated β-cell function, whereas among African Caribbean men and women there was no such increase. These findings suggest differences in the stage of pathogenesis reached in the groups at baseline. Our findings imply that, overall, IR was the principal driver of diabetes; however, in the absence of more detailed evaluations of β-cell function, this conclusion is tentative.
The greater visceral obesity of Indian Asians is an obvious candidate to account for the observed excess diabetes (26). However, others have suggested that deep subcutaneous truncal fat with larger hypertrophic adipocytes may be of key importance (27). We extend this observation by showing that truncal fat plays an independent role in accounting for the Indian Asian male excess in diabetes. Adjustment for truncal skinfolds provided the most consistent attenuation in the ethnic minority excess of diabetes incidence for men and women (although not independent of the Matsuda index in the comparison between African Caribbean and European women). We confirm the excess truncal obesity in people of Black African descent despite, in men at least, less visceral fat (28), and its strong predictive ability for diabetes incidence (8). Excess truncal fat in both Indian Asians and people of Black African descent is observed in youth and, in both cases, the growth trajectory for truncal skinfolds appears more rapid for the ethnic minority groups (29,30). Whereas the greater truncal fat despite less abdominal fat in women has been previously noted (31), it is striking here that the sex difference in truncal obesity is more marked in the ethnic minority groups than in Europeans.
Adjustment for IR provided more complete attenuation in the ethnic difference in diabetes incidence in women compared with men. Others have reported sex differences in response to the OGTT such that, in some studies at least, women are more likely to be classified as having impaired glucose tolerance and men are more likely to exhibit impaired fasting glucose (32,33). Impaired fasting glucose may be more strongly associated with β-cell failure (33,34). Thus, the weaker ability of HOMA-IR and Matsuda IR indices to account for ethnic differences in diabetes incidence in men may, speculatively, reflect the imprecision of their characterization of β-cell function, which may play a more important role in the onset of diabetes in men.
Underlying explanations for the greater predisposition to IR in people of ethnic minority descent or, perhaps more appropriately, the protection from IR in individuals of European origin who, despite escalating levels of obesity, remain at lowest risk of diabetes are unknown. Changes in fat distribution over the life-course appear to differ by ethnicity (29,30). Although a genetic susceptibility may be an obvious explanation for ethnic differences in metabolic and obesity characteristics, and for the different trajectories over the life-course, it is notable that total energy intake is higher compared with British Europeans in largely first-generation Indian Asian migrants to the U.K. (35) and in Indian Asian children in the U.K. (36). Within India, migrants from rural to urban areas also have higher energy intakes compared with those of the rural population (37). This is associated with greater obesity, ectopic fat distribution, and IR. Further, age-related changes in adverse patterns of IR are more marked in Indian Asian migrant populations compared with Indian Asian nonmigrant populations (35). Such rapid changes in metabolic characteristics are likely to be environmentally rather than genetically driven. It is notable that dietary intake comparisons between rural and urban Cameroonians and British Jamaicans and Caribbeans do not suggest greater calorie or saturated fat intake in the latter (38); however, physical activity levels have been shown to be lower in migrant populations (39).
Strengths and limitations
To our knowledge, this is the largest triethnic cohort in the U.K. with lengthy (20-year) follow-up between middle and older age, thus providing unique prospective ethnicity-specific information on diabetes incidence. Loss to direct follow-up has occurred in one-third of all ethnic groups. However, in sensitivity analyses, the addition of hospital discharge (HES) data to those from direct follow-up provides diabetes status for more than 91% of traced individuals. Results of analyses based on these more complete data were similar to analyses based on direct follow-up. Baseline measurements are limited to those performed on only one occasion 20 years ago, meaning that we cannot account for changes in risk factors during the follow-up period or in earlier life. We have addressed lifestyle and socioeconomic status using the available baseline data on smoking habits, physical activity, years of education, and occupational status, but we acknowledge that these cannot capture all the complexities of the nonmetabolic explanations for ethnic differentials in diabetes incidence.
In conclusion, Indian Asian and African Caribbean migrants to the U.K. have at least twice the risk of development of diabetes compared with British Europeans, even in older age, broadly reflecting patterns observed in younger populations worldwide. Given the increasing life expectancies for those with type 2 diabetes (40), this presents a public health challenge. Measures of insulin resistance and ectopic fat deposition, particularly truncal, account for excess diabetes risk in Indian Asian and African Caribbean women but only make a contribution to the excess risk in ethnic minority men. Strikingly, we show that despite our comprehensive measures, the ethnic minority excess of incident diabetes in men (both Indian Asians and African Caribbeans) cannot be explained, whereas it can be explained for women. We would have anticipated otherwise, and our findings in a different geographical setting than the U.S. and in two different ethnic groups strongly indicate that better assessment of risk factors and/or a search for novel factors are required if we are to understand why ethnic minority groups are at such high risk for diabetes.
Supplementary Material
Acknowledgments
The study was funded at baseline by the Medical Research Council, Diabetes UK, and the British Heart Foundation, and at follow-up by the Wellcome Trust and the British Heart Foundation. The funders played no role in the study design and conduct or in these analyses or the decision to submit the manuscript for publication. The SABRE study group is entirely independent from the funding bodies.
No potential conflicts of interest relevant to this article were reported.
T.T. conducted primary statistical analyses and wrote the first draft of the manuscript. All authors contributed to study design and data interpretation. A.D.H., I.F.G., P.Wh., N.G.F., N.S., P.We., P.M.M., and N.C. commented on the draft manuscript and approved this version. T.T. is the guarantor of this work and, as such, had full access to all of the data in the study and takes responsibility for the integrity of the data and the accuracy of the data analysis.
The authors thank all members of the SABRE Study group for their contributions to study design, study management, data collection and analyses.
The SABRE Study group includes Nish Chaturvedi (Imperial College London) (Principal Investigator), Mark Baker (Imperial College London), Norman Beauchamp (University of Washington, Seattle), Emma Coady (Imperial College London), Rory Collins (University of Oxford), Nita Forouhi (Medical Research Council Epidemiology Unit, Cambridge), Wladyslaw Gedroyc (Imperial College London), Ian Godsland (Imperial College London), Andrew Hattersley (Peninsula Medical School, University of Exeter), John Heasman (Imperial College London), Alun Hughes (Imperial College London), Azeem Majeed (Imperial College London), Katherine March (Imperial College London), Jamil Mayet (Imperial College London), Chloe Page(Imperial College London), Paul McKeigue (University of Edinburgh), Martin Prince (Kings College London), Marcus Richards (Medical Research Council,Unit for Lifelong Health and Ageing), Naveed Sattar (University of Glasgow), Dean Shibata (University of Washington, Seattle), Robert Stewart (Kings College London), Therese Tillin (Imperial College London), Claire Tuson (Imperial College London), Peter Whincup (St George’s, University of London), and Andrew Wright (Imperial College London).
Footnotes
This article contains Supplementary Data online at http://care.diabetesjournals.org/lookup/suppl/doi:10.2337/dc12-0544/-/DC1.
References
- 1.Shaw JE, Sicree RA, Zimmet PZ. Global estimates of the prevalence of diabetes for 2010 and 2030. Diabetes Res Clin Pract 2010;87:4–14 [DOI] [PubMed] [Google Scholar]
- 2.Anand SS, Yusuf S, Vuksan V, Devanesen S, Teo KK, Montague PA, Kelemen L, Yi C, Lonn E, Gerstein H, Hegele RA, McQueen M. Differences in risk factors, atherosclerosis, and cardiovascular disease between ethnic groups in Canada: the Study of Health Assessment and Risk in Ethnic groups (SHARE). Lancet 2000;356:279–284 [DOI] [PubMed] [Google Scholar]
- 3.Venkataraman R, Nanda NC, Baweja G, Parikh N, Bhatia V. Prevalence of diabetes mellitus and related conditions in Asian Indians living in the United States. Am J Cardiol 2004;94:977–980 [DOI] [PubMed] [Google Scholar]
- 4.National Institutes of Health National Diabetes Information Clearinghouse. NDIC, 2012, Bethesda, MD. Available from http://diabetes.niddk.nih.gov/dm/pubs/statistics/index.aspx#Racial Accessed 1 June 2012 [Google Scholar]
- 5.Chaturvedi N, McKeigue PM, Marmot MG. Relationship of glucose intolerance to coronary risk in Afro-Caribbeans compared with Europeans. Diabetologia 1994;37:765–772 [DOI] [PubMed] [Google Scholar]
- 6.Brancati FL, Kao WH, Folsom AR, Watson RL, Szklo M. Incident type 2 diabetes mellitus in African American and white adults: the Atherosclerosis Risk in Communities Study. JAMA 2000;283:2253–2259 [DOI] [PubMed] [Google Scholar]
- 7.Resnick HE, Valsania P, Halter JB, Lin X. Differential effects of BMI on diabetes risk among black and white Americans. Diabetes Care 1998;21:1828–1835 [DOI] [PubMed] [Google Scholar]
- 8.Lipton RB, Liao Y, Cao G, Cooper RS, McGee D. Determinants of incident non-insulin-dependent diabetes mellitus among blacks and whites in a national sample. The NHANES I Epidemiologic Follow-up Study. Am J Epidemiol 1993;138:826–839 [DOI] [PubMed] [Google Scholar]
- 9.Tillin T, Forouhi NG, McKeigue PM, Chaturvedi N, SABRE Study Group Southall And Brent REvisited: Cohort profile of SABRE, a UK population-based comparison of cardiovascular disease and diabetes in people of European, Indian Asian and African Caribbean origins. Int J Epidemiol 2012;41:33–42 [DOI] [PMC free article] [PubMed] [Google Scholar]
- 10.World Health Organization. Definition, Diagnosis and Classification of Diabetes Mellitus and its Complications. Part 1: Diagnosis and Classification of Diabetes Mellitus. Geneva, World Health Organization, 1999 [Google Scholar]
- 11.Levy JC, Matthews DR, Hermans MP. Correct homeostasis model assessment (HOMA) evaluation uses the computer program. Diabetes Care 1998;21:2191–2192 [DOI] [PubMed] [Google Scholar]
- 12.Matsuda M, DeFronzo RA. Insulin sensitivity indices obtained from oral glucose tolerance testing: comparison with the euglycemic insulin clamp. Diabetes Care 1999;22:1462–1470 [DOI] [PubMed] [Google Scholar]
- 13.Sports Council and Health Education Authority Allied Dunbar National Fitness Survey: main findings. London, Sports Council and Health Education Authority, 1990 [Google Scholar]
- 14.Fine JP, Gray RJ. A proportional hazards model for the subdistribution of a competing risk. J Am Stat Assoc 1999;94:496–509 [Google Scholar]
- 15.Hanson RL, Pratley RE, Bogardus C, et al. Evaluation of simple indices of insulin sensitivity and insulin secretion for use in epidemiologic studies. Am J Epidemiol 2000;151:190–198 [DOI] [PubMed] [Google Scholar]
- 16.Abdul-Ghani MA, Williams K, DeFronzo RA, Stern M. What is the best predictor of future type 2 diabetes? Diabetes Care 2007;30:1544–1548 [DOI] [PubMed] [Google Scholar]
- 17.Hanley AJ, Williams K, Gonzalez C, et al. San Antonio Heart Study. Mexico City Diabetes Study. Insulin Resistance Atherosclerosis Study Prediction of type 2 diabetes using simple measures of insulin resistance: combined results from the San Antonio Heart Study, the Mexico City Diabetes Study, and the Insulin Resistance Atherosclerosis Study. Diabetes 2003;52:463–469 [DOI] [PubMed] [Google Scholar]
- 18.Ramakrishnan G, Unni US, Raj T, Thomas T, Vaz M, Kurpad AV. A pilot study on hyperinsulinaemic euglycaemic clamp based insulin sensitivity in young adult Indian males with low body mass index. Indian J Med Res 2009;129:409–417 [PubMed] [Google Scholar]
- 19.Cheng C, Campbell KL, Kushner H, Falkner BE. Correlation of oral glucose tolerance test-derived estimates of insulin sensitivity with insulin clamp measurements in an African-American cohort. Metabolism 2004;53:1107–1112 [DOI] [PubMed] [Google Scholar]
- 20.Osei K, Schuster DP, Owusu SK, Amoah AG. Race and ethnicity determine serum insulin and C-peptide concentrations and hepatic insulin extraction and insulin clearance: comparative studies of three populations of West African ancestry and white Americans. Metabolism 1997;46:53–58 [DOI] [PubMed] [Google Scholar]
- 21.Zoratti R, Godsland IF, Chaturvedi N, et al. Relation of plasma lipids to insulin resistance, nonesterified fatty acid levels, and body fat in men from three ethnic groups: relevance to variation in risk of diabetes and coronary disease. Metabolism 2000;49:245–252 [DOI] [PubMed] [Google Scholar]
- 22.Cruickshank JK, Cooper J, Burnett M, MacDuff J, Drubra U. Ethnic differences in fasting plasma C-peptide and insulin in relation to glucose tolerance and blood pressure. Lancet 1991;338:842–847 [DOI] [PubMed] [Google Scholar]
- 23.Haffner SM, Howard G, Mayer E, et al. Insulin sensitivity and acute insulin response in African-Americans, non-Hispanic whites, and Hispanics with NIDDM: the Insulin Resistance Atherosclerosis Study. Diabetes 1997;46:63–69 [DOI] [PubMed] [Google Scholar]
- 24.Haffner SM, D’Agostino R, Saad MF, et al. Increased insulin resistance and insulin secretion in nondiabetic African-Americans and Hispanics compared with non-Hispanic whites. The Insulin Resistance Atherosclerosis Study. Diabetes 1996;45:742–748 [DOI] [PubMed] [Google Scholar]
- 25.DeFronzo RA. Lilly lecture 1987. The triumvirate: beta-cell, muscle, liver. A collusion responsible for NIDDM. Diabetes 1988;37:667–687 [DOI] [PubMed] [Google Scholar]
- 26.McKeigue PM, Pierpoint T, Ferrie JE, Marmot MG. Relationship of glucose intolerance and hyperinsulinaemia to body fat pattern in south Asians and Europeans. Diabetologia 1992;35:785–791 [DOI] [PubMed] [Google Scholar]
- 27.Chandalia M, Lin P, Seenivasan T, et al. Insulin resistance and body fat distribution in South Asian men compared to Caucasian men. PLoS ONE 2007;2:e812. [DOI] [PMC free article] [PubMed] [Google Scholar]
- 28.Duncan BB, Chambless LE, Schmidt MI, et al. Correlates of body fat distribution. Variation across categories of race, sex, and body mass in the atherosclerosis risk in communities study. The Atherosclerosis Risk in communities (ARIC) Study Investigators. Ann Epidemiol 1995;5:192–200 [DOI] [PubMed] [Google Scholar]
- 29.Krishnaveni GV, Hill JC, Veena SR, et al. Truncal adiposity is present at birth and in early childhood in South Indian children. Indian Pediatr 2005;42:527–538 [PubMed] [Google Scholar]
- 30.Kimm SY, Barton BA, Obarzanek E, et al. Racial divergence in adiposity during adolescence: The NHLBI Growth and Health Study. Pediatrics 2001;107:E34. [DOI] [PubMed] [Google Scholar]
- 31.Masharani U, Goldfine ID, Youngren JF. Influence of gender on the relationship between insulin sensitivity, adiposity, and plasma lipids in lean nondiabetic subjects. Metabolism 2009;58:1602–1608 [DOI] [PMC free article] [PubMed] [Google Scholar]
- 32.Faerch K, Borch-Johnsen K, Vaag A, Jørgensen T, Witte DR. Sex differences in glucose levels: a consequence of physiology or methodological convenience? The Inter99 study. Diabetologia 2010;53:858–865 [DOI] [PubMed] [Google Scholar]
- 33.Williams JW, Zimmet PZ, Shaw JE, et al. Gender differences in the prevalence of impaired fasting glycaemia and impaired glucose tolerance in Mauritius. Does sex matter? Diabet Med 2003;20:915–920 [DOI] [PubMed] [Google Scholar]
- 34.Davies MJ, Raymond NT, Day JL, Hales CN, Burden AC. Impaired glucose tolerance and fasting hyperglycaemia have different characteristics. Diabet Med 2000;17:433–440 [DOI] [PubMed] [Google Scholar]
- 35.Heald AH, Anderson SG, Vyas A, et al. Marked differences in the IGF system that are associated with migration in comparable populations of Gujaratis living in Sandwell, UK, and Gujarat, India. Diabetologia 2005;48:1756–1765 [DOI] [PubMed] [Google Scholar]
- 36.Donin AS, Nightingale CM, Owen CG, et al. Nutritional composition of the diets of South Asian, black African-Caribbean and white European children in the United Kingdom: the Child Heart and Health Study in England (CHASE). Br J Nutr 2010;104:276–285 [DOI] [PMC free article] [PubMed] [Google Scholar]
- 37.Ebrahim S, Kinra S, Bowen L, et al. Indian Migration Study group The effect of rural-to-urban migration on obesity and diabetes in India: a cross-sectional study. PLoS Med 2010;7:e1000268. [DOI] [PMC free article] [PubMed] [Google Scholar]
- 38.Mennen LI, Jackson M, Sharma S, et al. Habitual diet in four populations of African origin: a descriptive paper on nutrient intakes in rural and urban Cameroon, Jamaica and Caribbean migrants in Britain. Public Health Nutr 2001;4:765–772 [DOI] [PubMed] [Google Scholar]
- 39.Health Survey for England 2004: the health of minority ethnic groups. The Information Centre, Leeds, U.K. 2006
- 40.Seshasai SR, Kaptoge S, Thompson A, et al. Emerging Risk Factors Collaboration Diabetes mellitus, fasting glucose, and risk of cause-specific death. N Engl J Med 2011;364:829–841 [DOI] [PMC free article] [PubMed] [Google Scholar]
Associated Data
This section collects any data citations, data availability statements, or supplementary materials included in this article.