Abstract
OBJECTIVE
Depression is associated with the onset of type 2 diabetes. A systematic review and meta-analysis of observational studies, controlled trials, and unpublished data was conducted to examine the association between depression and insulin resistance (IR).
RESEARCH DESIGN AND METHODS
Medline, EMBASE, and PsycINFO were searched for studies published up to September 2011. Two independent reviewers assessed the eligibility of each report based on predefined inclusion criteria (study design and measure of depression and IR, excluding prevalent cases of diabetes). Individual effect sizes were standardized, and a meta-analysis was performed to calculate a pooled effect size using random effects. Subgroup analyses and meta-regression were conducted to explore any potential source of heterogeneity between studies.
RESULTS
Of 967 abstracts reviewed, 21 studies met the inclusion criteria of which 18 studies had appropriate data for the meta-analysis (n = 25,847). The pooled effect size (95% CI) was 0.19 (0.11–0.27) with marked heterogeneity (I2 = 82.2%) using the random-effects model. Heterogeneity between studies was not explained by age or sex, but could be partly explained by the methods of depression and IR assessments.
CONCLUSIONS
A small but significant cross-sectional association was observed between depression and IR, despite heterogeneity between studies. The pathophysiology mechanisms and direction of this association need further study using a purposively designed prospective or intervention study in samples at high risk for diabetes.
Depression is at least twice as common among those with diabetes compared with the general population (1) and is associated with adverse effects on diabetes outcomes including suboptimal glycemic control (2), complications (3), and higher rates of mortality (4,5). Depression appears to be present even at the prediabetes stage of the type 2 diabetes (T2DM) continuum with pooled data suggesting that depression in the nondiabetic population is independently associated with a 37–60% increased prospective risk of developing T2DM (6).
Insulin resistance (IR) is a prediabetes stage. There have now been several studies examining the association between depression and IR. These studies have had mixed findings. The aim of this review is to conduct a systematic synthesis and a meta-analysis of the evidence for the association between depression and IR. A positive association would increase the plausibility of a biological link between depression and diabetes and suggest a potentially modifiable target for the prevention of T2DM.
RESEARCH DESIGN AND METHODS
Our systematic review and meta-analysis was conducted according to Preferred Reporting Items for Systematic Reviews and Meta-Analyses (PRISMA) guidelines (7).
Data sources and study selection
The following electronic libraries—MEDLINE (1948 to September 2011), EMBASE (1947 to September 2011), and PsycINFO (1806 to September 2011)—were searched to identify relevant studies. The search items were based on established terminology using Cochrane definitions where possible and were “diabetes,” “depression,” “insulin resistance,” and “insulin sensitivity” (Supplementary Table 1). The titles and/or abstracts were reviewed to exclude any clearly irrelevant studies. The full texts of the remaining studies were then retrieved and read in full by two authors (C.K. and N.S.) independently to determine whether the studies met inclusion criteria. Disagreement was resolved by a third author (K.I.) who independently examined the studies. The reference lists of studies that examine the topic of interest were checked for additional publications while corresponding authors were contacted for additional information on published and unpublished studies.
Criteria for inclusion into the review
Abstracts were considered eligible for full manuscript data extraction if the study met all the following criteria: a) they reported an association between depression and IR (including its reverse measure, low insulin sensitivity); b) sample consisted of adults (≥18 years of age); and c) the design was cross-sectional, observational, or a randomized controlled trial. Studies that excluded patients with depression at baseline or consisted solely of patients with diabetes (or where it was not possible to separate diabetic and nondiabetic participants) were not included.
Data extraction
Using a standardized data extraction sheet, the following information (if available) was extracted and recorded from studies: authors; year of publication; country of origin; study design; total sample size of nondiabetic participants; age; sex; methods of IR assessment; methods of depression assessment; and type of confounders. Authors were contacted to clarify whether prevalent cases of diabetes were excluded at baseline. An attempt to retrieve missing or incomplete data in the published study was made by e-mail to at least two coauthors on at least two occasions. If multiple risk estimates were presented in a given manuscript, the unadjusted estimate was selected for the primary meta-analysis as some studies were adjusted for prominent confounding variables, such as family history and adiposity, while others were not, rendering a direct comparison of estimates to be questionable. Reporting unadjusted estimates also reduces the bias of selective reporting of adjusted estimates in primary studies and the potentiality of overadjustment with multiple confounders, which may also be on the causal pathway for the effect of depression on IR, such as obesity (8). Studies written in a foreign language were translated by mental health professionals fluent in that language.
Quality assessment
There is no consensus as to the best standardized method for assessing the quality of observation studies, and the PRISMA guidelines for randomized controlled trials (7) and Meta-analysis Of Observational Studies in Epidemiology (MOOSE) guidelines for observational studies in epidemiology (9) were used to examine the quality of the studies. These include adequacy of study design (prospective cross-sectional, observational, and randomized controlled trial with an adequate control group); recruitment of sample; ascertainment of depression and IR; and control for cofounding variables, such as age, sex, socioeconomic status, and BMI. The quality of the studies was not summarized with a score, as this approach has been criticized for allocating equal weight to different aspects of methodology (10), but a formal assessment of the risk of bias and strength of evidences according to the Agency for Healthcare Research and Quality (AHRQ) guidelines was conducted (11). A study was considered to be of high quality if the study design was prospective in nature; consecutive or random sampling method was used; the ascertainment of depression was through a structural diagnostic interview based on the ICD (12) or the DSM (13); and cofounders for diabetes and depression (age, sex, ethnicity, BMI/waist circumference, socioeconomic status, physical activity) were accounted for.
Data synthesis and analysis
Meta-analyses were carried out using Stata 10.1 and 11.1 (14,15), with user-contributed commands for meta-analyses: metan, metainf, metabias, metatrim and metareg (16). The Cohen d approach was used to calculate the primary effect size, as it allows data from different platforms to be combined without the use of normalization and can be converted from different effect sizes. It was calculated for the majority of the datasets by the mean difference in IR between depressed and nondepressed groups divided by the pooled SD. The SE of each study’s standardized effect estimate was calculated from the estimated effect and the study’s group sizes according to a formula provided by Cooper and Hedges (17). If Pearson correlation coefficient (rρ) was reported instead, it was transformed into Cohen d using Cohen’s conversion formula (1988):  . The variance was calculated by Vd = 4Vr /(1-r2)3 where Vr is the variance of rp. The same conversion was applied to Spearman correlation coefficients (rs) since rρ is equivalent to rs using rank data or is slightly smaller if the data are binomial distributed (18). In one study (19), the z statistic of a Mann-Whitney U test was used to transform z to r using Fischer transformation
  (20) and then converting r to Cohen d using the above formula. Results reported in odds ratios were transformed in Cohen d using the method recommended by Borenstein et al. (21),
  . The associated variance of d would then be
  and the
  .
.
The effect sizes and SEs of the studies were pooled using random-effects models. The random-effects meta-analysis models were chosen as heterogeneity is expected given the differences in study populations and procedures. The assumption of homogeneity of true effect sizes was assessed by the Cochran Q test (22), and the degree of inconsistency across studies was calculated I2 (23). I2 describes the percentage of total variation across studies that is due to heterogeneity rather than sampling error and ranges between 0% (no inconsistency) and 100% (high heterogeneity) with values of 25, 50, and 75% suggesting low, moderate, and high heterogeneity (23). A priori meta-regression analysis was then performed to assess whether conclusions were sensitive to restricting studies to subgroups that might modify the effect size: i) mean age; ii) sex; iii) method of depression assessment; and iv) method of IR assessment. Random-effects models were used to allow for the residual heterogeneity among attrition rates, which were not modeled by the explanatory variables (24). A secondary analysis of adjusted and corresponding unadjusted data when available was also conducted using the random-effects models.
Sensitivity analyses were conducted to weigh up the relative influence of each individual study on the pooled effect size using STATA’s user-written function, metainf (16). The presence of publishing bias for the hypothesis of an association between depression and IR was assessed informally by visual inspections of funnel plots (25) and corroborated by Begg adjusted rank correlation (26) as implemented in metabias. The nonparametric “trim and fill” method was also used to estimate the number of hypothetical studies that were missing due to possible publication bias and was implemented in STATA’s user-written command, metatrim (16). It is a sensitivity analysis since it relied on strong symmetrical assumption and could be influenced in the presence of strong between-group heterogeneity (27).
RESULTS
Study selection
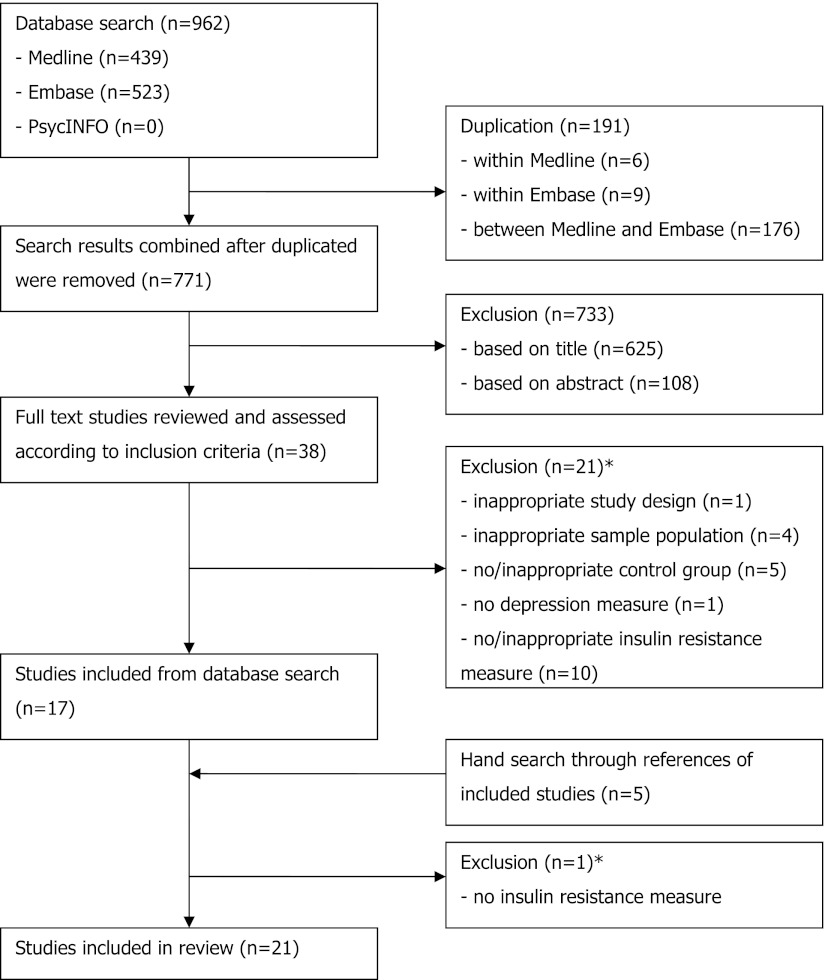
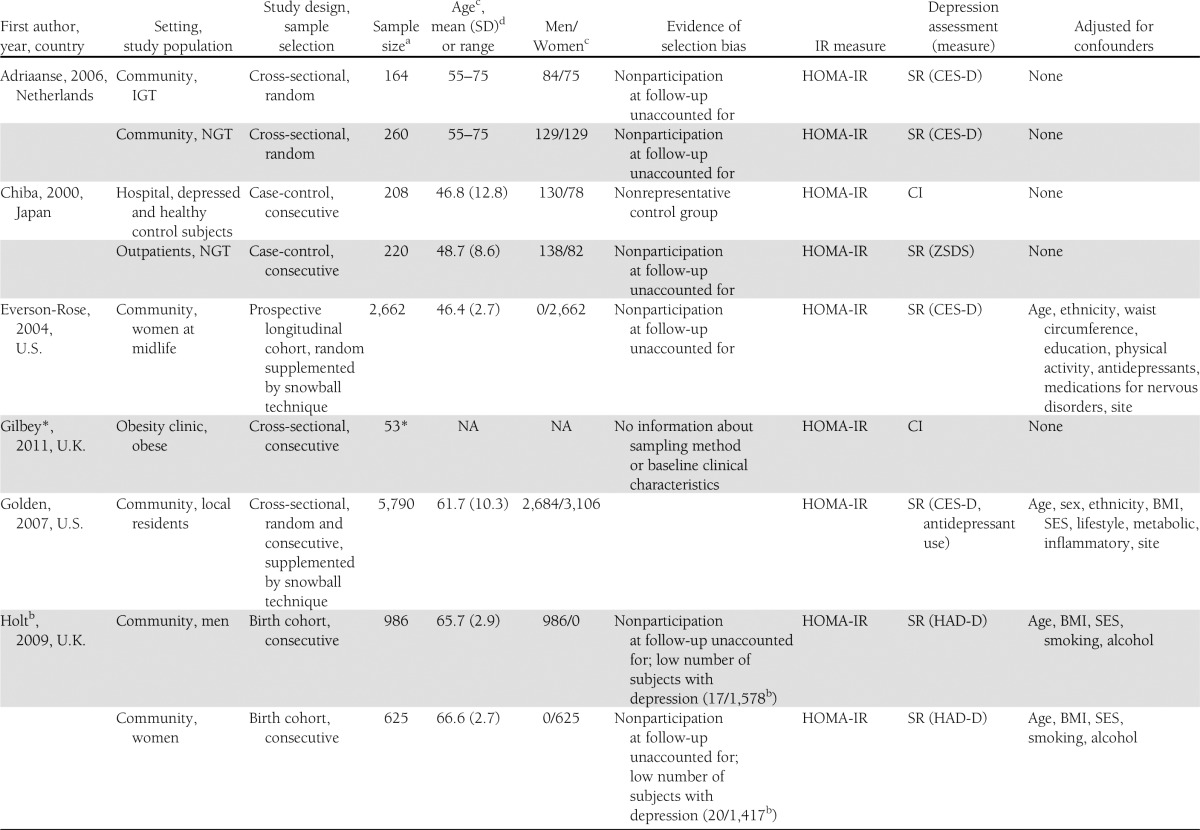
The flowchart is shown in Fig. 1. The literature search resulted in 962 studies. After review of their titles and abstracts, 38 studies met the inclusion criteria and were retrieved for full text. Of these, 21 studies were excluded from the systematic review as they no longer met the inclusion criteria. The search for additional studies among the reference lists of included articles yielded five more studies, with four meeting inclusion criteria. A total of 21 studies were included in the systematic review, and the extracted data are summarized in Table 1.
Figure 1.
Flowchart of systematic review. *Further information in regards to excluded studies can be found in Supplementary Table 1.
Table 1.
Summary table of primary studies included in the systemic review
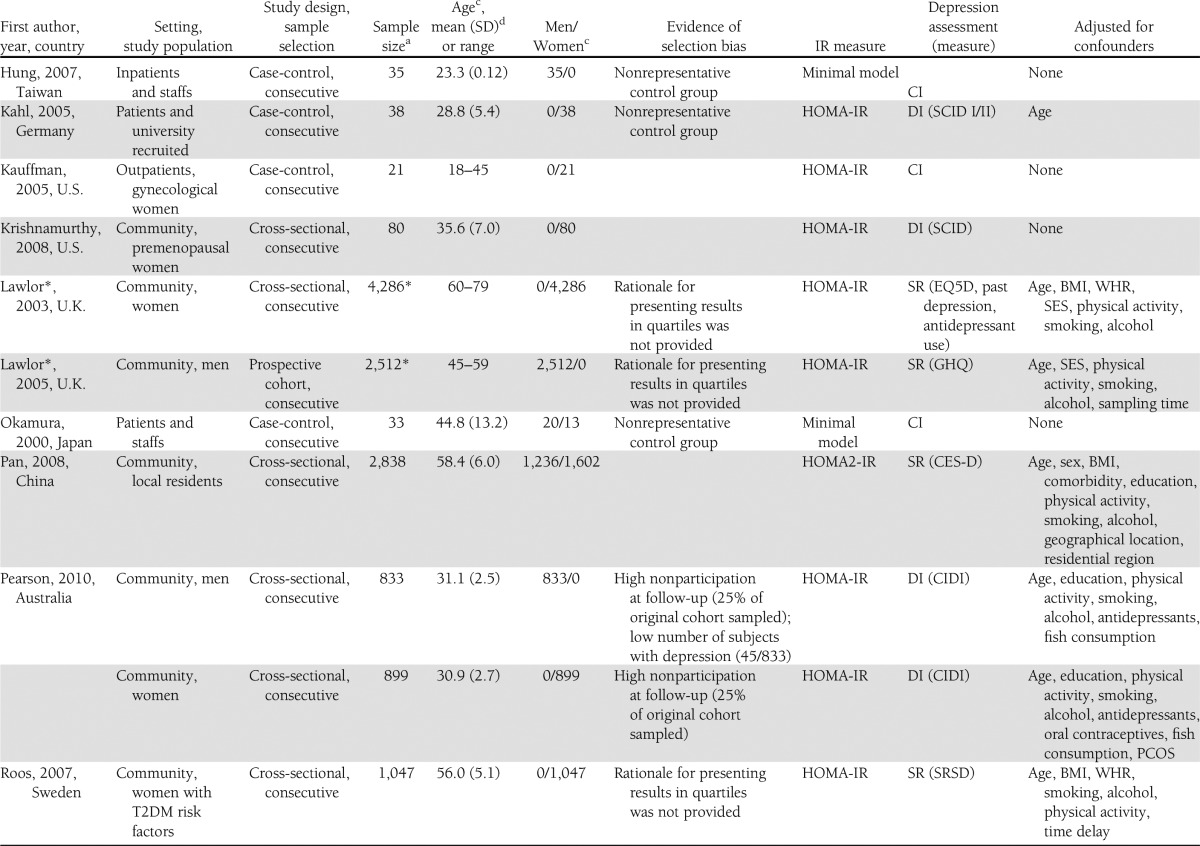
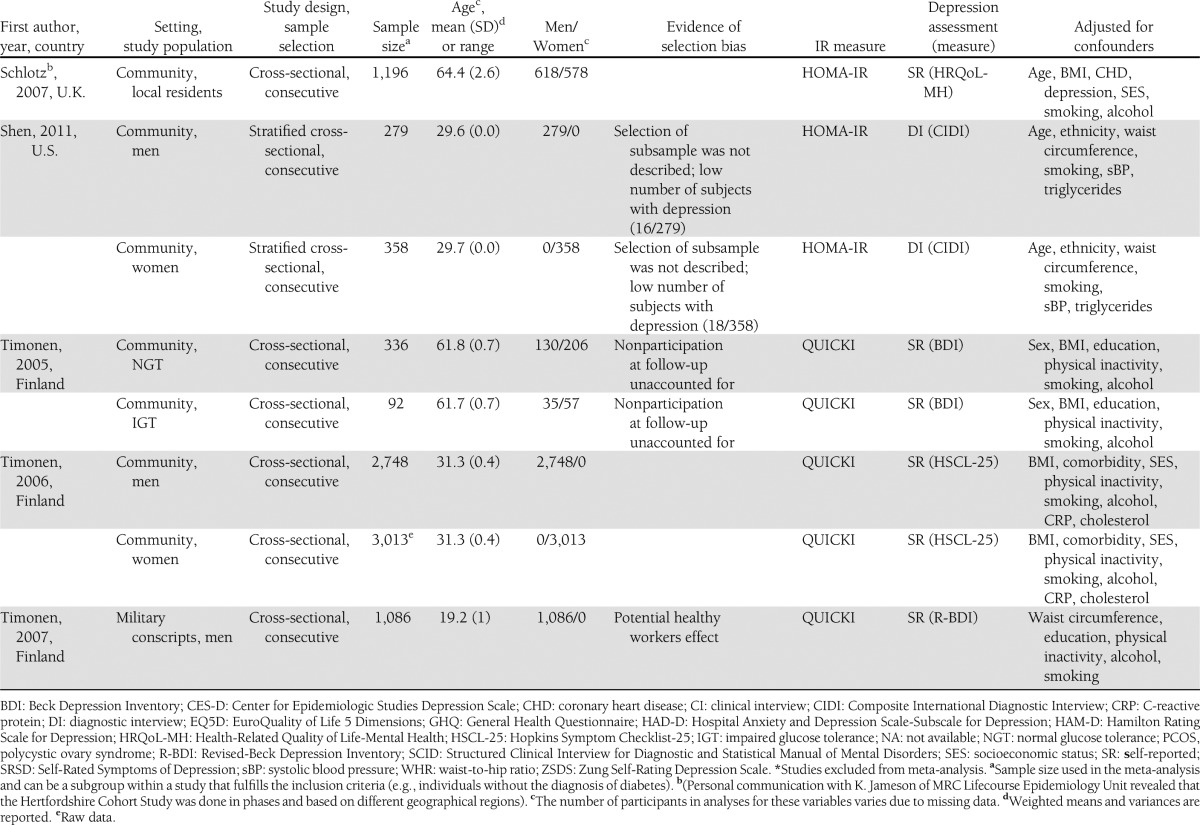
Three studies were excluded from the meta-analysis; one study was published as an abstract (28) and did not include any information about sampling method, baseline clinical characteristics of the sample population, and depression measure. The data of two large cohort studies were presented in quartiles (29,30), and raw data were not available to generate a standardized effect size. This resulted in 18 studies being included in the meta-analysis.
Upon further examination, one study was found to be made up of two separate studies using two different study populations (31), which were therefore separated into two different datasets. The sample for six studies were separated into normal/impaired glucose tolerance (32,33) and men/women (19,34–36), yielding an additional six datasets. The total number of datasets in the meta-analysis was therefore 25.
Qualitative summary
Of the 25 datasets include in the meta-analysis, one was a prospective longitudinal cohort study (37), six were case-control studies (31,38–41), and 18 were cross-sectional studies (19,32–36,42–47). Four datasets were based on clinical diagnosis using DSM-IV, six used semistructured diagnostic interviews, and 15 used self-report depressive scales. IR was reported in 18 datasets while insulin sensitivity was measured in seven datasets. Descriptive data from the datasets are summarized in Table 1.
Meta-analysis
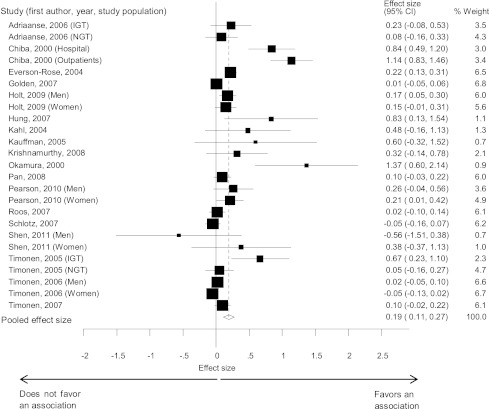
A total of 25 datasets (n = 25,847) provided unadjusted data on the association between depression and IR in adults without diabetes. A random-effects meta-analysis revealed a small pooled estimate of the mean standardized effect sizes (d = 0.19 [95% CI: 0.11–0.27]) (Fig. 2), with the effect sizes ranging from d = -0.56 to d = 1.37. Heterogeneity between the studies was statistically significant (Q (24) = 134.83, P < 0.0001) and large in magnitude (I2 = 82.2%).
Figure 2.
Forest plots showing the effect size of the association between depression and insulin resistance. Estimates are at the center of the boxes and drawn in proportion to the SEs. Lines indicate 95% CIs. Diamond shows the pooled effect size at its center and 95% CI at its horizontal points. IGT, impaired glucose tolerance; NGT, normal glucose tolerance.
Subgroup analysis and meta-regression.
A series of random-effects subgroup analyses and meta-regression was conducted to examine whether the association between depression and IR varied across demographic groups and the methods of depression and IR assessments. Age (β = -0.002 per year, t = -0.50; P = 0.62) or sex (β = 0.0006, t = 0.33; P = 0.74) did not significantly change the observed association between depression and IR. With the random-effects model, a much greater effect size was observed for diagnostic interviews than self-report measures (0.46 [0.22–0.71] vs. 0.13 [0.05–0.21]) and the difference was statistically significant in the meta-regression (z = 2.22, P < 0.0001). A larger effect size with insulin sensitivity as an IR measure was found in comparison with studies using homeostasis model assessment of insulin resistance (HOMA-IR) or HOMA2-IR test (0.32 [0.12–0.53] vs. 0.17 [0.08–0.26]), and the difference was also significant (z = 4.70, P < 0.0001). The observed association between depression and IR remained statistically significant in all subgroup analyses.
Secondary analysis.
Of the 17 datasets with confounders being included, three studies were excluded from the secondary analysis. Depression and IR were not the main outcome of interest in one study (40) and thus, its association was not adjusted for the confounder being measured, while two studies presented their data in quartiles (45,46) and raw data were not available to generate a standardized effect size. This resulted in 14 datasets being included in the random-effects secondary meta-analysis. The estimate of the mean standardized effect sizes was 0.11 (0.04–0.17) for the unadjusted datasets (n = 22,545) and 0.02 (−0.02 to 0.07) for the adjusted datasets (n = 21,826) (Fig. 3).
Figure 3.
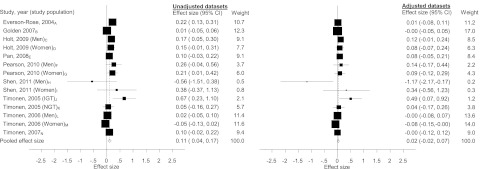
Forest plots of the unadjusted and adjusted association between depression and insulin resistance for studies with confounders included. Confounders adjusted for A: age, ethnicity, waist circumference, education, physical activity, antidepressants, medications for nervous conditions, site; B: age, sex, ethnicity, BMI; C: weight, BMI, waist-to-hip ratio; D: weight, BMI, waist-to-hip ratio; E: age, sex, BMI, comorbidity, education, physical activity, smoking, alcohol, geographical location, residential region; F: age, education, physical activity, smoking, alcohol, antidepressants, fish consumption; G: age, education, physical activity, smoking, alcohol, antidepressants, oral contraceptives, fish consumption, polycystic ovary disease; H: age, ethnicity, waist circumference, smoking, systolic blood pressure, triglyceride; I: age, ethnicity, waist circumference, smoking, systolic blood pressure, triglyceride; J: sex, BMI, education, physical inactivity, smoking, alcohol; K: sex, BMI, education, physical inactivity, smoking, alcohol; L: BMI, comorbidity, socioeconomic status, physical inactivity, smoking, alcohol, C-reactive protein, cholesterol level; M: BMI, comorbidity, socioeconomic status, physical inactivity, smoking, alcohol, C-reactive protein, cholesterol level; and N: waist circumference, education, physical inactivity, alcohol, smoking. IGT, impaired glucose tolerance; NGT, normal glucose tolerance.
Sensitivity analysis and publication bias.
The robustness of the estimate was examined by sequentially removing each study and reanalyzing the remaining datasets. The estimated effect sizes ranged from d = 0.14 to d = 0.21, with all effect sizes being significantly different from 0, suggesting that the significant effect size is not determined by a single study. Sensitivity analysis for the secondary analysis also revealed that no single study has substantial influence on the effect size for the adjusted and unadjusted datasets.
There was some evidence of publishing bias regarding studies of depression and IR from visual inspection of the funnel plot (Supplementary Fig. 1) and the Begg coefficient (z = 2.22, P = 0.027). The trim and fill sensitivity method imputed estimates from nine hypothesized negative unpublished studies. The “publication bias” corrected effect size attenuated to 0.07 (−0.02 to 0.16), and this was not significant (P = 0.117).
Risk of bias and strength of evidence
Given that most studies were cross-sectional and all were observational, the overall risk of bias was medium to high and the study quality was fair. The overall magnitude of association was small and there was substantial heterogeneity between studies, but the estimate was precise as reflected by the narrow CIs and the magnitude of association for diagnostic criteria for depression was larger than for self-report depression measures. This suggests that the strength of evidence is low to moderate.
CONCLUSIONS
Main findings
To our knowledge, this study represents one of the first systematic reviews and meta-analysis of the evidence for an association between depression and IR using data from observational studies, controlled trials, and unpublished data. A small but significant association between depression and IR was observed that was attenuated in analyses adjusted for body weight and other confounders. The magnitude of the association increased when a diagnostic interview for depression was used to define depression or insulin sensitivity was a measure of IR.
Strengths and limitations
The primary strength of this meta-analysis is the expansive literature search but it has several limitations, mainly stemming from the quality of the included studies as summarized in Table 1. There was substantial evidence of heterogeneity and potential publication bias. The observed funnel plot asymmetry could be partly explained by the heterogeneity in depression measure as clinical/diagnostic interviews were the depression assessments in five out of six datasets with a sample size below 100. The random-effects model was chosen to account for heterogeneity and the association remained significant in all subgroup analyses. There was substantial evidence of heterogeneity and potential publication bias.
A further limitation of the study is the inconsistent reporting of results, making it necessary to convert different effect sizes into a common one. The conversion of correlation and odds ratio into Cohen d rely on the assumptions that the distribution of the underlying trait is continuous (21). Association also does not imply causation and the temporal relationship between depression and IR could not be delineated since the present meta-analysis is mainly based on cross-sectional data. Nearly every individual study was a secondary analysis of a study designed to test a different primary hypothesis and this inevitably will result in some measurement bias and residual confounding. The strength of systematic reviews is that by systematically identifying these limitations, future designs can be improved.
Interpretation
These results suggest that the association between depression and diabetes may start at an earlier stage since prevalent cases of diabetes were excluded from this study and IR is on the casual pathway of developing T2DM. This is supported by other recent reviews (6,48) and a recent meta-analysis, which provides evidence for a bidirectional association between depression and metabolic syndrome (49) with hyperglycemia being one of the diagnostic criteria of metabolic syndrome. These results indicate a small but significant association between depression and prediabetes or other biomarkers of glucose dysregulation.
There are several possible pathophysiological mechanisms that may explain the observed relationship. Depression is associated with disruption to the hypothalamic-pituitary adrenal axis, causing an increase in cortisol and catecholamine, hormones responsible for antagonizing the hypoglycemic effects of insulin and resulting in IR (50). People with diagnostic depression have increased levels of inflammation (51), and psychological stresses have been shown to activate the innate inflammatory response with chronic cytokinaemia leading to IR and β-cell apoptosis, antecedents to the development of T2DM (52). Depression can also have influences on lifestyle behaviors associated with diabetes risk factors such as dietary intake, exercise, and medication adherence (53,54). Findings from the secondary analysis using data adjusted for confounders, such as obesity, might explain some of the observed associations between depression and IR, although it should be interpreted with caution as body weight has been postulated to be on the casual pathway for depression and IR, raising the potentiality of overadjustment.
The type of depression assessment makes a substantive difference in the observed association between depression and IR, which may in part reflect a greater sensitivity of clinical interviews in detecting depression. Self-report measures such as the Center for Epidemiologic Studies Depression Scale (CES-D) have been validated in epidemiological studies (55) but uncertainty remains in regards to their relation to clinically diagnosed depression. Estimates of depression have been suggested to differ depending on the use of dimensionally verses categorically based depression assessment tools (56). The method at which IR is being measured also has an impact upon the finding. There are several different methods to measure depression and IR. The hyperinsulinemic-euglycemic clamp is currently the gold standard but is unsuitable for large-scale cross-sectional studies for practical reasons. Good correlation has been demonstrated between estimates from HOMA and euglycemic clamp (Rs = 0.88, P < 0.0001) (57), whereas the quantitative insulin sensitivity check index (QUICKI) has been suggested to be superior to HOMA-IR (58). Some studies have, however, shown that minimal model analysis from frequently sampled intravenous glucose tolerance tests underestimates insulin sensitivity (59).
Implications
This review suggests that it is now time to move from repeating cross-sectional studies to studies examining causal relationships. The ideal study design could either be a prospective design of patients potentially at high risk for T2DM (e.g., positive family history of diabetes); with or without diagnostic depression; matched for at least age, sex, obesity, and change in IR measured over time; or a randomized controlled trial in a sample of depressed patients testing whether intensive treatment of depression (pharmacological or psychological) leads to improvements in IR and other markers of glucose dysregulation. Further secondary analyses are unlikely to contribute further to the field unless there is adequate assessment of potential confounding.
Conclusion
This systematic review and meta-analysis contributes to the growing evidence of a small but persistent association between depression and the onset of T2DM.
Supplementary Material
Acknowledgments
C.K. receives salary support from the National Institute for Health Research Mental Health Biomedical Research Centre at South London, Maudsley National Health Service Foundation Trust, and King's College London.
No potential conflicts of interest relevant to this study were reported.
C.K., N.S., S.H.G., and K.I. designed the protocol with contributions from U.R. and M.T. C.K. and N.S. extracted the data while C.K. wrote the manuscript. D.S. supervised the statistical analysis. All authors reviewed and edited the manuscript.
The authors would like to thank An Pan, National University of Singapore; Jari Jokelainen, University of Oulu, Finland; Holly Syddall and Karen Jameson, MRC Lifecourse Epidemiology Unit, University of Southampton, UK, for providing further data to complete the meta-analysis, and Giovanni Cizza, National Institute of Diabetes and Digestive and Kidney Diseases; Michael Deuschle, Central Institute of Mental Health; Susan Everson-Rose, University of Minnesota; and Sue Pearson, University of Tasmania, for clarifying the methodology of their studies.
Footnotes
This article contains Supplementary Data online at http://care.diabetesjournals.org/lookup/suppl/doi:10.2337/dc12-1442/-/DC1.
The views expressed are those of the authors and not necessarily those of the National Health Service, the National Institute for Health Research, or the Department of Health.
References
- 1.Anderson RJ, Freedland KE, Clouse RE, Lustman PJ. The prevalence of comorbid depression in adults with diabetes: a meta-analysis. Diabetes Care 2001;24:1069–1078 [DOI] [PubMed] [Google Scholar]
- 2.Lustman PJ, Clouse RE. Depression in diabetic patients: the relationship between mood and glycemic control. J Diabetes Complications 2005;19:113–122 [DOI] [PubMed] [Google Scholar]
- 3.de Groot M, Anderson R, Freedland KE, Clouse RE, Lustman PJ. Association of depression and diabetes complications: a meta-analysis. Psychosom Med 2001;63:619–630 [DOI] [PubMed] [Google Scholar]
- 4.Ismail K, Winkley K, Stahl D, Chalder T, Edmonds M. A cohort study of people with diabetes and their first foot ulcer: the role of depression on mortality. Diabetes Care 2007;30:1473–1479 [DOI] [PubMed] [Google Scholar]
- 5.Katon WJ, Rutter C, Simon G, et al. The association of comorbid depression with mortality in patients with type 2 diabetes. Diabetes Care 2005;28:2668–2672 [DOI] [PubMed] [Google Scholar]
- 6.Mezuk B, Eaton WW, Albrecht S, Golden SH. Depression and type 2 diabetes over the lifespan: a meta-analysis. Diabetes Care 2008;31:2383–2390 [DOI] [PMC free article] [PubMed] [Google Scholar]
- 7.Moher D, Liberati A, Tetzlaff J, Altman DG, PRISMA Group Preferred reporting items for systematic reviews and meta-analyses: the PRISMA statement. PLoS Med 2009;6:e1000097. [DOI] [PMC free article] [PubMed] [Google Scholar]
- 8.Morris AA, Ahmed Y, Stoyanova N, et al. The association between depression and leptin is mediated by adiposity. Psychosom Med 2012;74:483–488 [DOI] [PMC free article] [PubMed] [Google Scholar]
- 9.Stroup DF, Berlin JA, Morton SC, et al. Meta-analysis of observational studies in epidemiology: a proposal for reporting. Meta-analysis of observational studies in epidemiology (MOOSE) group. JAMA 2000;283:2008–2012 [DOI] [PubMed] [Google Scholar]
- 10.Jüni P, Altman DG, Egger M. Systematic reviews in health care: assessing the quality of controlled clinical trials. BMJ 2001;323:42–46 [DOI] [PMC free article] [PubMed] [Google Scholar]
- 11.Owens DK, Lohr KN, Atkins D, et al. AHRQ series paper 5: grading the strength of a body of evidence when comparing medical interventions—agency for healthcare research and quality and the effective health-care program. J Clin Epidemiol 2010;63:513–523 [DOI] [PubMed] [Google Scholar]
- 12.World Health Organization. The ICD-10 classification of mental and behavioural disorders: clinical descriptions and diagnostic guidelines World Health Organization, 1992 [Google Scholar]
- 13.American Psychiatric Association. Diagnostic and statistical manual of mental disorders: DSM-IV-TR Washington, DC, American Psychiatric Association, 2000 [Google Scholar]
- 14.StataCorp, Stata Statistical Software: Release 11. 2009
- 15.StataCorp, Stata Statistical Software: Release 10. 2007
- 16.Sterne JAC, Newton HJ, Cox NJ. Meta-Analysis in Stata: An Updated Collection from the Stata Journal College Station, TX, Stata Press, 2009 [Google Scholar]
- 17.Cooper HM, Hedges LV. The Handbook of Research Synthesis New York, Russell Sage Foundation, 1994 [Google Scholar]
- 18.Gilpin AR. Table for conversion of Kendall's Tau to Spearman's Rho within the context of measures of magnitude of effect for meta-analysis. Educ Psychol Meas 1993;53:87–92 [Google Scholar]
- 19.Shen Q, Bergquist-Beringer S, Sousa VD. Major depressive disorder and insulin resistance in nondiabetic young adults in the United States: the National Health and Nutrition Examination Survey, 1999-2002. Biol Res Nurs 2011;13:175–181 [DOI] [PubMed] [Google Scholar]
- 20.Rosenthal, R. Meta-analytic Procedures For Social Research Newbury Park, CA, Sage Publications, 1991
- 21.Borenstein M, Hedges LV, Higgins JPT, Rothstein HR. Introduction to Meta-Analysis New York, John Wiley & Sons, 2009 [Google Scholar]
- 22.Cochran WG. The comparison of percentages in matched samples. Biometrika 1950;37:256–266 [PubMed] [Google Scholar]
- 23.Higgins JP, Thompson SG, Deeks JJ, Altman DG. Measuring inconsistency in meta-analyses. BMJ 2003;327:557–560 [DOI] [PMC free article] [PubMed] [Google Scholar]
- 24.Thompson SGS, Sharp SJ. Explaining heterogeneity in meta-analysis: a comparison of methods. Stat Med 1999;18:2693–2708 [DOI] [PubMed] [Google Scholar]
- 25.Egger M, Davey Smith G, Schneider M, Minder C. Bias in meta-analysis detected by a simple, graphical test. BMJ 1997;315:629–634 [DOI] [PMC free article] [PubMed] [Google Scholar]
- 26.Begg CB, Mazumdar M. Operating characteristics of a rank correlation test for publication bias. Biometrics 1994;50:1088–1101 [PubMed] [Google Scholar]
- 27.Higgins JPT, Green S. Cochrane Handbook for Systematic Reviews of Interventions New York, John Wiley & Sons, 2011 [Google Scholar]
- 28.Gilbey MP, Casale C, Lei S, et al. Prevalence and treatment of depression are differentially associated with insulin resistance and obesity. 1st Joint Meeting of the International Society for Autonomic Neuroscience and the American Autonomic Society (ISAN/AAS 2011), Buzios, Rio de Janeiro, Brazil, September 12–16, 2011( Abstracts). Clin Auton Res 2011;21:215–308 [DOI] [PubMed] [Google Scholar]
- 29.Lawlor DA, Smith GD, Ebrahim S, British Women’s Heart and Health Study Association of insulin resistance with depression: cross sectional findings from the British Women’s Heart and Health Study. BMJ 2003;327:1383–1384 [DOI] [PMC free article] [PubMed] [Google Scholar]
- 30.Lawlor DA, Ben-Shlomo Y, Ebrahim S, et al. Insulin resistance and depressive symptoms in middle aged men: findings from the Caerphilly prospective cohort study. BMJ 2005;330:705–706 [DOI] [PMC free article] [PubMed] [Google Scholar]
- 31.Chiba M, Suzuki S, Hinokio Y, et al. Tyrosine hydroxylase gene microsatellite polymorphism associated with insulin resistance in depressive disorder. Metabolism 2000;49:1145–1149 [DOI] [PubMed] [Google Scholar]
- 32.Timonen M, Laakso M, Jokelainen J, Rajala U, Meyer-Rochow VB, Keinänen-Kiukaanniemi S. Insulin resistance and depression: cross sectional study. BMJ 2005;330:17–18 [DOI] [PMC free article] [PubMed] [Google Scholar]
- 33.Adriaanse MC, Dekker JM, Nijpels G, Heine RJ, Snoek FJ, Pouwer F. Associations between depressive symptoms and insulin resistance: the Hoorn Study. Diabetologia 2006;49:2874–2877 [DOI] [PubMed] [Google Scholar]
- 34.Holt RI, Phillips DI, Jameson KA, Cooper C, Dennison EM, Peveler RC, Hertfordshire Cohort Study Group The relationship between depression and diabetes mellitus: findings from the Hertfordshire Cohort Study. Diabet Med 2009;26:641–648 [DOI] [PubMed] [Google Scholar]
- 35.Timonen M, Rajala U, Jokelainen J, Keinänen-Kiukaanniemi S, Meyer-Rochow VB, Räsänen P. Depressive symptoms and insulin resistance in young adult males: results from the Northern Finland 1966 birth cohort. Mol Psychiatry 2006;11:929–933 [DOI] [PubMed] [Google Scholar]
- 36.Pearson S, Schmidt M, Patton G, et al. Depression and insulin resistance: cross-sectional associations in young adults. Diabetes Care 2010;33:1128–1133 [DOI] [PMC free article] [PubMed] [Google Scholar]
- 37.Everson-Rose SA, Meyer PM, Powell LH, et al. Depressive symptoms, insulin resistance, and risk of diabetes in women at midlife. Diabetes Care 2004;27:2856–2862 [DOI] [PubMed] [Google Scholar]
- 38.Hung YJ, Hsieh CH, Chen YJ, et al. Insulin sensitivity, proinflammatory markers and adiponectin in young males with different subtypes of depressive disorder. Clin Endocrinol (Oxf) 2007;67:784–789 [DOI] [PubMed] [Google Scholar]
- 39.Kauffman RP, Castracane VD, White DL, Baldock SD, Owens R. Impact of the selective serotonin reuptake inhibitor citalopram on insulin sensitivity, leptin and basal cortisol secretion in depressed and non-depressed euglycemic women of reproductive age. Gynecol Endocrinol 2005;21:129–137 [DOI] [PubMed] [Google Scholar]
- 40.Kahl KG, Bester M, Greggersen W, et al. Visceral fat deposition and insulin sensitivity in depressed women with and without comorbid borderline personality disorder. Psychosom Med 2005;67:407–412 [DOI] [PubMed] [Google Scholar]
- 41.Okamura F, Tashiro A, Utumi A, et al. Insulin resistance in patients with depression and its changes during the clinical course of depression: minimal model analysis. Metabolism 2000;49:1255–1260 [DOI] [PubMed] [Google Scholar]
- 42.Golden SH, Lee HB, Schreiner PJ, et al. Depression and type 2 diabetes mellitus: the multiethnic study of atherosclerosis. Psychosom Med 2007;69:529–536 [DOI] [PubMed] [Google Scholar]
- 43.Krishnamurthy P, Romagni P, Torvik S, et al. P.O.W.E.R. (Premenopausal, Osteoporosis Women, Alendronate, Depression) Study Group Glucocorticoid receptor gene polymorphisms in premenopausal women with major depression. Horm Metab Res 2008;40:194–198 [DOI] [PubMed] [Google Scholar]
- 44.Pan A, Ye X, Franco OH, et al. Insulin resistance and depressive symptoms in middle-aged and elderly Chinese: findings from the Nutrition and Health of Aging Population in China Study. J Affect Disord 2008;109:75–82 [DOI] [PubMed] [Google Scholar]
- 45.Roos C, Lidfeldt J, Agardh CD, et al. Insulin resistance and self-rated symptoms of depression in Swedish women with risk factors for diabetes: the Women’s Health in the Lund Area study. Metabolism 2007;56:825–829 [DOI] [PubMed] [Google Scholar]
- 46.Schlotz W, Ambery P, Syddall HE, et al. Hertfordshire Cohort Study Group Specific associations of insulin resistance with impaired health-related quality of life in the Hertfordshire Cohort Study. Qual Life Res 2007;16:429–436 [DOI] [PubMed] [Google Scholar]
- 47.Timonen M, Salmenkaita I, Jokelainen J, et al. Insulin resistance and depressive symptoms in young adult males: findings from Finnish military conscripts. Psychosom Med 2007;69:723–728 [DOI] [PubMed] [Google Scholar]
- 48.Nouwen A, Winkley K, Twisk J, et al. European Depression in Diabetes (EDID) Research Consortium Type 2 diabetes mellitus as a risk factor for the onset of depression: a systematic review and meta-analysis. Diabetologia 2010;53:2480–2486 [DOI] [PMC free article] [PubMed] [Google Scholar]
- 49.Pan A, Sun Q, Czernichow S, et al. Bidirectional association between depression and obesity in middle-aged and older women. Int J Obes (Lond) 2012;36:595–602 [DOI] [PMC free article] [PubMed] [Google Scholar]
- 50.Musselman DL, Betan E, Larsen H, Phillips LS. Relationship of depression to diabetes types 1 and 2: epidemiology, biology, and treatment. Biol Psychiatry 2003;54:317–329 [DOI] [PubMed] [Google Scholar]
- 51.Howren MB, Lamkin DM, Suls J. Associations of depression with C-reactive protein, IL-1, and IL-6: a meta-analysis. Psychosom Med 2009;71:171–186 [DOI] [PubMed] [Google Scholar]
- 52.Black PH. The inflammatory response is an integral part of the stress response: implications for atherosclerosis, insulin resistance, type II diabetes and metabolic syndrome X. Brain Behav Immun 2003;17:350–364 [DOI] [PubMed] [Google Scholar]
- 53.DiMatteo MR, Lepper HS, Croghan TW. Depression is a risk factor for noncompliance with medical treatment: meta-analysis of the effects of anxiety and depression on patient adherence. Arch Intern Med 2000;160:2101–2107 [DOI] [PubMed] [Google Scholar]
- 54.Marcus MD, Wing RR, Guare J, Blair EH, Jawad A. Lifetime prevalence of major depression and its effect on treatment outcome in obese type II diabetic patients. Diabetes Care 1992;15:253–255 [DOI] [PubMed] [Google Scholar]
- 55.McDowell I. Measuring Health: A Guide to Rating Scales and Questionnaires. Newell C, Ed. New York, Oxford University Press, 1987 [Google Scholar]
- 56.Kessler RC. The categorical versus dimensional assessment controversy in the sociology of mental illness. J Health Soc Behav 2002;43:171–188 [PubMed] [Google Scholar]
- 57.Matthews DR, Hosker JP, Rudenski AS, Naylor BA, Treacher DF, Turner RC. Homeostasis model assessment: insulin resistance and beta-cell function from fasting plasma glucose and insulin concentrations in man. Diabetologia 1985;28:412–419 [DOI] [PubMed] [Google Scholar]
- 58.Rabasa-Lhoret R, Bastard JP, Jan V, et al. Modified quantitative insulin sensitivity check index is better correlated to hyperinsulinemic glucose clamp than other fasting-based index of insulin sensitivity in different insulin-resistant states. J Clin Endocrinol Metab 2003;88:4917–4923 [DOI] [PubMed] [Google Scholar]
- 59.Cobelli C, Caumo A, Omenetto M. Minimal model SG overestimation and SI underestimation: improved accuracy by a Bayesian two-compartment model. Am J Physiol 1999;277:E481–E488 [DOI] [PubMed] [Google Scholar]
Associated Data
This section collects any data citations, data availability statements, or supplementary materials included in this article.


