

Abstract
OBJECTIVE
Mixed-meal tolerance test (MMTT) area under the curve C-peptide (AUC CP) is the gold-standard measure of endogenous insulin secretion in type 1 diabetes but is intensive and invasive to perform. The 90-min MMTT-stimulated CP ≥0.2 nmol/L (90CP) is related to improved clinical outcomes, and CP ≥0.1 nmol/L is the equivalent fasting measure (FCP). We assessed whether 90CP or FCP are alternatives to a full MMTT.
RESEARCH DESIGN AND METHODS
CP was measured during 1,334 MMTTs in 421 type 1 diabetes patients aged <18 years at 3, 9, 18, 48, and 72 months duration. We assessed: 1) correlation between mean AUC CP and 90CP or FCP; 2) sensitivity and specificity of 90CP ≥0.2 nmol/L and FCP ≥ 0.1 nmol/L to detect peak CP ≥0.2 nmol/L and the equivalent AUC CP; and 3) how the time taken to reach the CP peak varied with age of diagnosis and diabetes duration.
RESULTS
AUC CP was highly correlated to 90CP (rs = 0.96; P < 0.0001) and strongly correlated to FCP (rs = 0.84; P < 0.0001). AUC CP ≥23 nmol/L/150 min was the equivalent cutoff for peak CP ≥0.2 nmol/L (98% sensitivity/97% specificity). A 90CP ≥0.2 nmol/L correctly classified 96% patients using AUC or peak CP, whereas FCP ≥0.1 nmol/L classified 83 and 85% patients, respectively. There was only a small difference seen between peak and 90CP (median 0.02 nmol/L). The CP peak occurred earlier in patients with longer diabetes duration (6.1 min each 1-year increase in duration) and younger age (2.5 min each 1-year increase).
CONCLUSIONS
90CP is a highly sensitive and specific measure of AUC and peak CP in children and adolescents with type 1 diabetes and offers a practical alternative to a full MMTT.
The mixed-meal tolerance test (MMTT) is the gold-standard measure of endogenous insulin secretion in type 1 diabetes, with a higher peak C-peptide (CP) and reduced adverse effects compared with glucagon stimulation (1–3). The full MMTT is predominantly used in research and rarely performed in routine clinical practice due to the intensity of sampling, with samples required every 30 min for 2 h to allow measurement of area under the curve (AUC) and peak CP (2).
A single measure of CP would be advantageous both for the patient and the clinician if it adequately reflects values obtained in the full MMTT. In a cross-sectional study of 259 patients aged 8–35 years, CP has been shown to usually peak at 90 min (90CP) during an MMTT (3), and 90CP ≥0.2 nmol/L has been related to improved clinical outcomes both with less complications and less severe hypoglycemia (4). Fasting CP (FCP) is frequently used in clinical practice because it is known to be well-correlated to stimulated CP (5–10), but in more careful studies of preservation of residual insulin secretion, the AUC after an MMTT has been regarded as necessary (1,2). The validity of 90CP and FCP as alternatives to the full MMTT have not been fully investigated, particularly in young children or in studies when longitudinal measures are taken, allowing the impact of diabetes duration to be assessed.
We aimed to assess whether 90CP and FCP were reliable measures of AUC and peak insulin secretion during the MMTT.
RESEARCH DESIGN AND METHODS
Patients
A total of 421 type 1 diabetes patients diagnosed at ages <18 years and attending the Pediatric Clinic, University Hospital, Linköping, Sweden, between January 1976 and March 2011 were included in the study.
Blood sampling
Serum CP and glucose were measured at diagnosis of diabetes before the first insulin injection and during a 150-min MMTT with 30-min sampling at 3, 9, 18, 30, 48, and 72 months diabetes duration.
MMTT
The meal test was performed in the morning (between 7 and 10 a.m.) after an overnight fast, with no food or drink (with the exception of water) and no smoking after 10 p.m. the preceding day. Patients took no short-acting insulin at least 6 h prior to the test, but those on continuous subcutaneous insulin infusion could continue with their normal basal rate, but could receive no added boluses for at least 6 h prior to the test. From 1976–2005, patients ingested a standardized breakfast ingested over 10 min calculated by a dietitian based on the total caloric need of the patient (25–30% of their daily caloric intake; 50% of the calories as carbohydrates, 33% lipids, and 17% proteins). From 2005 onwards, the patients were tested with an MMTT consisting of ingestion of 6 mL Sustacal/kg body weight with a maximum of 360 mL (1 calorie/mL; 55% carbohydrates, 21% lipids and 24% protein) ingested within 5 min, in keeping with a change in practice at that time. Blood samples for CP and glucose were taken before eating and then at intervals of 30 min for 150 min. The meal tests were offered to all patients in the clinic >7 years old, and the participation rate was >90%. The tests were continued until the patient no longer had any residual insulin secretion (defined as <0.03 nmol/L, the level of detection of the assay). In patients aged <7 years, participation rate fell with age due to practical and psychological difficulties with venepuncture.
Laboratory methods
The serum samples were stored at −20°C until analysis. In the period of the study, CP was measured by the contemporary assay at the research laboratory of the Division of Pediatrics, Linköping University. During the study period, three different assays were used. Before June 2000, CP was determined by radioimmunoassay according to Heding (11). Between June 2000 and September 2004, CP was analyzed by enzyme-linked immunosorbent assay according to the manufacturer’s recommendations (DRG Diagnostics, Marburg, Germany). From October 2004, CP measurement was performed with a time-resolved fluoroimmunoassay (AutoDELFIA C-peptide kit; Wallac) with a software program (1224 MultiCalc; Wallac) used for automatic calculation of values.
Statistical analyses were repeated for the three assays separately, but as the results of the analyses were similar for all assays, we present the results from the whole cohort.
Ethical considerations
This study was approved by the Research Ethics Committee of the Faculty of Health Sciences, Linköping University.
Statistical analyses
The results were only included in the analysis if blood samples taken at each time point during the 150-min MMTT were available to allow calculation of peak and AUC CP. As CP values were not normally distributed, nonparametric analysis was used. A subanalysis was performed in patients who had complete MMTT data available over 120 min.
Spearman’s rank correlation coefficient was used to assess the association between AUC CP and 90CP or FCP at each diabetes duration, with the mean values being used when assessing the association in the whole cohort. Linear regression equations were determined for the association between AUC CP and peak CP, and cutoffs in AUC equivalent to peak CP ≥0.2 nmol/L were derived using this equation. Sensitivity and specificity for significant endogenous insulin secretion (defined by the derived AUC CP) and for peak insulin secretion (peak CP ≥0.2 nmol/L) were assessed for 90 ≥0.2 nmol/L and FCP ≥0.1 nmol/L, according to cutoffs described previously (4,12).
Age of diagnosis was split by tertiles for the whole cohort (<10 years of age, n = 141; 10–13 years, n = 139; ≥13 years, n = 141). The time taken to reach the peak CP (mean [95% CI]) was determined at each diabetes duration and by age of diagnosis. The association between time to CP peak and duration of diabetes and age at diagnosis was modeled using linear mixed-effects models, with individual identification added as a random factor. The CP values (fasting and peak) were assessed at different diabetes durations and by age of diagnosis.
Kaplan-Meier survival analysis was used to assess the ability of FCP and age at diagnosis to predict the time that patients take to become severely insulin-deficient (defined as peak CP <0.2 nmol/L), with current duration used in the cases of censored data in which last recorded peak CP was >0.2 nmol/L. Cox regression analysis was used to determine the contribution of both factors to CP decline.
Statistical analysis was performed in SPSS version 15 (SPSS), and a probability level of P < 0.05 was assumed statistically significant.
RESULTS
A total of 421 patients (55% male, age of diagnosis [interquartile range] 11.0 [8.5–13.9] years) and 1,334 MMTTs were included. The subanalysis of MMTT data over 120 min included 1,540 MMTTs from 445 patients.
Equivalent cutoffs in AUC CP
During the full MMTT, ≥23 nmol/L/150 min was the equivalent AUC CP to detect peak CP ≥0.2 nmol/L, with 98% sensitivity and 97% specificity for the combined data set (n = 1,334). This was similar when data were analyzed separately at the different diabetes durations (Supplementary Table 1). When assessing MMTT data over 120 min, the equivalent AUC to detect peak CP ≥0.2 nmol/L was AUC CP ≥18 nmol/L/120 min (98% sensitivity/97% specificity).
Using 90CP and FCP instead of full MMTT
90CP.
Mean AUC CP was highly correlated to mean 90CP for the combined data set (rs = 0.96; P < 0.0001) (Fig. 1A) and in the MMTT data over 120 min (rs = 0.98; P < 0.0001). The AUC CP and 90CP correlations remain strong at different durations of diabetes (rs = 0.96–0.99; P < 0.0001) (Supplementary Table 2).
Figure 1.

Correlation between mean AUC CP and mean 90-min–stimulated serum CP (rs = 0.96) (A) and mean FCP (rs = 0.84) (B) during a 150-min MMTT (n = 421).
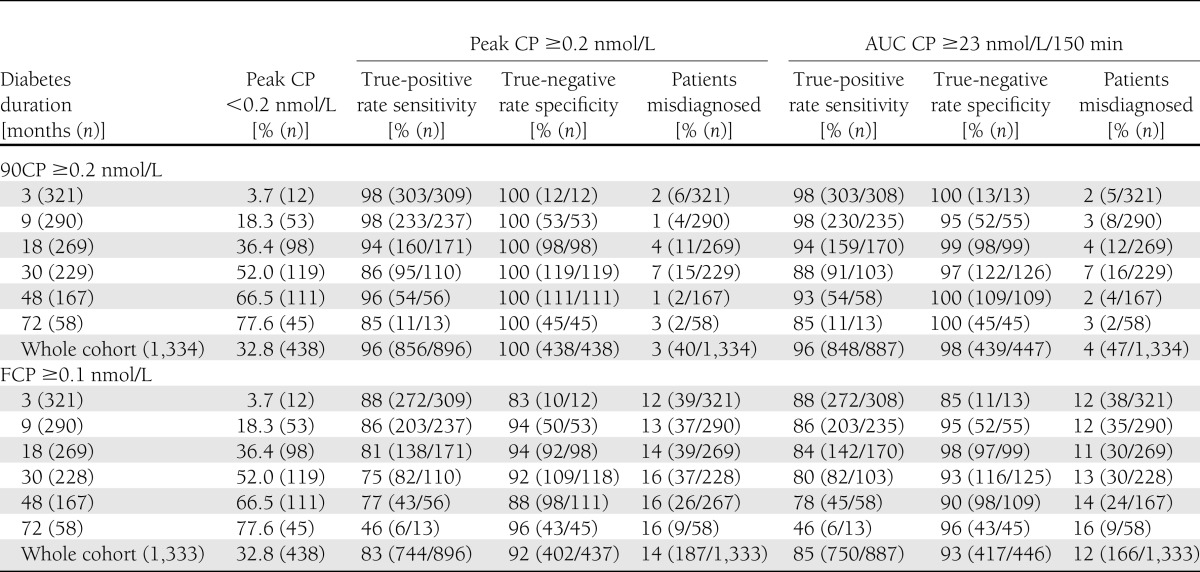
If CP was measured at 90 min, rather than performing a full MMTT, this would have correctly classified 96% patients for detecting both peak CP ≥0.2 nmol/L and AUC CP ≥23 nmol/L/150 min. This was similar when the data were analyzed at separate diabetes durations (Table 1).
Table 1.
Sensitivity and specificity for peak CP ≥0.2 nmol/L and AUC CP ≥23 nmol/L/150 min according to 90CP ≥0.2 and FCP ≥0.1 nmol/L
FCP.
The mean AUC CP and mean FCP were strongly correlated in the MMTT over 150 min (rs = 0.84; P < 0.0001) and in the MMTT over 120 min (rs = 0.86; P < 0.0001), but this was weaker than the association between 90CP and AUC CP (Fig. 1B). The correlations varied between 0.71 and 0.89 over the different diabetes durations (Supplementary Table 3).
Using FCP ≥0.1 nmol/L still correctly classified the majority of patients according to either peak CP ≥0.2 nmol/L (83%) or AUC CP ≥23 nmol/L/150 min (85%), but was less sensitive and specific to identify patients compared with 90CP ≥0.2 nmol/L (Table 1).
Timing and magnitude of the CP peak during the MMTT
Only 23% patients peaked at 90 min during the MMTT (Supplementary Table 4). The mean time taken to reach the CP peak occurred earlier in patients with a longer diabetes duration and in those diagnosed at a young age (Fig. 2A). For every 1 year increase in diabetes duration, the time to CP peak decreased by 6.1 min (β [95% CI] = −6.1 [−7.5 to −4.6]). For every year increase in age at diagnosis, the time to CP peak increased by 2.5 min (β = 2.5 [1.7–3.4]). CP values (peak and fasting) were higher in patients with shorter diabetes duration and in those diagnosed at an older age (Fig. 2B and Supplementary Table 5).
Figure 2.

Timing and magnitude of the CP peak during 150-min MMTT, split by age of diagnosis tertiles (<10 years [white bar], n = 141; 10–13 years [light gray bar], n = 139; and ≥13 years [dark gray bar], n = 141). A: The CP peak occurs earlier with increasing diabetes duration and younger age of diagnosis (1,334 MMTTs in 421 patients). B: Peak CP values reduce with increasing diabetes duration and are lower in younger patients (1,334 MMTTs in 421 patients).
Although CP peaked at different time points during the MMTT depending on the age at diagnosis and diabetes duration, there was only a small difference seen between peak and 90CP (median 0.01–0.05 nmol/L) for the six different diabetes durations. The magnitude of this difference reduced with increasing diabetes duration (Supplementary Table 6).
Prediction of insulin deficiency
Kaplan-Meier analysis is based on patients with diabetes duration up to 48 months (n = 347). FCP measured at diagnosis can be used to predict the time taken for patients to become insulin-deficient (peak CP <0.2 nmol/L; P < 0.0001) (Fig. 3A). Those with the lowest tertile of FCP (<0.17 nmol/L) reached insulin deficiency quicker than those in the highest tertile of FCP (≥0.29 nmol/L) (50% insulin deficient by median 30 months [95% CI: 26–34] vs. 48 months [33–63]; P < 0.0001).
Figure 3.

Kaplan-Meier survival plots to show the impact of FCP (A) and age at diagnosis (B) on the time taken for patients to become insulin deficient (peak CP <0.2 nmol/L). A: FCP is divided by tertiles, in which dashed black line refers to FCP <0.17 nmol/L, solid black line refers to FCP 0.17–0.29 nmol/L, and dashed gray line refers to FCP ≥0.29 nmol/L. Current duration is used in the cases of censored data (+) in which last recorded peak CP is >0.2 nmol/L). B: Age of diagnosis is divided by tertiles, in which dashed black line refers to age <10 years, solid black line refers to age 10–13 years, and dashed gray line refers to age ≥13 years. Current duration is used in the cases of censored data (+) in which last recorded peak CP is >0.2 nmol/L).
Age of diagnosis also predicted the time taken for patients to become insulin-deficient (Fig. 3B). Those diagnosed at a younger age (<10 years) became insulin-deficient faster than those diagnosed at an older age (≥13 years) (50% insulin deficient by median 18 months [95% CI 13–23] vs. 48 months [37–59]; P < 0.0001).
Age of diagnosis and FCP were both independent predictors of insulin deficiency (peak CP <0.2 nmol/L) when added into a Cox regression analysis (age of diagnosis hazard ratio = 0.89 [95% CI: 0.85–0.93]; FCP hazard ratio = 0.25 [0.11–0.57]).
Effect of glucose on CP
There was only a very weak relationship between fasting blood glucose and FCP (at 3 months’ diabetes duration, n = 308 [rs = 0.13; P = 0.02]).
There was a weak inverse relationship between fasting glucose and both peak CP (rs = −0.25; P < 0.0001) and the CP increment (peak-FCP) (rs = −0.36; P < 0.0001) during the MMTT at 3 months’ diabetes duration. Similar associations were observed when patients were included if they had a fasting blood glucose between 70 and 200 mg/dL (4.1–11.1 mmol/L) on the test day (n = 274; rs = −0.33; P < 0.0001).
CONCLUSIONS
In this study of children and adolescents with type 1 diabetes, we have shown that 90-min–stimulated CP offers a highly sensitive and specific measure of peak insulin secretion and AUC CP and is a more reliable measure than FCP. This suggests that a single blood test measuring CP at 90 min is a useful alternative to a full MMTT.
Assessment of endogenous insulin secretion
Previous studies have evaluated and used 90CP or FCP. However, these were either cross-sectional (3–10) or, when assessing endogenous insulin secretion longitudinally, a single blood test measuring fasting (12), random (13), or 90CP (14) rather than a full MMTT was used. We assess MMTTs longitudinally in children >6 years of age and also add to the literature by assessing sensitivity and specificity of a single blood measure at each time point to allow the impact of diabetes duration to be assessed.
AUC CP was more strongly correlated with 90CP than FCP. The stronger association between FCP and stimulated CP reported by others (r = 0.88–0.95) compared with our results may be explained by the inclusion of patients with longer diabetes durations in these studies (3,5,6). When we limit our studies to patients of similar diabetes duration (median 1 to 2 years), the correlations are higher and similar to those previously reported. The improved correlation with longer diabetes duration may reflect that patients with short duration diabetes and more endogenous insulin secretion show greater variation between fasting and stimulated values.
90CP was more sensitive and specific than FCP to identify patients with endogenous insulin secretion (peak and AUC CP). FCP ≥0.1 nmol/L has been used to determine patient eligibility into type 1 diabetes intervention trials (15–17). Using this cutoff would result in 12% of patients being incorrectly classified as CP-negative compared with only 2% if 90CP was used, with only a small difference seen between peak and 90CP. This means that the use of FCP of >0.1 nmol/L for inclusion in intervention trials leads to unnecessary exclusion of patients who would have been suitable.
Timing of the CP peak
This is the first large prospective study looking at the timing of the CP peak during the MMTT in type 1 diabetes patients at different diabetes durations. Our results show that the time to reach the CP peak occurred earlier in patients with longer diabetes duration and in those diagnosed at a younger age. This is supported by cross-sectional studies. Greenbaum et al. (3) found that in patients recruited at a mean diabetes duration of 1.5 years, CP usually peaks around 90 min during an MMTT, and 90CP ≥0.2 nmol/L has been shown to be related to improved clinical outcomes (4). Our data demonstrate that the timing of the CP peak is also influenced by the diabetes duration as well as by the age that the patient is diagnosed.
Influence of diabetes duration, age of diagnosis, and glucose
The higher CP values seen in our study in patients diagnosed at an older age and in those collected closer to diagnosis are consistent with previous reports (3–5,14,18–21).
The modest inverse relationship between fasting glucose and the CP response found in our study agrees with some previous studies (3,22). Others have found that the CP response is positively associated with the fasting glucose (23), with maximum CP response seen at blood glucose ∼12 mmol/L (24,25), whereas others have reported only a deleterious effect in the presence of hypoglycemia (<3.5 mmol/L) (26,27) or no effect at all (28).
Predicting CP decline
Lower CP levels at diagnosis and a younger age of diagnosis were both associated with the fastest rate of β-cell decline. When assessed in a combined model, both were independent predictors. This suggests that both FCP at diagnosis and age of diagnosis can be used to estimate the time it will take for patients to become insulin-deficient. A number of factors are known to influence the rate of CP decline in type 1 diabetes, including FCP and age of diagnosis (21,29). We have not assessed the other factors previously described, which include diabetic ketoacidosis at diagnosis, antibody status, HLA genotype, and intensive insulin treatment (4,14,19,30–33).
Limitations
Three different CP assays and two different meal stimuli were used in this study over a 35-year period (1976–2011). Different CP assays can result in different absolute values (34), and values prior to 2000 were slightly lower than measurements after this date. However, the correlations between AUC and peak/90CP or FCP do not change when the three assay periods or when the two different meal stimuli were analyzed separately, and the MMTT series were analyzed with the same method for each test (Supplementary Table 7).
Implications
The MMTT is usually undertaken in type 1 diabetes intervention trials in children. The feasibility of using a single blood test measuring CP at 90 min rather than multiple samples has practical benefit both for the patient and the clinician. A 90-min sample could be used instead of FCP to offer more patients entry into intervention studies. Other studies assessing β-cell function could reliably use 90CP rather than AUC or peak CP during an MMTT to assess β-cell function. In practical terms, this would mean fewer blood samples (one compared with five in a standard MMTT), a shorter duration required for the patient to stay in the research facilities (90 compared with 120 min), and a reduced cost to run the study and analyze the samples.
In conclusion, our study demonstrates that in children and adolescents with type 1 diabetes, a mixed-meal stimulated 90-min CP is a highly sensitive, specific, and practical alternative measure to peak and AUC CP, with advantages over FCP.
Supplementary Material
Acknowledgments
Support for this study was provided by Diabetes UK, through funding from a Clinical Training Fellowship to R.E.J.B., and from the Barndiabetesfonden (The Swedish Child Diabetes Foundation) and the Swedish Research Council. B.M.S. and A.T.H. are funded as core members of the Peninsula NIHR Clinical Research Facility.
No potential conflicts of interest relevant to this article were reported.
R.E.J.B. designed the study, performed the analysis, and wrote the manuscript. B.M.S. performed the analysis and reviewed and edited the manuscript. R.C. was for some time responsible for CP determinations and reviewed and edited the manuscript. A.T.H. designed the study and reviewed and edited the manuscript. J.L. recruited patients, arranged all meal tests, designed the study, and reviewed and edited the manuscript. J.L. is the guarantor of this work and, as such, had full access to all the data in the study and takes responsibility for the integrity of the data and the accuracy of the data analysis.
Footnotes
This article contains Supplementary Data online at http://care.diabetesjournals.org/lookup/suppl/doi:10.2337/dc12-0836/-/DC1.
References
- 1.Greenbaum CJ, Harrison LC, Immunology of Diabetes Society Guidelines for intervention trials in subjects with newly diagnosed type 1 diabetes. Diabetes 2003;52:1059–1065 [DOI] [PubMed] [Google Scholar]
- 2.Palmer JP, Fleming GA, Greenbaum CJ, et al. C-peptide is the appropriate outcome measure for type 1 diabetes clinical trials to preserve beta-cell function: report of an ADA workshop, 21-22 October 2001. Diabetes 2004;53:250–264 [DOI] [PubMed] [Google Scholar]
- 3.Greenbaum CJ, Mandrup-Poulsen T, McGee PF, et al. Type 1 Diabetes Trial Net Research Group. European C-Peptide Trial Study Group Mixed-meal tolerance test versus glucagon stimulation test for the assessment of beta-cell function in therapeutic trials in type 1 diabetes. Diabetes Care 2008;31:1966–1971 [DOI] [PMC free article] [PubMed] [Google Scholar]
- 4.The Diabetes Control and Complications Trial Research Group Effect of intensive therapy on residual beta-cell function in patients with type 1 diabetes in the diabetes control and complications trial. A randomized, controlled trial. Ann Intern Med 1998;128:517–523 [DOI] [PubMed] [Google Scholar]
- 5.The DCCT Research Group Effects of age, duration and treatment of insulin-dependent diabetes mellitus on residual beta-cell function: observations during eligibility testing for the Diabetes Control and Complications Trial (DCCT). J Clin Endocrinol Metab 1987;65:30–36 [DOI] [PubMed] [Google Scholar]
- 6.Daneman D, Clarson C. Residual beta-cell function in children with type 1 diabetes: measurement and impact on glycemic control. Clin Invest Med 1987;10:484–487 [PubMed] [Google Scholar]
- 7.Gjessing HJ, Matzen LE, Frøland A, Faber OK. Correlations between fasting plasma C-peptide, glucagon-stimulated plasma C-peptide, and urinary C-peptide in insulin-treated diabetics. Diabetes Care 1987;10:487–490 [DOI] [PubMed] [Google Scholar]
- 8.Hendriksen C, Faber OK, Drejer J, Binder C. Prevalence of residual B-cell function in insulin-treated diabetics evaluated by the plasma C-etide response to intravenous glucagon. Diabetologia 1977;13:615–619 [DOI] [PubMed] [Google Scholar]
- 9.Faber OK, Binder C. C-peptide response to glucagon. A test for the residual beta-cell function in diabetes mellitus. Diabetes 1977;26:605–610 [DOI] [PubMed] [Google Scholar]
- 10.Garcia-Webb P, Bonser A, Welborn TA. Correlation between fasting serum C-peptide and B cell insulin secretory capacity in diabetes mellitus. Diabetologia 1982;22:296. [DOI] [PubMed] [Google Scholar]
- 11.Heding LG. Radioimmunological determination of human C-peptide in serum. Diabetologia 1975;11:541–548 [DOI] [PubMed] [Google Scholar]
- 12.Greenbaum CJ, Anderson AM, Dolan LM, et al. SEARCH Study Group Preservation of beta-cell function in autoantibody-positive youth with diabetes. Diabetes Care 2009;32:1839–1844 [DOI] [PMC free article] [PubMed] [Google Scholar]
- 13.Komulainen J, Kulmala P, Savola K, et al. Clinical, autoimmune, and genetic characteristics of very young children with type 1 diabetes. Childhood Diabetes in Finland (DiMe) Study Group. Diabetes Care 1999;22:1950–1955 [DOI] [PubMed] [Google Scholar]
- 14.Mortensen HB, Swift PG, Holl RW, et al. Hvidoere Study Group on Childhood Diabetes Multinational study in children and adolescents with newly diagnosed type 1 diabetes: association of age, ketoacidosis, HLA status, and autoantibodies on residual beta-cell function and glycemic control 12 months after diagnosis. Pediatr Diabetes 2010;11:218–226 [DOI] [PubMed] [Google Scholar]
- 15.Lazar L, Ofan R, Weintrob N, et al. Heat-shock protein peptide DiaPep277 treatment in children with newly diagnosed type 1 diabetes: a randomised, double-blind phase II study. Diabetes Metab Res Rev 2007;23:286–291 [DOI] [PubMed] [Google Scholar]
- 16.Raz I, Avron A, Tamir M, et al. Treatment of new-onset type 1 diabetes with peptide DiaPep277 is safe and associated with preserved beta-cell function: extension of a randomized, double-blind, phase II trial. Diabetes Metab Res Rev 2007;23:292–298 [DOI] [PubMed] [Google Scholar]
- 17.Ludvigsson J, Faresjö M, Hjorth M, et al. GAD treatment and insulin secretion in recent-onset type 1 diabetes. N Engl J Med 2008;359:1909–1920 [DOI] [PubMed] [Google Scholar]
- 18.Steele C, Hagopian WA, Gitelman S, et al. Insulin secretion in type 1 diabetes. Diabetes 2004;53:426–433 [DOI] [PubMed] [Google Scholar]
- 19.Bonfanti R, Bazzigaluppi E, Calori G, et al. Parameters associated with residual insulin secretion during the first year of disease in children and adolescents with Type 1 diabetes mellitus. Diabet Med 1998;15:844–850 [DOI] [PubMed] [Google Scholar]
- 20.Wallensteen M, Dahlquist G, Persson B, et al. Factors influencing the magnitude, duration, and rate of fall of B-cell function in type 1 (insulin-dependent) diabetic children followed for two years from their clinical diagnosis. Diabetologia 1988;31:664–669 [DOI] [PubMed] [Google Scholar]
- 21.Ludvigsson J, Heding LG, Larsson Y, Leander E. C-peptide in juvenile diabetics beyond the postinitial remission period. Relation to clinical manifestations at onset of diabetes, remission and diabetic control. Acta Paediatr Scand 1977;66:177–184 [DOI] [PubMed] [Google Scholar]
- 22.Greenbaum C, Seidel K, Pihoker C. The case for intravenous arginine stimulation in lieu of mixed-meal tolerance tests as outcome measure for intervention studies in recent-onset type 1 diabetes. Diabetes Care 2004;27:1202–1204 [DOI] [PubMed] [Google Scholar]
- 23.Madsbad S, Sauerbrey N, Møller-Jensen B, Krarup T, Kühl C. Outcome of the glucagon test depends upon the prevailing blood glucose concentration in type I (insulin-dependent) diabetic patients. Acta Med Scand 1987;222:71–74 [DOI] [PubMed] [Google Scholar]
- 24.Ludvigsson J. Methodological aspects on C-peptide measurements. Acta Med Scand Suppl 1983;671:53–59 [DOI] [PubMed] [Google Scholar]
- 25.Gjessing HJ, Reinholdt B, Faber OK, Pedersen O. The effect of acute hyperglycemia on the plasma C-peptide response to intravenous glucagon or to a mixed meal in insulin-dependent diabetes mellitus. Acta Endocrinol (Copenh) 1991;124:556–562 [DOI] [PubMed] [Google Scholar]
- 26.Arnold-Larsen S, Madsbad S, Kühl C. Reproducibility of the glucagon test. Diabet Med 1987;4:299–303 [DOI] [PubMed] [Google Scholar]
- 27.Rönnemaa T. Practical aspects in performing the glucagon test in the measurement of C-peptide secretion in diabetic patients. Scand J Clin Lab Invest 1986;46:345–349 [DOI] [PubMed] [Google Scholar]
- 28.Mirel RD, Ginsberg-Fellner F, Horwitz DL, Rayfield EJ. C-Peptide reserve in insulin-dependent diabetes. Comparative responses to glucose, glucagon and tolbutamide. Diabetologia 1980;19:183–188 [DOI] [PubMed] [Google Scholar]
- 29.Törn C, Landin-Olsson M, Lernmark A, et al. Prognostic factors for the course of beta cell function in autoimmune diabetes. J Clin Endocrinol Metab 2000;85:4619–4623 [DOI] [PubMed] [Google Scholar]
- 30.Schiffrin A, Suissa S, Weitzner G, Poussier P, Lalla D. Factors predicting course of beta-cell function in IDDM. Diabetes Care 1992;15:997–1001 [DOI] [PubMed] [Google Scholar]
- 31.Knip M, Ilonen J, Mustonen A, Akerblom HK. Evidence of an accelerated B-cell destruction in HLA-Dw3/Dw4 heterozygous children with type 1 (insulin-dependent) diabetes. Diabetologia 1986;29:347–351 [DOI] [PubMed] [Google Scholar]
- 32.Decochez K, Keymeulen B, Somers G, et al. Belgian Diabetes Registry Use of an islet cell antibody assay to identify type 1 diabetic patients with rapid decrease in C-peptide levels after clinical onset. Belgian Diabetes Registry. Diabetes Care 2000;23:1072–1078 [DOI] [PubMed] [Google Scholar]
- 33.Peig M, Gomis R, Ercilla G, Casamitjana R, Bottazzo GF, Pujol-Borrell R. Correlation between residual beta-cell function and islet cell antibodies in newly diagnosed type I diabetes. Follow-up study. Diabetes 1989;38:1396–1401 [DOI] [PubMed] [Google Scholar]
- 34.Little RR, Rohlfing CL, Tennill AL, et al. Standardization of C-peptide measurements. Clin Chem 2008;54:1023–1026 [DOI] [PubMed] [Google Scholar]
Associated Data
This section collects any data citations, data availability statements, or supplementary materials included in this article.