

Abstract
OBJECTIVE
The association between habitual physical activity (PA) and lowered risk of all-cause mortality (ACM) and cardiovascular disease (CVD) has been suggested in patients with diabetes. This meta-analysis summarizes the risk reduction in relation to PA, focusing on clarifying dose-response associations.
RESEARCH DESIGN AND METHODS
Electronic literature searches were conducted for cohort studies that examined relative risk (RR) of ACM or CVD in relation to PA in patients with diabetes. For the qualitative assessment, RR for the highest versus the lowest PA category in each study was pooled with a random-effects model. We added linear and spline regression analyses to assess the quantitative relationship between increases in PA and ACM and CVD risk.
RESULTS
There were 17 eligible studies. Qualitatively, the highest PA category had a lower RR [95% CI] for ACM (0.61 [0.52–0.70]) and CVD (0.71 [0.60–0.84]) than the lowest PA category. The linear regression model indicated a high goodness of fit for the risk of ACM (adjusted R2 = 0.44, P = 0.001) and CVD (adjusted R2 = 0.51, P = 0.001), with the result that a 1 MET-h/day incrementally higher PA was associated with 9.5% (5.0–13.8%) and 7.9% (4.3–11.4%) reductions in ACM and CVD risk, respectively. The spline regression model was not significantly different from the linear model in goodness of fit (P = 0.14 for ACM risk; P = 0.60 for CVD risk).
CONCLUSIONS
More PA was associated with a larger reduction in future ACM and CVD risk in patients with diabetes. Nevertheless, any amount of habitual PA was better than inactivity.
Persons with diabetes have a 50–60% higher risk of all-cause mortality (ACM) and cardiovascular death than those without diabetes, and cardiovascular disease (CVD) remains the primary cause of death in the U.S. among diabetic patients (1). Lifestyle modification, which mainly focuses on controlling energy intake and increasing daily physical activity (PA), is a major component of programs to reduce cardiovascular risk factors that coexist with diabetes in addition to pharmacologic approaches (2).
Results of lifestyle alterations in controlled settings, in particular exercise interventions, have not yet been replicated in primary care settings or in actual daily life, as only a few studies have indicated that such interventions have contributed to reductions in incident CVD (3,4). In addition, implementing supervised exercise therapy often may be difficult due to the perceived high cost per patient and the amount of time necessary per patient for each session (5). Therefore, exercise therapy is inevitably limited to merely general recommendations rather than interventions supervised by practitioners. Quantitative evidence for PA-related benefits is essential for practitioners to prescribe self-management goals of a specific PA volume for patients with diabetes and to motivate patients to maintain adherence to this prescription. The aim of this meta-analysis is to clarify the relationship between habitual PA and future ACM or incident CVD in patients with diabetes, focusing on the dose-response association.
RESEARCH DESIGN AND METHODS
Search strategy
We conducted electronic literature searches (MEDLINE, 1950–2011 September; EMBASE, 1974–2011 September) for cohort studies that investigated the relationship between PA and ACM/CVD risk, where study keywords were thesaurus terms registered in MEDLINE (MeSH) or EMBASE (EMTREE) and text words related to diabetes, PA, ACM/CVD, and text words related to cohort studies. These key concepts were combined using the Boolean operator “and.” Details of the keywords are shown in Supplementary Table 1. Reference lists from the identified articles were manually examined for relevant articles. No language restriction was imposed.
Inclusion criteria
The initial inclusion criteria were as follows 1) prospective or retrospective cohort study without exercise intervention; 2) all subjects had diabetes; 3) ACM or CVD was an independent study end point; and 4) the effect measure (i.e., relative risk [RR] or odds ratio [OR]) and its corresponding SE for high PA categories compared with the lowest PA category in each study were provided or could be calculated.
Studies that included coronary heart disease (CHD) but that did not include stroke as an end point were also included because CHD represents the greatest portion of CVDs. If a study separately assessed CHD and stroke risk in relation to PA, we gave priority to data on CHD risk. We also included studies if they considered fatal CVD but did not include nonfatal CVD as an end point. However, if the risk of CVD death and a CVD event were separately investigated, priority was given to the CVD event because a CVD event, which includes both fatal and nonfatal outcomes, is a broader concept. Similarly, priority was given to CVD risk if a study separately investigated both CVD and CHD risk.
Any type of PA was considered. However, we selected the data on the wider spectrum of PA if a study separately investigated two or more types of PA (e.g., total PA and leisure-time PA [LTPA], LTPA and walking, etc.).
Data extraction
Two authors (S.K. and H.So.) independently extracted key study characteristics. Disagreement was solved by discussion. The effect measure in each study was extracted or, if not directly provided, calculated based on data on the number of cases and noncases in referent (i.e., lowest PA category) and nonreferent (i.e., other PA categories) groups. We considered the OR as an indicator of RR based on the assumption that the OR is an approximation of the RR, although this assumption has some limitations (6). If a study provided several effect measures, such as unadjusted and adjusted effect measures, the most completely adjusted effect measure was used.
For assessment of study quality, we selected the five relevant items, which were formed as questions, from the 16 components in the study quality assessment guidelines proposed by Powell et al. (7) and modified them as follows 1) Is the instrument for measuring PA validated? 2) Does PA allow quantification? 3) Were the outcomes determined by the specified criteria when the patient’s medical record was considered to have information on the specific outcome for that patient while other sources of information such as registries for study outcomes, death certificates, or the patient’s self-report did not? 4) Was the adjustment for the confounders sufficient when “sufficient adjustment” was defined as considering the following five classic cardiovascular risk factors: age, sex, smoking, dyslipidemia (or LDL/total cholesterol level), and hypertension? and 5) Were subjects that were lost to follow-up excluded from the analysis?
Data synthesis
We conducted separate meta-analyses for ACM and CVD risk, but types of PA were not separately analyzed. Generally, the SE is provided for a logarithm of each risk measure (log RR) rather than the risk measure itself. Therefore, log RR was used as an expression of the effect size (i.e., strength of the association). The SE was calculated from the CI or, if not provided, was calculated by the following formula:
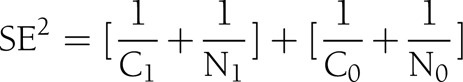 |
where C0 and N0 indicate the number of cases and noncases in the referent group, respectively, and C1 and N1 indicate the number of cases and noncases in the nonreferent group, respectively.
For qualitative assessment of PA benefit for ACM and CVD risk, the log RR for the highest versus the lowest PA category in each study was pooled with an inverse variance method. The pooled RR was calculated by an exponentiation of the pooled log RR. Study heterogeneity was assessed by Q statistics or I2 overall and within each strata after the stratification (8). The pooled estimate was based on a random-effects model if the between-study heterogeneity was statistically significant; otherwise it was based on a fixed-effects model (9).
Stratified analyses were conducted on the following study characteristics that we identified on the basis of previously extracted data from the included studies: study outcome (CVD/CHD only, fatal only/both fatal and nonfatal), country (U.S./non-U.S.), mean age (<60 years/≥60 years) (the cut-off value was a priori determined because it approximated the median of the mean age in each included study in this meta-analysis), proportion of men (≥50%/<50%), mean BMI (<27.8 kg/m2 [in men], <27.3 kg/m2 [in women], <27.5 [in men and women combined]/≥27.8 kg/m2 [in men], ≥27.3 kg/m2 [in women], ≥27.5 [in men and women combined]/not available) (10), validation of PA questionnaire (no/yes), number of PA categories (≥3/<3 [i.e., dichotomized]), PA type (total PA/LTPA/walking), PA quantification (no/yes), methods for ascertainment of outcome (self-report or questionnaire/registry/medical record/combined), mean follow-up duration (≥10 years/<10 years), presence of lost to follow-up (no/yes), and sufficient adjustment for classic risk factors (no/yes). Meta-regression analysis was used to test the differences in RR among strata in the stratified analysis.
Publication bias was primarily based on visual assessment using a funnel plot, where the SE of log RR for the highest versus the lowest PA category in each study was plotted against the log RR, where it was assumed that if there was no publication bias the plot would be symmetrical. Secondarily, goodness of symmetry was confirmed by statistical assessment using two formal methods, Begg rank correlation test and Egger regression asymmetry test (11,12). For statistically suspected publication bias, the trim and fill method was adopted to adjust the pooled risk (13). This method includes assumption of some unpublished studies that cause the funnel plot to be asymmetrical, plotting the data points so that the funnel plot is symmetrical, and recalculating the pooled risk estimates based on the hypothesis that studies corresponding to these data points actually had existed.
We added the quantitative assessment of the relationship between PA and ACM or CVD risk for studies that allowed qualification of PA, where we assigned point estimates of PA for each category by extracting the mean level of daily PA. If mean data were not provided, we alternatively used the midpoint of the upper and lower boundaries in each category. If the upper boundary of the highest PA category or the lowest PA category was not described, we assumed that the breadth of PA in these categories was equal to that of their closest PA category (14). To standardize the PA dose, we used a common unit (MET-h), where 1 MET-h corresponds to energy expenditure (EE) while sitting at rest for 1 h. For example, a person who regularly walks 3 h/week at 3 METs of intensity has an EE calculated as 3 × 3 = 9 MET-h/week. In the study (15) that estimated the PA dose in terms of kcal, PA was converted to MET-h by dividing the product of the coefficient β = 1.05 and mean body weight estimated from mean BMI, where we assumed that 1 MET-h = 1.05 kcal/kg and the mean height of men was 1.75 m and that of women was 1.60 m. If PA was expressed as daily total EE (16), we assumed that daily total PA is equal to total EE minus resting EE although, strictly speaking, the estimated PA would be lower than the actual PA due to ignoring the resting metabolic rate during exercise.
When a study expressed PA as a specific activity (e.g., walking, gardening, etc.) and its duration, we defined the intensity of the activity according to the globally used compendium of PAs by Ainsworth et al. (17): gardening, 5.5 METs; cycling, 7.5 METs; lifting, 6 METs; swimming, 6 METs; aerobics, 5.5 METs; jogging, 7.3 METs; golf, 4.8 METs; basketball, 6.5 METs; tennis, 5.5 METs; and brisk walking, 4.3 METs. This compendium (17) defines the intensity of light, moderate, and vigorous PA as <3, 3–6, and >6 METs, respectively. We converted the point estimates of intensity of these PAs into 1.5, 4.5, and 7.5 METs.
Firstly, we assumed a log-linear relationship between PA and ACM and CVD risk and adopted weighted, least-squared regression models. Secondly, we added the restricted cubic spline regression model for further investigation of the shape of the relationship. In these models, the log RR for each nonreferent group was regressed on the higher PA dose compared with the lowest PA category. Data were analyzed using STATA software version 12 (StataCorp, College Station, TX). Two-sided P < 0.05 was considered as statistically significant except for the test of publication bias, in which the level of significance was P < 0.10 (18).
RESULTS
Literature search
Supplementary Fig. 1 shows details of the literature search. Of 4,815 articles retrieved from the combination of MEDLINE and EMBASE electronic literature searches, 17 studies (15,16,19–33) met the prespecified inclusion criteria. Only one study (20) was a retrospective cohort study and in only one study (15) did all patients have type 1 diabetes. Nevertheless, these studies were included in this meta-analysis.
Supplementary Table 2 shows the details of the characteristics of the 17 included studies of which 13 and 12 assessed ACM and CVD risk, respectively. Ten studies (15,16,21,24–26,29,31–33) validated the instrument for measuring PA, and quantification of PA was allowed in seven studies (15,16,24,25,29,31,33) of which six (15,16,25,29,31,33) and five (24,25,29,31,33) studies assessed ACM and CVD risk, respectively. Only two studies (27,31) exclusively used medical records for ascertainment of CVD. None of the 13 studies evaluating the risk of ACM used medical records. Only four studies (20,22,25,26) excluded patients who were lost to follow-up. Although the consideration of confounders varied among studies, less than half of the included studies (eight studies) (19,21,24–26,29,31,33) adjusted the effect measure for all of the five following classic CVD risk factors: age, sex, smoking, dyslipidemia, and hypertension. The details of the confounding factors in each study are shown in Supplementary Table 3.
Qualitative assessment of the association of high PA with ACM and CVD risk
Of the 17 included studies, 13 and 12 assessed ACM and CVD risk, respectively. In two studies that assessed the risk of ACM and CVD, the same patients were investigated (25,26). We chose one of these studies (26) for the qualitative analysis because it assessed total PA while the other study (25) examined the risk of ACM and CVD according to several types of PA. However, we used the latter study (25) for the subsequent quantitative analysis because it allowed quantification of PA while the former (26) did not. One study (15) that investigated ACM risk had two datasets since men and women were analyzed separately. Finally, the number of available datasets for ACM and CVD risk in relation to high PA was 13 and 11, respectively.
Figure 1 is a forest plot for ACM and CVD risk in relation to high PA in patients with diabetes. The definition of the highest and lowest PA varied among studies. The pooled RR (95% CI) of ACM and CVD was 0.60 (0.52–0.70) and 0.71 (0.60–0.84), respectively. Between-study heterogeneity in the log RR was highly significant (P < 0.001 for ACM risk; P < 0.001 for CVD risk. However, the risk measure was below 1 except for two studies [28,29]).
Figure 1.

Pooled risk with 95% CI of ACM (A) and CVD risk (B) for the highest vs. the lowest PA in patients with diabetes. Point estimates in each study and the overall risk measure are indicated in circles and diamonds, respectively. Horizontal lines indicate the range of 95% CI. Areas of the square are proportional to the study weight (i.e., inverse of variance).
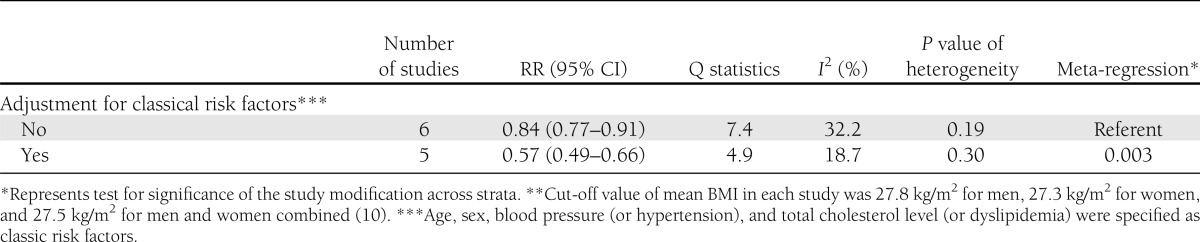
Table 1 (ACM risk) and Table 2 (CVD risk), respectively, show the results of the stratified analyses for the key study characteristics and of the meta-regression analyses testing the significance for the effect of the characteristics on the magnitude of the risk measure for the highest versus lowest PA group in patients with diabetes. The lower risk associated with high PA was remarkable in studies that excluded diabetic patients who were lost to follow-up for both ACM and CVD risk (P < 0.001 and P = 0.006, respectively). Additionally, ACM risk was lower in studies with a relatively older population (mean age ≥60 years) (P = 0.03), and CVD risk was lower in studies with adjustment for classic CVD risk factors (P = 0.003). However, lower risks of ACM and CVD were consistently observed throughout all strata with each study characteristic.
Table 1.
Stratified analyses of pooled RR of ACM for high versus low PA

Table 2.
Stratified analyses of pooled RR of CVD

Statistically significant publication bias was suspected for ACM risk (P = 0.04 for the Begg and Egger tests) while it was not for CVD risk (Begg test, P = 0.39; Egger test, P = 0.24). The visual funnel plot as shown in Supplementary Fig. 2 also suggested publication bias that tended to overestimate the lower risk of ACM associated with the high PA due to missing studies showing a nonsignificant association that should have been published. Therefore, we tried to detect the predicted missing studies and adjusted for the publication bias using the trim and fill method as described in Research Design and Methods. However, ACM risk was not changed after the adjustment because of insufficient statistical power to detect these hypothetical missing studies.
Dose-response relationship between PA and ACM or CVD risk
Figure 2 illustrates the linear and spline regression curves describing the logarithm of ACM and CVD risk against the higher weekly PA in terms of MET-h in patients with diabetes. The linear regression model had high goodness of fit for the risk of ACM (adjusted R2 = 0.44, P = 0.001) and CVD (adjusted R2 = 0.51, P = 0.001), with the result that a 1 MET-h/day incrementally higher PA was associated with 9.5% (95% CI, 5.0–13.8%) and 7.9 (4.3–11.4) reductions in ACM and CVD risk, respectively. Spline regression curves also indicated high goodness of fit for the risk of ACM (adjusted R2 = 0.60, P = 0.003) and CVD (adjusted R2 = 0.57, P = 0.01). The spline curve showed the tendency of an accelerated risk reduction for ACM and attenuated risk reduction for CVD with a high PA dose. However, the goodness of fit was not significantly different between linear and spline models (P = 0.14 for ACM risk; P = 0.60 for CVD risk). For consideration of the influence of the PA type, we additionally conducted multivariate linear and spline regression where both the higher PA dose and the PA type (i.e., total PA, LTPA, or walking) were entered as independent variables. However, results after adjustment for the PA type were unchanged (data not shown).
Figure 2.

Relationship between higher weekly PA and the logarithm (log RR) of ACM and CVD risk in patients with diabetes. Solid line indicates a log-linear relationship. Dashed line and the area surrounded by the dotted line indicate the cubic spline regression curve and its accompanying 95% confidence region, respectively. Size of each data point is proportional to its statistical weight.
CONCLUSIONS
According to the report of the International Association for the Study of Obesity (34), the PA level that was defined as the ratio of average daily metabolic rate to resting metabolic rate ranged from 1.5–1.6 for men and 1.4–1.5 for women in sedentary groups. Additionally, in general, the minimum PA volume for avoiding a sedentary lifestyle was indicated to be 30 min of daily activity at 3 METs of intensity (34). In the studies in the current meta-analysis, the mean PA dose in the lowest group was at most 30 MET-h/day in terms of EE (i.e., 1.25 [= 30/24] in the PA level unit) or 30 min/day of LTPA. Therefore, these PA levels can be considered to represent inactivity. The results of the current meta-analysis can be interpreted to indicate that a high PA in patients with diabetes was associated with a 40 and 29% lower risk of ACM and CVD, respectively, in comparison with inactivity, although definitions of high PA varied among studies. In comparison with other lifestyle factors, these values corresponded to the CVD risk reduction for daily light-to-moderate alcohol consumption compared with rarely or never drinking in diabetic patients (35). In other words, an inactive lifestyle is interpreted to have a 1.64-fold (= 1.0/0.61) and 1.40-fold (= 1.0/0.71) risk of ACM and CVD, respectively, compared with an active lifestyle. These risk values are comparable to those for smoking in comparison with no-smoking in diabetic patients (ACM risk, 1.6 [22]; CHD risk, 1.8 [36]).
Although observational studies are generally subject to high risk of bias that correlates with low strength of evidence, the strength of evidence for PA benefit in prevention of ACM and CVD can be increased to moderate according to the Evidence-based Practice Center approach (37) for the following two reasons: 1) presence of a dose-response pattern between PA dose and lower risk of ACM or CVD risk and 2) absence of plausible confounders, in particular, the main classic CVD risk factors, which can decrease the observed effect as indicated in the several stratified analyses (Tables 1 and 2). The major concern in judging the strength of evidence is a statistically suspected publication bias for the lower ACM risk associated with high PA, which may change the strength of the association.
As previously described, the results of this meta-analysis suggested that the lower risk of ACM or CVD associated with daily PA was not only qualitative but was dependent on the PA dose, which was, in most part, explained by log-linearity. The Physical Activity Guidelines for Americans from the U.S. Department of Health and Human Services recommended 150 min/week of moderate intensity PA to achieve a total of 8.3 MET-h/week of EE as the minimum PA level required for substantial health enhancement (medium PA) and 150 min/week of vigorous PA or 300 min/week of moderate PA to achieve a total of 16.7 MET-h/week of EE as the minimum PA level required for additional health benefit (high PA) (38). The medium/high PA level was estimated to lower the risk of ACM by 11.2%/21.2% and CVD by 9.3%/17.9%. The strength of the association between the increase in PA and the lowered risk in patients with diabetes was comparable to that in the general population in both ACM (14%/26%) (39) and CVD (14%/20%) (14).
It may be difficult for most working people to find much time to engage in PA. Moreover, diabetic patients often have various barriers to exercise, which inevitably restrict the total amount of habitual PA (40). Therefore, most people will want to know the minimum level below which PA has no benefit or above which PA has no additional benefit. However, the spline curve indicating the relationship between PA dose and lower risk of ACM and CVD risk neither detected these levels nor had significant improvement in goodness of fit compared with linearity. Current results suggested that any amount of habitual PA was better than none, although PA cannot be too great from the viewpoint of cardiovascular benefit and longevity in people with diabetes.
Several limitations should be addressed. First, we combined LTPA and total PA in the dose-response relationship between PA and ACM or CVD risk because too few studies analyzed them separately. However, after adjustment for the PA type, the result of regression analysis was unchanged. Nevertheless, the estimated PA might not reflect true PA because different studies used different questionnaires, and different studies quantified different spectra of PA even within each PA type. Second, the current meta-analysis based on observational studies could not principally prove causation nor avoid the possibility of residual confounding for the observed association. Third, the current stratified and meta-regression analyses based on stratification generally had insufficient statistical power to detect a significant interaction because of the limited number of included studies. Fourth, publication bias toward the overestimation of the risk reduction was suspected in ACM. We had difficulty in controlling the bias, considering that the belief in PA-related benefits is so strong that researchers possibly hesitated to report negative data. Lastly, it should be noted that there were no eligible data on ACM or CVD risk in relation to PA for Asian diabetic populations, an issue that should be investigated in the future. Therefore, we could not stratify the analysis into Asian/non-Asian populations, although alternatively data were stratified according to country (U.S./non-U.S.).
Despite these limitations, our study has strength in that it is the first to estimate quantitatively the magnitude of risk reduction in ACM and CVD that could be expected by habitual PA in patients with diabetes and, in particular, to clarify the dose-response association. In conclusion, results of the current meta-analysis suggested that more PA was associated with a larger reduction in future ACM and CVD risk in patients with diabetes. Nevertheless, any amount of habitual PA was better than inactivity.
Supplementary Material
Acknowledgments
H.So. and S.K. are recipients of a Grant-in-Aid for Scientific Research (No. 20300227) and Postdoctoral Research Fellowship (No. 202965), respectively, both from the Japan Society for the Promotion of Science, Japan Cardiovascular Research Foundation, and Ministry of Health Labor and Welfare, Japan. The sponsors had no influence over the design and conduct of the study; collection, management, analysis, and interpretation of the data; or preparation, review, or approval of the manuscript.
No potential conflicts of interest relevant to this article were reported.
All study members contributed substantially to the following roles: 1) conception and design of the study or acquisition of data, or analysis and interpretation of data; 2) drafting the manuscript or reviewing it; and 3) providing final approval of the version to be published. In addition, all the authors certify that they have participated sufficiently in the work to believe in its overall validity and to take public responsibility for appropriate portions of its context. S.K. played a leading role in conception and designing of the study, all processes of the study methods, and drafting all sections of the manuscript. S.T. and Y.O. designed the study’s analytic strategy and provided technical support in carrying out the statistical analyses. Y.H., K.F., and C.H. selected studies that met the inclusion criteria and acquired the full paper of studies that should be left for further review. H.Sh., K.S., and N.Y. gave various opinions in their interpretions of the study results and helped draft the manuscript. H.So. made the study supervision and revised the draft critically for important intellectual content.
Parts of this study were presented at the 72nd Scientific Sessions of the American Diabetes Association, Philadelphia, Pennsylvania, 8–12 June 2012.
The authors thank Satomi Fukuya (University of Tsukuba) for her excellent secretarial work.
Footnotes
This article contains Supplementary Data online at http://care.diabetesjournals.org/lookup/suppl/doi:10.2337/dc12-0783/-/DC1.
References
- 1.Gregg EW, Cheng YJ, Saydah S, et al. Trends in death rates among U.S. adults with and without diabetes between 1997 and 2006: findings from the National Health Interview Survey. Diabetes Care 2012;35:1252–1257 [DOI] [PMC free article] [PubMed] [Google Scholar]
- 2.American Diabetes Association Standards of medical care in diabetes—2011. Diabetes Care 2011;34(Suppl. 1):S11–S61 [DOI] [PMC free article] [PubMed] [Google Scholar]
- 3.Shinji S, Shigeru M, Ryusei U, Mitsuru M, Shigehiro K. Adherence to a home-based exercise program and incidence of cardiovascular disease in type 2 diabetes patients. Int J Sports Med 2007;28:877–879 [DOI] [PubMed] [Google Scholar]
- 4.Sone H, Tanaka S, Iimuro S, et al. Japan Diabetes Complications Study Group Long-term lifestyle intervention lowers the incidence of stroke in Japanese patients with type 2 diabetes: a nationwide multicentre randomised controlled trial (the Japan Diabetes Complications Study). Diabetologia 2010;53:419–428 [DOI] [PMC free article] [PubMed] [Google Scholar]
- 5.Praet SF, van Rooij ES, Wijtvliet A, et al. Brisk walking compared with an individualised medical fitness programme for patients with type 2 diabetes: a randomised controlled trial. Diabetologia 2008;51:736–746 [DOI] [PMC free article] [PubMed] [Google Scholar]
- 6.Zhang J, Yu KF. What’s the relative risk? A method of correcting the odds ratio in cohort studies of common outcomes. JAMA 1998;280:1690–1691 [DOI] [PubMed] [Google Scholar]
- 7.Powell KE, Thompson PD, Caspersen CJ, Kendrick JS. Physical activity and the incidence of coronary heart disease. Annu Rev Public Health 1987;8:253–287 [DOI] [PubMed] [Google Scholar]
- 8.Higgins JP, Thompson SG. Quantifying heterogeneity in a meta-analysis. Stat Med 2002;21:1539–1558 [DOI] [PubMed] [Google Scholar]
- 9.DerSimonian R, Laird N. Meta-analysis in clinical trials. Control Clin Trials 1986;7:177–188 [DOI] [PubMed] [Google Scholar]
- 10.Van Itallie TB. Health implications of overweight and obesity in the United States. Ann Intern Med 1985;103:983–988 [DOI] [PubMed] [Google Scholar]
- 11.Begg CB, Mazumdar M. Operating characteristics of a rank correlation test for publication bias. Biometrics 1994;50:1088–1101 [PubMed] [Google Scholar]
- 12.Egger M, Davey Smith G, Schneider M, Minder C. Bias in meta-analysis detected by a simple, graphical test. BMJ 1997;315:629–634 [DOI] [PMC free article] [PubMed] [Google Scholar]
- 13.Duval S, Tweedie R. Trim and fill: a simple funnel-plot-based method of testing and adjusting for publication bias in meta-analysis. Biometrics 2000;56:455–463 [DOI] [PubMed] [Google Scholar]
- 14.Sattelmair J, Pertman J, Ding EL, Kohl HW, 3rd, Haskell W, Lee IM. Dose response between physical activity and risk of coronary heart disease: a meta-analysis. Circulation 2011;124:789–795 [DOI] [PMC free article] [PubMed] [Google Scholar]
- 15.Moy CS, Songer TJ, LaPorte RE, et al. Insulin-dependent diabetes mellitus, physical activity, and death. Am J Epidemiol 1993;137:74–81 [DOI] [PubMed] [Google Scholar]
- 16.Trichopoulou A, Psaltopoulou T, Orfanos P, Trichopoulos D. Diet and physical activity in relation to overall mortality amongst adult diabetics in a general population cohort. J Intern Med 2006;259:583–591 [DOI] [PubMed] [Google Scholar]
- 17.Ainsworth BE, Haskell WL, Herrmann SD, et al. 2011 Compendium of Physical Activities: a second update of codes and MET values. Med Sci Sports Exerc 2011;43:1575–1581 [DOI] [PubMed] [Google Scholar]
- 18.Sterne JA, Gavaghan D, Egger M. Publication and related bias in meta-analysis: power of statistical tests and prevalence in the literature. J Clin Epidemiol 2000;53:1119–1129 [DOI] [PubMed] [Google Scholar]
- 19.Gaziano TA, Bubes V, Gaziano JM Exercise and mortality among diabetics in the Physicians’ Health Study enrolment cohort. Cardiovasc J S Afr 2005;16(Suppl.):1216292404 [Google Scholar]
- 20.Cipollini F, Gussoni G, Pacifici R, et al. The influence of physical activity performed at 20-40 years of age on cardiovascular outcomes in medical patients aged 65-75. Ital J Med 2011;5:114–119 [Google Scholar]
- 21.de Fine Olivarius N, Siersma V, Nielsen AB, Hansen LJ, Rosenvinge L, Mogensen CE. Predictors of mortality of patients newly diagnosed with clinical type 2 diabetes: a 5-year follow up study. BMC Endocr Disord 2010;10:14. [DOI] [PMC free article] [PubMed] [Google Scholar]
- 22.Ford ES, DeStefano F. Risk factors for mortality from all causes and from coronary heart disease among persons with diabetes. Findings from the National Health and Nutrition Examination Survey I Epidemiologic Follow-up Study. Am J Epidemiol 1991;133:1220–1230 [DOI] [PubMed] [Google Scholar]
- 23.Gregg EW, Gerzoff RB, Caspersen CJ, Williamson DF, Narayan KM. Relationship of walking to mortality among US adults with diabetes. Arch Intern Med 2003;163:1440–1447 [DOI] [PubMed] [Google Scholar]
- 24.Hu FB, Stampfer MJ, Solomon C, et al. Physical activity and risk for cardiovascular events in diabetic women. Ann Intern Med 2001;134:96–105 [DOI] [PubMed] [Google Scholar]
- 25.Hu G, Eriksson J, Barengo NC, et al. Occupational, commuting, and leisure-time physical activity in relation to total and cardiovascular mortality among Finnish subjects with type 2 diabetes. Circulation 2004;110:666–673 [DOI] [PubMed] [Google Scholar]
- 26.Hu G, Jousilahti P, Barengo NC, Qiao Q, Lakka TA, Tuomilehto J. Physical activity, cardiovascular risk factors, and mortality among Finnish adults with diabetes. Diabetes Care 2005;28:799–805 [DOI] [PubMed] [Google Scholar]
- 27.Li R, O’Sullivan MJ, Robinson J, Safford MM, Curb D, Johnson KC. Family history of myocardial infarction predicts incident coronary heart disease in postmenopausal women with diabetes: the Women’s Health Initiative Observational Study. Diabetes Metab Res Rev 2009;25:725–732 [DOI] [PMC free article] [PubMed] [Google Scholar]
- 28.Nöthlings U, Ford ES, Kröger J, Boeing H. Lifestyle factors and mortality among adults with diabetes: findings from the European Prospective Investigation into Cancer and Nutrition-Potsdam study*. J Diabetes 2010;2:112–117 [DOI] [PubMed] [Google Scholar]
- 29.Smith TC, Wingard DL, Smith B, Kritz-Silverstein D, Barrett-Connor E. Walking decreased risk of cardiovascular disease mortality in older adults with diabetes. J Clin Epidemiol 2007;60:309–317 [DOI] [PMC free article] [PubMed] [Google Scholar]
- 30.Spencer EA, Pirie KL, Stevens RJ, et al. Million Women Study Collaborators Diabetes and modifiable risk factors for cardiovascular disease: the prospective Million Women Study. Eur J Epidemiol 2008;23:793–799 [DOI] [PubMed] [Google Scholar]
- 31.Tanasescu M, Leitzmann MF, Rimm EB, Hu FB. Physical activity in relation to cardiovascular disease and total mortality among men with type 2 diabetes. Circulation 2003;107:2435–2439 [DOI] [PubMed] [Google Scholar]
- 32.Vepsäläinen T, Soinio M, Marniemi J, et al. Physical activity, high-sensitivity C-reactive protein, and total and cardiovascular disease mortality in type 2 diabetes. Diabetes Care 2011;34:1492–1496 [DOI] [PMC free article] [PubMed] [Google Scholar]
- 33.Wei M, Gibbons LW, Kampert JB, Nichaman MZ, Blair SN. Low cardiorespiratory fitness and physical inactivity as predictors of mortality in men with type 2 diabetes. Ann Intern Med 2000;132:605–611 [DOI] [PubMed] [Google Scholar]
- 34.Saris WH, Blair SN, van Baak MA, et al. How much physical activity is enough to prevent unhealthy weight gain? Outcome of the IASO 1st Stock Conference and consensus statement. Obes Rev 2003;4:101–114 [DOI] [PubMed] [Google Scholar]
- 35.Ajani UA, Gaziano JM, Lotufo PA, et al. Alcohol consumption and risk of coronary heart disease by diabetes status. Circulation 2000;102:500–505 [DOI] [PubMed] [Google Scholar]
- 36.DeStefano F, Ford ES, Newman J, et al. Risk factors for coronary heart disease mortality among persons with diabetes. Ann Epidemiol 1993;3:27–34 [DOI] [PubMed] [Google Scholar]
- 37.Owens DK, Lohr KN, Atkins D, et al. AHRQ series paper 5: grading the strength of a body of evidence when comparing medical interventions—Agency for Healthcare Research and Quality and the Effective Health-Care Program. J Clin Epidemiol 2010;63:513–523 [DOI] [PubMed] [Google Scholar]
- 38.U.S. Department of Health and Human Services. 2008 Physical Activity Guidelines for Americans Washington, DC, 2008 (Office of Disease Prevention and Health Promotion Publication No. U0036) [Google Scholar]
- 39.Samitz G, Egger M, Zwahlen M. Domains of physical activity and all-cause mortality: systematic review and dose-response meta-analysis of cohort studies. Int J Epidemiol 2011;40:1382–1400 [DOI] [PubMed] [Google Scholar]
- 40.Korkiakangas EE, Alahuhta MA, Laitinen JH. Barriers to regular exercise among adults at high risk or diagnosed with type 2 diabetes: a systematic review. Health Promot Int 2009;24:416–427 [DOI] [PubMed] [Google Scholar]
Associated Data
This section collects any data citations, data availability statements, or supplementary materials included in this article.