

Abstract
OBJECTIVE
Association between white blood cell (WBC) count and diabetes risk has been recently suggested. We assessed whether WBC count is an independent risk factor for diabetes incidence among young healthy adults.
RESEARCH DESIGN AND METHODS
WBC count was measured in 24,897 young (mean age 30.8 ± 5.36 years), normoglycemic men with WBC range of 3,000 to 12,000 cells/mm3. Participants were periodically screened for diabetes during a mean follow-up of 7.5 years.
RESULTS
During 185,354 person-years of follow-up, diabetes was diagnosed in 447 subjects. A multivariate model adjusted for age, BMI, family history of diabetes, physical activity, and fasting glucose and triglyceride levels revealed a 7.6% increase in incident diabetes for every increment of 1,000 cells/mm3 (P = 0.046). When grouped in quintiles, a baseline WBC count above 6,900 cells/mm3 had an independent 52% increase in diabetes risk (hazard ratio 1.52 [95% CI 1.06–2.18]) compared with the lowest quintile (WBC <5,400 cells/mm3). Men at the lowest WBC quintile were protected from diabetes incidence even in the presence of overweight, family history of diabetes, or elevated triglyceride levels. After simultaneous control for risk factors, BMI was the primary contributor of the variation in multivariate models (P < 0.001), followed by age and WBC count (P < 0.001), and family history of diabetes and triglyceride levels (P = 0.12).
CONCLUSIONS
WBC count, a commonly used and widely available test, is an independent risk factor for diabetes in young men at values well within the normal range.
Obesity and type 2 diabetes are leading causes of morbidity and mortality, and their prevalence is increasingly rising in the younger population (1). There is solid evidence to support low-grade inflammation as a key component in the pathophysiology of the metabolic syndrome and type 2 diabetes, linking adiposity and insulin resistance (2). Inflammatory cells have been shown to infiltrate the adipose tissue in obese humans, associated with increased production and secretion of inflammatory cytokines that may contribute to whole-body inflammation (3,4). Chronic inflammation has been associated with an increased incidence of diabetes even in the absence of obesity (5,6), such as in patients with rheumatoid arthritis and psoriasis, and treatment with anti-inflammatory medications in these conditions significantly decreased the rates of diabetes (7).
Several epidemiological studies (8–11), but not all (12,13), have shown links between various markers of inflammation and diabetes risk prediction, including interleukin-6 (IL-6) and C-reactive protein (CRP). Total peripheral white blood cells (WBC) count, a nonspecific marker of inflammation, has also been suggested to be associated with diabetes risk in some cohorts (14–16), but observations were not consistent (10,17). A recent meta-analysis of 20 studies including ∼90,000 participants demonstrated a positive correlation between increased WBC level and diabetes risk (18). However, most studies in this meta-analysis enrolled middle-aged participants and were based on cross-sectional data, with only partial adjustments for other diabetes risk factors. In addition, whether elevated inflammatory markers can predict the risk for diabetes independent of adiposity is not yet clear. Although a few studies showed significant associations between CRP and incident diabetes after adjustment for obesity indexes (8,9,19–21) others have argued that the association is mediated entirely by increased adiposity (11,13,17).
The aim of our study was to assess whether an increased WBC count within the normal range can predict diabetes incidence in young adults. Using the Metabolic, Life-style and Nutrition Assessment in Young adult (MELANY) cohort, a large prospective, population-based cohort, we report that an elevated WBC count in young, apparently healthy, normoglycemic men, already at levels well within the normal range, is an independent predictor of future diabetes. In addition, men with known risk factors for obesity, but with low-normal WBC count, were relatively protected from type 2 diabetes.
RESEARCH DESIGN AND METHODS
Study population
The MELANY cohort has been conducted at the Israel Defense Forces Staff Periodic Examination Center (SPEC), to which all career service personnel aged older than 25 years are referred every 3 to 5 years for a routine health examination and screening tests, as described previously (22,23). At each visit to the SPEC, participants completed a detailed questionnaire assessing demographic, nutritional, lifestyle, and medical factors. Blood samples were drawn after a 14-h fast and immediately analyzed. Height and weight were measured, and a physician at the center performed a complete physical examination. Primary care for all Israel Defense Forces personnel between scheduled visits to the center is obtained at designated military clinics, and all medical information is recorded in the same central database, thereby facilitating ongoing, tight, and uniform follow-up.
This study assessed 37,418 men who had documented WBC counts within the normal range (3,000–12,000 cells/mm3) at their first visit to the SPEC between the years 1995 and 2010. The analysis excluded 1) men with pre-existing type 1 or type 2 diabetes, men with fasting plasma glucose (FPG) level ≥100 mg/dL at the first visit (n = 3,638), or men withnewly diagnosed diabetes (FPG ≥126 mg/dL, n = 602); 2) men with a follow-up shorter than 2 years (n = 8,001); or 3) men missing fasting glucose levels or WBC count (n = 280). The institutional review board of the Israel Defense Forces Medical Corps approved this study on the basis of strict maintenance of participants’ anonymity during database analyses.
Follow-up and outcome
Participants aged 25 to 45 years were followed up prospectively from their first visit to the SPEC until retirement from military service. Follow-up ended at the time of diabetes diagnosis, death, retirement from military service, or 8 March 2011, whichever came first. Mean total follow-up was 7.71 ± 3.83 years, corresponding to ∼85 and 67% completing at least 3 and 5 years of follow-up, respectively. All participants were censored at the end of their follow-up period (based on the above criteria for end of follow-up); thus, none of the study participants were lost to follow-up. Of note, follow-up duration for subjects who did and did not develop diabetes was similar (7.72 ± 2.84 and 7.44 ± 3.84 years, respectively, P = 0.13), and baseline WBC levels did not affect the number of visits to the SPEC.
Screening for diabetes was performed at each visit to the SPEC using FPG. The diagnosis of 447 incident cases of diabetes was based on the American Diabetes Association criteria by documenting two FPG levels of ≥126 mg/dL (7.0 mmol/L) or a glucose level ≥126 mg/dL 2 h after ingestion of 75 g of glucose. The diagnosis was made after the abnormal screening result at each visit to the SPEC in 198 subjects (44.3%) or between visits by the participants’ Israeli Defense Force primary care physician, followed by confirmation by a military physicians’ committee, in 249 (55.7%). All laboratory studies were performed on fresh samples in an International Organization for Standardization (ISO)-9002 quality-assured core facility laboratory.
Statistical analysis
The cohort was divided into WBC quintiles, and their baseline characteristics are presented in Table 1. (Baseline characteristics of patients who developed diabetes vs. those who did not are detailed in Supplementary Table 1.) The medians of the quintiles were fit as continuous variables to estimate the trend of variables across quintiles in a linear regression model (adjusted R2 = 0.99, B = 900 cells/mm3 per quintile, P = 0.001). Cox proportional hazard models were used to estimate the hazard ratios (HR) and 95% CIs for developing diabetes. We gradually added to the age-adjusted model (model 1) additional parameters known as classical risk factors for diabetes (Table 2). In model 2, BMI was added as a continuous variable. In model 3, the following categorical variables were added to model 2: smoking status (current smoker, former smoker, never smoked), family history of diabetes (yes or no), and physical activity (not active, <150 min/week, ≥150 min/week). In model 4, serum triglyceride levels (quintiles) and fasting glucose level (as continuous variables) were added to the model. An additional multivariate model was conducted analyzing WBC count as a continuous variable. Of note, the presence or absence of a family history of diabetes was recorded for each participant from the last available visit to the examination center.
Table 1.
Baseline characteristics of population cohort
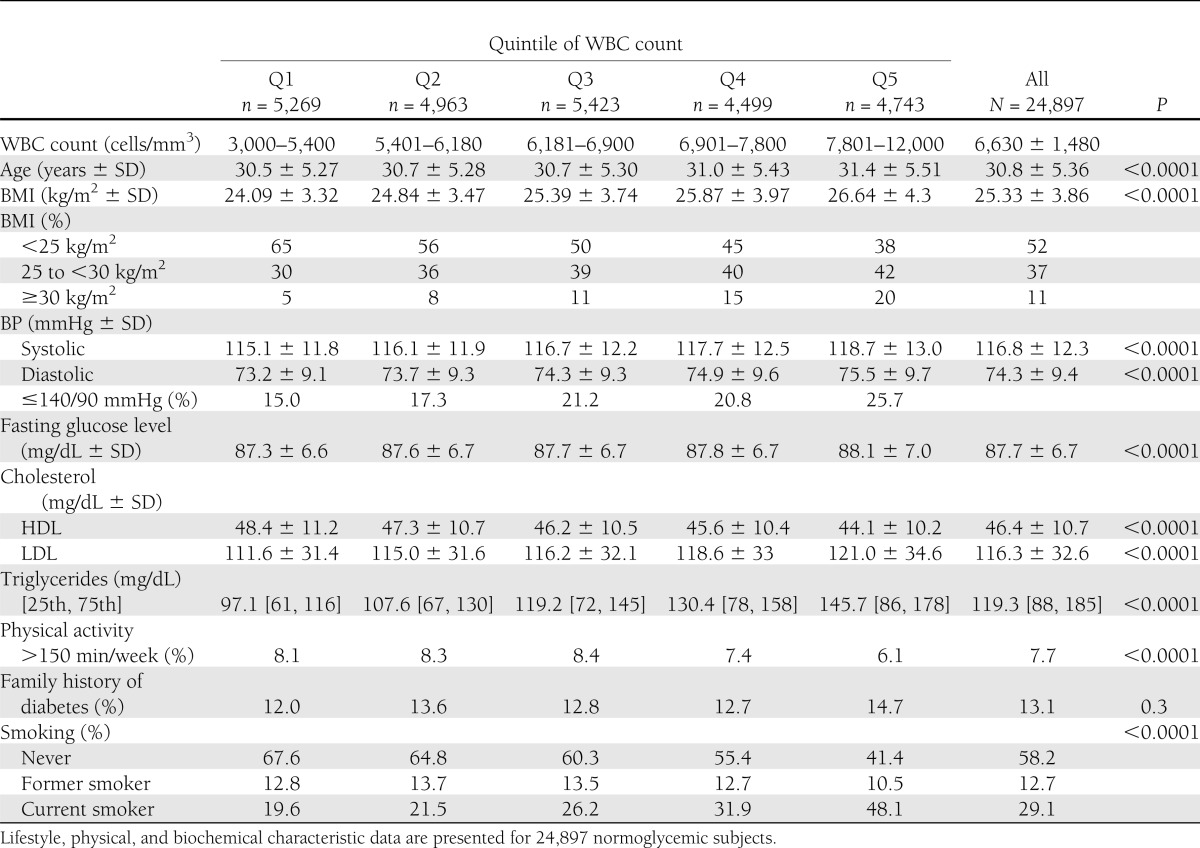
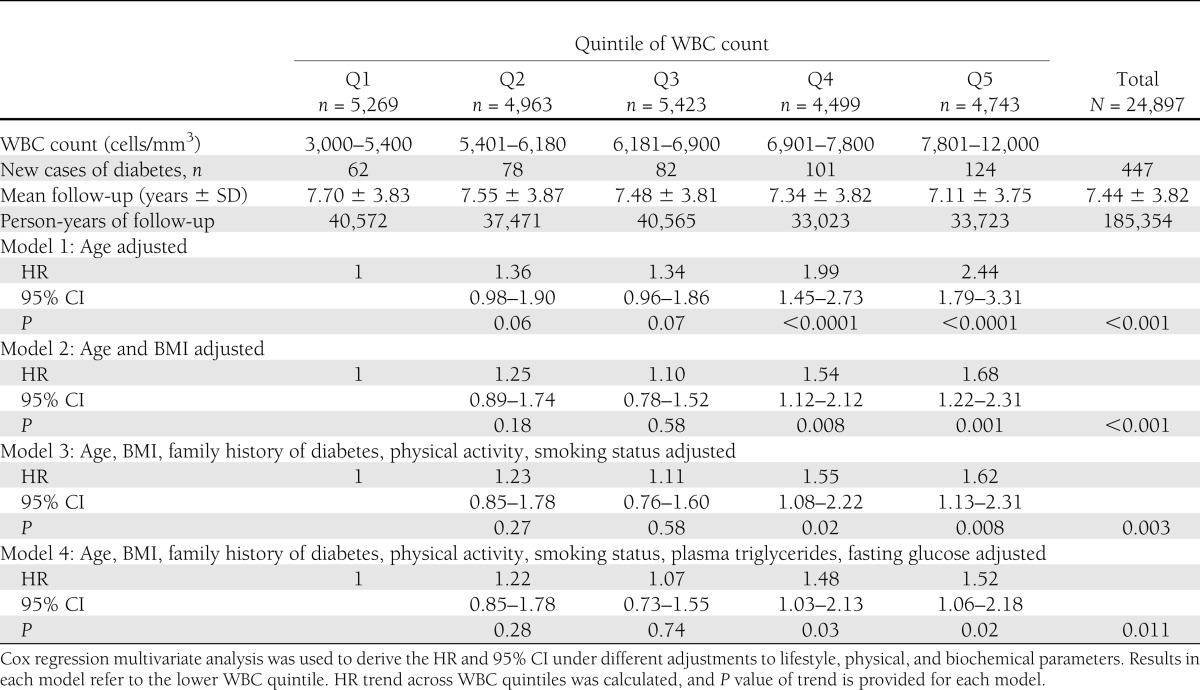
Table 2.
HR for developing diabetes in normoglycemic patients across WBC quintiles
Log-minus-log plots for each variable were inspected to verify the assumption of proportionality of the hazards. All variables used in the model were tested for colinearity using the Pearson correlation. The maximal R recorded was 0.357 (triglyceride and BMI). Omnibus tests of model coefficients were used to assess the relative contribution of the various variables to the model. To evaluate the power of the models to discriminate events from nonevents we calculated the area under the receiver operating characteristic (ROC) curve for each of the variables as well as in a multivariate model (C statistic). To study potential threshold in WBC count for diabetes prediction, a restricted cubic spline (using R software) and a decision tree procedure with CHAID (χ2 Automatic Interaction Detection) method were used. Values are reported as mean ± standard deviation (SD), unless mentioned otherwise. Statistical analyses were performed with SPSS 19.0 software.
RESULTS
Characteristics of study participants
Data of 24,897 apparently healthy young normoglycemic men who were followed up as part of the MELANY cohort met the inclusion criteria. Participants were categorized by quintiles according to their WBC count at enrollment. Baseline characteristics are presented in Table 1. Mean WBC count was 6,620 ± 1,480 cells/mm3 (range 3,000–12,000) with an average increment of 900 cells/mm3 between consequent quintiles. WBC level was directly correlated with BMI, systolic and diastolic blood pressure, triglyceride level, LDL-cholesterol, and rates of current smokers. Physical activity and HDL cholesterol were inversely correlated with WBC level (P < 0.0001 for trend).
WBC count and risk for developing diabetes
During 185,354 person-years of follow-up, 447 new cases of diabetes were diagnosed among young normoglycemic men. The incidence of type 2 diabetes increased linearly across quintiles of WBC, with 62 new cases diagnosed in the lowest quintile (Q1; WBC of 3,000–5,400 cells/mm3) and 124 new cases diagnosed in Q5 (WBC >7,810). In model 1, adjusted for age, the risk for type 2 diabetes was 2-fold higher in Q4 (WBC 6,910–7,800 cells/mm3) and 2.44-fold higher in Q5 compared with Q1 (HR 2.44 [95% CI 1.79–3.31]). Further adjustment for BMI (model 2, Table 2) significantly attenuated the risk for diabetes associated with WBC levels. Nevertheless, even in the multivariate model adjusted for age, BMI, family history of diabetes, physical activity, triglyceride level, and fasting glucose, WBC count remained an independent risk factor of incident diabetes at levels >6,910 cells/mm3 (model 4, Table 2), with a HR in Q4 versus Q1 of 1.48 (1.03–2.14; P = 0.011 for trend). When WBC count was modeled as a continuous variable, an increment of 1,000 cells/mm3 in WBC count was associated with a 7.6% increase in the risk for developing diabetes independently of age, BMI, family history of diabetes, physical activity, triglyceride level, and fasting glucose level (HR 1.076 [1.001–1.157], P = 0.046).
Risk prediction of diabetes in young adults using WBC count
To better assess the interrelation between obesity and WBC, we next studied the joint effect of BMI and WBC levels in predicting the risk for developing type 2 diabetes (Fig. 1A). In a multivariate analysis controlled for age, family history of diabetes, physical activity, triglyceride level, and FPG, obese men (BMI ≥30 kg/m2) with elevated WBC count within the normal range (7,810–12,000 cells/mm3) had a more than sixfold increase in the risk for type 2 diabetes (HR 6.1 [95% CI 3.81–9.78]) compared with the reference group. Of interest, a strong attenuation in the risk for type 2 diabetes attributed to overweight and obesity was observed among individuals with low-normal WBC (<5,400 cells/mm3), reaching an HR of 2.63 (1.19–5.88) for obese men and a nonsignificant HR of 1.40 (0.8–2.44) for overweight men. Taken together, these observations suggest that, in the presence of a low-normal WBC count, overweight and obese men are relatively protected from the development of type 2 diabetes compared with overweight or obese individuals with higher WBC count.
Figure 1.

Risk factor for diabetes and WBC count in young normoglycemic patients. Q1 to Q5 indicate increment WBC quintiles as they appear in Table 1. The dark bars indicate a significant change compared with the reference group. A: Joint effect of BMI and WBC count and the risk for incident diabetes. Data are adjusted for age, family history of diabetes, activity status, smoking status, blood pressure, triglycerides level, and fasting glucose. The reference group is in the lower WBC quintile at the lower (lean) BMI tertile. B: Joint effect of plasma triglycerides (TG) level and WBC count and the risk for diabetes. Data are adjusted for age, BMI, family history of diabetes, activity status, smoking status, and fasting glucose. Reference group is the lower WBC quintile at a normal (<150 mg/dL) TG level. C: Joint effect of family history of diabetes, WBC count, and the risk for diabetes. Data are adjusted for age, BMI of diabetes, activity status, smoking status, triglycerides level, and fasting glucose. Reference group is the lower WBC quintile without a family history of diabetes.
Figure 1 demonstrates the joint effects of triglycerides level (Fig. 1B) or family history of diabetes (Fig. 1C) with WBC count. Similar to the observation with BMI, a relatively low WBC level (<5,400 cells/mm3) was associated with complete attenuation of diabetes risk attributed to an elevated triglyceride level or to a positive family history of diabetes.
We next assessed for a potential threshold within the normal range of the WBC count, above which diabetes risk increases significantly. Although a decision tree procedure (with CHAID) suggested a WBC value of 7,230 cells/mm3 as a potential cut point, no evidence for a nonlinear component of WBC was observed using restricted cubic splines (data not shown). We therefore performed the Cox regression multivariate models using a moving cutoff value for WBC in increments as low as 100 cells/mm3 (Supplementary Table 4). A clear threshold could not be delineated; however, the highest HR (1.438) with the lowest P value (0.002) for diabetes incidence was observed when the value of 7,100 cells/mm3 was used. Of note, WBC >7,100 cells/mm3 corresponds exactly to levels observed among the upper one-third of the study population.
Residual contribution of WBC to diabetes prediction
To assess the differential contribution of the various risk factors to the prediction of diabetes, we next calculated the ROC curves for WBC count and for other, well-validated diabetes risk factors. Surprisingly, the AUC of the WBC count ROC curve was not statistically different than that of fasting glucose (0.59 [95% CI 0.55–0.61] vs. 0.58 [0.55–0.61], respectively). BMI was the single most powerful predictor for diabetes (AUC 0.670 [0.643–0.696]), followed by triglyceride level (0.63 [0.60–0.66]), WBC count, and fasting glucose. The addition of all parameters included in model 4 resulted in an AUC of 0.674 (0.643–0.705) without WBC and 0.676 (0.645–0.707) with WBC. The change in −2 log likelihood with addition of each of the variables to the Cox regression model (omnibus test of model coefficients) revealed that BMI and age had the highest contribution to the model, followed by WBC count, family history of diabetes, and triglyceride level (Supplementary Table 2). As detailed above, the upper one-third of the WBC distribution (corresponding to WBC levels >7,100 cells/mm3) was suggested as a potential threshold for increased diabetes risk. Indeed, a significant contribution to the full multivariate model was observed when tertiles of WBC (<5,900, 5,910–7,100, or ≥7,110 cells/mm3) were used (P= 0.004 omnibus test).
Ethnic variations in WBC count
Of the 24,897 subjects included in this study, 7,939 were of African origin, exhibiting a lower mean of WBC count (5,510 ± 1,440 cells/mm3, P < 0.001) than participants from non-African descent. When WBC count was modeled as a continuous variable, a significant 11.8% increase in diabetes risk was observed for every increment of 1,000 cells/mm3 in this population (HR 1.118 [95%CI 1.01–1.25], P = 0.05). These data indicate that WBC count may be considered as a risk factor even among subjects with a genetic tendency for a lower range of WBC count (further detailed in Supplementary Table 3).
CONCLUSIONS
In this prospective, large-scale study, we demonstrate that a single measurement of WBC in healthy, normoglycemic young men may predict diabetes incidence independently from the other traditional risk factors for diabetes such as BMI, fasting glucose and triglyceride levels, and family history. We report that for every increase in 1,000 cells/mm3 within the normal range of the WBC count, the risk for diabetes increases by 7.6%, and levels of WBC already as low as 6,900 cells/mm3 and above are associated with an obesity-independent ∼50% increase in the risk for diabetes. In addition, overweight and obese subjects with a relatively low WBC count seem to have a significantly lower risk for diabetes than those with higher levels of leukocytes, which may help in better characterizing obese individuals who are relatively protected from the metabolic derangements frequently associated with obesity.
Given the important role that has been suggested for chronic inflammation in obese states and its causal role in mediating insulin resistance in peripheral tissues (24), incorporating novel inflammatory markers into diabetes risk prediction models has recently raised interest (25–27). Assessment of the inflammatory burden associated with obesity may contribute to the interpretation of commonly used clinical measurements of adiposity, such as BMI, waist circumference, and hip-to-thigh ratio, in determining the inflammatory consequences of increased adiposity and the risk for diabetes. Indeed, many studies have demonstrated a positive association between increased levels of inflammatory markers, such as WBC count, CRP, and inflammatory cytokines, and diabetes incidence, although only a few have tested this prospectively in large, population-based studies (for a systematic review and meta-analysis, please see reference 18).
Previous studies have been inconsistent in whether WBC or other inflammatory markers contribute to diabetes prediction models independent of obesity (8,9,19–21) or whether these markers simply reflect adipose tissue mass (11,13,17,19). The current study, to the best of our knowledge, is the largest cohort to address the potential role of WBC as a common, widely available, and simple method to measure inflammatory biomarker for diabetes prediction in young adults. In the population studied, elevated WBC count was not associated with increased diabetes risk in lean, normoglycemic men, a subgroup at a very low risk for diabetes (total incidence of 0.90% for Q1 to 0.99% for Q5 during ∼7.5 years for individuals with BMI <25 kg/m2, Fig. 1A). However, WBC count was able to differentiate between subgroups of overweight and obese young men who are at a relatively low risk (or even without an excess risk) for diabetes and those who progressed to overt diabetes at significantly higher rates.
A potential explanation for the lack of predictive value of WBC count for diabetes incidence among men who are not overweight or obese men is that WBC count is a cumulative estimation of the whole-body inflammatory burden, which reflects chronic as well as acute inflammatory processes. Adipose tissue inflammation has mainly been attributed to inflammatory processes observed in visceral and/or ectopic fat depositions, compartments whose relative mass is highly increased in obesity (28). Therefore, young, healthy, lean men, who have less visceral and ectopic fat mass than obese subjects, will be less likely to exhibit significant adipose tissue inflammation (29). In this setting, and in the absence of other recognized chronic inflammatory processes, a relatively elevated WBC count may represent more acute, intercurrent processes that do not seem to be associated with a higher rate of diabetes incidence. Indeed, Klöting et al. (30) demonstrated that visceral but not subcutaneous adipose tissue mass is associated with insulin resistance independent of BMI. Their results, as well as others (31,32), emphasize that the body distribution of fat, rather than cumulative fat mass as denoted by BMI, is a principle determinant of inflammation. In addition, the results of the current study suggest that chronic, mild inflammation is an important and perhaps a necessary step in the progression of young adults to diabetes, because subjects with low WBC counts do not exhibit an excess risk for incident diabetes, even in the presence of excess weight, an elevated triglyceride level, or a positive family history of diabetes.
Several limitations of this study warrant consideration. First, the MELANY cohort may be considered representative of a unique group of healthy young men. However, the characteristics of the population are strikingly similar to those of cohorts in published studies of young men from various industrialized countries (33–35). In addition, the relatively homogeneous environment to which participants in our study were exposed might reduce the effect of unknown confounders. Second, measurements of waist circumference, circulating insulin, and C-peptide were not obtained in this study. Although this did not compromise the outcome definition, it limited our ability to assess the role of insulin resistance in the association between WBC count and diabetes. Finally, we did not measure glycosylated hemoglobin levels or perform glucose-tolerance tests.
The current definition of normal FPG levels resulted in a substantial increase in the overlap with normal glucose tolerance, as defined by glucose-tolerance testing (36); however, we may have missed men with normal FPG levels who were already glucose intolerant at enrollment. To limit this possibility, we confirmed our results by performing a secondary analysis in which a 2-year lag between enrollment and outcome was used. Another point worth discussing is the availably of only one WBC count value at baseline, which may not accurately represent the true inflammatory burden in the presence of acute illnesses or stresses. These potential false-positive results, however, could have only underestimated the association of WBC count with diabetes incidence.
The strengths of the MELANY study include the detailed, uniform, and systematic follow-up and outcome definition, the use of measured (rather than reported) values for the BMI, the availability of reliable determinations of glucose levels in fresh venous blood, and the direct measurements of lipids.
The identification of a high-normal WBC count, measured in an outpatient screening setting, as a risk factor for type 2 diabetes in addition to the other known risk factors may elaborate the interpretation of this commonly used laboratory test by primary care providers, increasing their attention to increased diabetes risk among young adults, who are usually not frequently screened for this condition. Identifying individuals at higher risk for diabetes may facilitate the consideration of preventive interventions. Indeed, lifestyle and pharmacological approaches have both been reported to be efficient in delaying the onset of diabetes in selected groups at high risk for the disease (37–40). Of specific interest is the observation that specific anti-inflammatory treatments for rheumatoid arthritis patients also resulted in a decreased incidence of diabetes (6). Targeting the obesity-related chronic inflammatory response to prevent the metabolic derangements associated with increased fat deposition may become an attractive approach for diabetes prevention once additional, more specific anti-inflammatory treatments with more tolerated side effects become available.
Supplementary Material
Acknowledgments
This study was supported by a grant from the Talpiot Medical Leadership Program, Chaim Sheba Medical Center, Tel-Hashomer, Israel (A.T. and G.T.), and by the Israel Defense Forces Medical Corps.
No potential conflicts of interest relevant to this article were reported.
G.T. contributed to the study concept and design, acquisition and interpretation of the data, research methods and statistical analyses, and drafting of the manuscript. A.A. contributed to study concept and design, interpretation of the data, and critical revision of the manuscript for important intellectual content. A.S. contributed to interpretation of the data and to critical revision of the manuscript for important intellectual content. E.D. contributed to acquisition and interpretation of the data, research methods and statistical analyses, and critical revision of the manuscript for important intellectual content. D.T. contributed to acquisition of the data and to research methods and statistical analyses. B.G. contributed to critical revision of the manuscript for important intellectual content. A.T. contributed to study concept and design, research methods and statistical analyses, interpretation of the data, and drafting of the manuscript. G.T. and A.T. are the guarantors of this work and, as such, had full access to all the data in the study and take responsibility for the integrity of the data and the accuracy of the data analysis.
The authors are grateful to Prof. Assaf Rudich from the Faculty of Health Sciences at Ben-Gurion University of the Negev, Beer-Sheva, Israel, for critical review of the manuscript.
Footnotes
This article contains Supplementary Data online at http://care.diabetesjournals.org/lookup/suppl/doi:10.2337/dc11-2298/-/DC1.
References
- 1.Lee JM. Why young adults hold the key to assessing the obesity epidemic in children. Arch Pediatr Adolesc Med 2008;162:682–687 [DOI] [PubMed] [Google Scholar]
- 2.Donath MY, Shoelson SE. Type 2 diabetes as an inflammatory disease. Nat Rev Immunol 2011;11:98–107 [DOI] [PubMed] [Google Scholar]
- 3.Blüher M, Bashan N, Shai I, et al. Activated Ask1-MKK4-p38MAPK/JNK stress signaling pathway in human omental fat tissue may link macrophage infiltration to whole-body insulin sensitivity. J Clin Endocrinol Metab 2009;94:2507–2515 [DOI] [PubMed] [Google Scholar]
- 4.Wellen KE, Hotamisligil GS. Obesity-induced inflammatory changes in adipose tissue. J Clin Invest 2003;112:1785–1788 [DOI] [PMC free article] [PubMed] [Google Scholar]
- 5.Han C, Robinson DW, Jr, Hackett MV, Paramore LC, Fraeman KH, Bala MV. Cardiovascular disease and risk factors in patients with rheumatoid arthritis, psoriatic arthritis, and ankylosing spondylitis. J Rheumatol 2006;33:2167–2172 [PubMed] [Google Scholar]
- 6.Solomon DH, Love TJ, Canning C, Schneeweiss S. Risk of diabetes among patients with rheumatoid arthritis, psoriatic arthritis and psoriasis. Ann Rheum Dis 2010;69:2114–2117 [DOI] [PMC free article] [PubMed] [Google Scholar]
- 7.Goldbach-Mansky R. Blocking interleukin-1 in rheumatic diseases. Ann N Y Acad Sci 2009;1182:111–123 [DOI] [PMC free article] [PubMed] [Google Scholar]
- 8.Barzilay JI, Abraham L, Heckbert SR, et al. The relation of markers of inflammation to the development of glucose disorders in the elderly: the Cardiovascular Health Study. Diabetes 2001;50:2384–2389 [DOI] [PubMed] [Google Scholar]
- 9.Dehghan A, Kardys I, de Maat MP, et al. Genetic variation, C-reactive protein levels, and incidence of diabetes. Diabetes 2007;56:872–878 [DOI] [PubMed] [Google Scholar]
- 10.Duncan BB, Schmidt MI, Pankow JS, et al. Atherosclerosis Risk in Communities Study Low-grade systemic inflammation and the development of type 2 diabetes: the Atherosclerosis Risk in Communities Study. Diabetes 2003;52:1799–1805 [DOI] [PubMed] [Google Scholar]
- 11.Festa A, D’Agostino R, Jr, Tracy RP, Haffner SM, Insulin Resistance Atherosclerosis Study Elevated levels of acute-phase proteins and plasminogen activator inhibitor-1 predict the development of type 2 diabetes: the insulin resistance atherosclerosis study. Diabetes 2002;51:1131–1137 [DOI] [PubMed] [Google Scholar]
- 12.Han TS, Sattar N, Williams K, Gonzalez-Villalpando C, Lean ME, Haffner SM. Prospective study of C-reactive protein in relation to the development of diabetes and metabolic syndrome in the Mexico City Diabetes Study. Diabetes Care 2002;25:2016–2021 [DOI] [PubMed] [Google Scholar]
- 13.Thorand B, Löwel H, Schneider A, et al. C-reactive protein as a predictor for incident diabetes mellitus among middle-aged men: results from the MONICA Augsburg cohort study, 1984-1998. Arch Intern Med 2003;163:93–99 [DOI] [PubMed] [Google Scholar]
- 14.Nakanishi S, Yamane K, Kamei N, Okubo M, Kohno N. Elevated C-reactive protein is a risk factor for the development of type 2 diabetes in Japanese Americans. Diabetes Care 2003;26:2754–2757 [DOI] [PubMed] [Google Scholar]
- 15.Schmidt MI, Duncan BB, Sharrett AR, et al. Markers of inflammation and prediction of diabetes mellitus in adults (Atherosclerosis Risk in Communities study): a cohort study. Lancet 1999;353:1649–1652 [DOI] [PubMed] [Google Scholar]
- 16.Vozarova B, Weyer C, Lindsay RS, Pratley RE, Bogardus C, Tataranni PA. High white blood cell count is associated with a worsening of insulin sensitivity and predicts the development of type 2 diabetes. Diabetes 2002;51:455–461 [DOI] [PubMed] [Google Scholar]
- 17.Chao C, Song Y, Cook N, et al. The lack of utility of circulating biomarkers of inflammation and endothelial dysfunction for type 2 diabetes risk prediction among postmenopausal women: the Women’s Health Initiative Observational Study. Arch Intern Med 2010;170:1557–1565 [DOI] [PMC free article] [PubMed] [Google Scholar]
- 18.Gkrania-Klotsas E, Ye Z, Cooper AJ, et al. Differential white blood cell count and type 2 diabetes: systematic review and meta-analysis of cross-sectional and prospective studies. PLoS ONE 2010;5:e13405. [DOI] [PMC free article] [PubMed] [Google Scholar]
- 19.Freeman DJ, Norrie J, Caslake MJ, et al. West of Scotland Coronary Prevention Study C-reactive protein is an independent predictor of risk for the development of diabetes in the West of Scotland Coronary Prevention Study. Diabetes 2002;51:1596–1600 [DOI] [PubMed] [Google Scholar]
- 20.Hu FB, Meigs JB, Li TY, Rifai N, Manson JE. Inflammatory markers and risk of developing type 2 diabetes in women. Diabetes 2004;53:693–700 [DOI] [PubMed] [Google Scholar]
- 21.Pradhan AD, Manson JE, Rifai N, Buring JE, Ridker PM. C-reactive protein, interleukin 6, and risk of developing type 2 diabetes mellitus. JAMA 2001;286:327–334 [DOI] [PubMed] [Google Scholar]
- 22.Tirosh A, Shai I, Afek A, et al. Adolescent BMI trajectory and risk of diabetes versus coronary disease. N Engl J Med 2011;364:1315–1325 [DOI] [PMC free article] [PubMed] [Google Scholar]
- 23.Tirosh A, Shai I, Tekes-Manova D, et al. Israeli Diabetes Research Group Normal fasting plasma glucose levels and type 2 diabetes in young men. N Engl J Med 2005;353:1454–1462 [DOI] [PubMed] [Google Scholar]
- 24.Gregor MF, Hotamisligil GS. Inflammatory mechanisms in obesity. Annu Rev Immunol 2011;29:415–445 [DOI] [PubMed] [Google Scholar]
- 25.Liu S, Tinker L, Song Y, et al. A prospective study of inflammatory cytokines and diabetes mellitus in a multiethnic cohort of postmenopausal women. Arch Intern Med 2007;167:1676–1685 [DOI] [PubMed] [Google Scholar]
- 26.Ong KL, Tso AW, Xu A, et al. Evaluation of the combined use of adiponectin and C-reactive protein levels as biomarkers for predicting the deterioration in glycaemia after a median of 5.4 years. Diabetologia 2011;54:2552–2560 [DOI] [PMC free article] [PubMed] [Google Scholar]
- 27.Herder C, Baumert J, Zierer A, et al. Immunological and cardiometabolic risk factors in the prediction of type 2 diabetes and coronary events: MONICA/KORA Augsburg case-cohort study. PLoS ONE 2011;6:e19852. [DOI] [PMC free article] [PubMed] [Google Scholar]
- 28.Gustafson B. Adipose tissue, inflammation and atherosclerosis. J Atheroscler Thromb 2010;17:332–341 [DOI] [PubMed] [Google Scholar]
- 29.Harman-Boehm I, Blüher M, Redel H, et al. Macrophage infiltration into omental versus subcutaneous fat across different populations: effect of regional adiposity and the comorbidities of obesity. J Clin Endocrinol Metab 2007;92:2240–2247 [DOI] [PubMed] [Google Scholar]
- 30.Klöting N, Fasshauer M, Dietrich A, et al. Insulin-sensitive obesity. Am J Physiol Endocrinol Metab 2010;299:E506–E515 [DOI] [PubMed] [Google Scholar]
- 31.Kuk JL, Katzmarzyk PT, Nichaman MZ, Church TS, Blair SN, Ross R. Visceral fat is an independent predictor of all-cause mortality in men. Obesity (Silver Spring) 2006;14:336–341 [DOI] [PubMed] [Google Scholar]
- 32.Montague CT, O’Rahilly S. The perils of portliness: causes and consequences of visceral adiposity. Diabetes 2000;49:883–888 [DOI] [PubMed] [Google Scholar]
- 33.Diez Roux AV, Jacobs DR, Kiefe CI, Coronary Artery Risk Developoment in Young Adults (CARDIA) Study Neighborhood characteristics and components of the insulin resistance syndrome in young adults: the Coronary Artery Risk Development in Young Adults (CARDIA) study. Diabetes Care 2002;25:1976–1982 [DOI] [PubMed] [Google Scholar]
- 34.Navas-Nacher EL, Colangelo L, Beam C, Greenland P. Risk factors for coronary heart disease in men 18 to 39 years of age. Ann Intern Med 2001;134:433–439 [DOI] [PubMed] [Google Scholar]
- 35.Stamler J, Stamler R, Neaton JD, et al. Low risk-factor profile and long-term cardiovascular and noncardiovascular mortality and life expectancy: findings for 5 large cohorts of young adult and middle-aged men and women. JAMA 1999;282:2012–2018 [DOI] [PubMed] [Google Scholar]
- 36.Gabir MM, Hanson RL, Dabelea D, et al. The 1997 American Diabetes Association and 1999 World Health Organization criteria for hyperglycemia in the diagnosis and prediction of diabetes. Diabetes Care 2000;23:1108–1112 [DOI] [PubMed] [Google Scholar]
- 37.Chiasson JL, Josse RG, Gomis R, Hanefeld M, Karasik A, Laakso M, STOP-NIDDM Trial Research Group Acarbose for prevention of type 2 diabetes mellitus: the STOP-NIDDM randomised trial. Lancet 2002;359:2072–2077 [DOI] [PubMed] [Google Scholar]
- 38.Chiasson JL, Josse RG, Gomis R, Hanefeld M, Karasik A, Laakso M, STOP-NIDDM Trial Research Group Acarbose for the prevention of type 2 diabetes, hypertension and cardiovascular disease in subjects with impaired glucose tolerance: facts and interpretations concerning the critical analysis of the STOP-NIDDM Trial data. Diabetologia 2004;47:969–975; discussion 976–977 [DOI] [PubMed] [Google Scholar]
- 39.Durbin RJ. Thiazolidinedione therapy in the prevention/delay of type 2 diabetes in patients with impaired glucose tolerance and insulin resistance. Diabetes Obes Metab 2004;6:280–285 [DOI] [PubMed] [Google Scholar]
- 40.Knowler WC, Barrett-Connor E, Fowler SE, et al. Diabetes Prevention Program Research Group Reduction in the incidence of type 2 diabetes with lifestyle intervention or metformin. N Engl J Med 2002;346:393–403 [DOI] [PMC free article] [PubMed] [Google Scholar]
Associated Data
This section collects any data citations, data availability statements, or supplementary materials included in this article.