Abstract
Regulator of Cullins-1 (ROC1) or RING box protein-1 (RBX1) is an essential RING component of Cullin-RING ligase (CRL). Our previous studies showed that ROC1 is required for the growth of several cancer cell lines while ROC1 siRNA silencing inactivates CRL, leading to cell cycle arrest, cell senescence and/or apoptosis. However, it is completely unknown whether ROC1 knockdown triggers autophagic response by inactivating CRL. Moreover, the role of ROC1 in liver cancer remains elusive. In this study, we reported that ROC1 knockdown significantly inhibited the growth of liver cancer cells by sequentially and independently inducing autophagy and p21-dependent cell senescence. Mechanism analysis revealed that ROC1 silencing triggered autophagy by inhibition of mammalian target of rapamycin (mTOR) activity due to accumulation of mTOR-inhibitory protein Deptor, a substrate of CRL. Consistently, Deptor knockdown significantly blocked autophagy response upon ROC1 silencing. Biologically, autophagy response upon ROC1 silencing was a survival signal, and blockage of autophagy pathway sensitized cancer cells to apoptosis. Finally, we demonstrated that ROC1 was overexpressed in hepatocellular carcinomas, which is associated with poor prognosis of liver cancer patients. These findings suggest that ROC1 is an appealing drug target for liver cancer and provide a proof-of-concept evidence for a novel drug combination of ROC1 inhibitor and an autophagy inhibitor for effective treatment of liver cancer by enhancing apoptosis.
Keywords: ROC1, Cullin-RING ligase, autophagy, senescence, Deptor
The Cullin-RING ligase (CRL) (also known as SKP1-Cullin-F-box proteins (SCF) E3 ubiquitin ligases as its founding member) is the largest family of multiunit ubiquitin ligases. CRL/SCF E3 ligase (CRL/SCF) regulates diverse biological processes by controlling the degradation of a variety of substrates, including tumor suppressors, oncoproteins, cell cycle regulators, transcriptional factors and signal transducers, whereas its dysfunction leads to carcinogenesis and tumor progression, suggesting CRL/SCF as a potential anticancer target.1, 2 Most recently, MLN4924, as a first-in-class inhibitor of Nedd8-activating enzyme, was discovered via high-throughput screening. By blocking cullin neddylation, which is required for CRL/SCF activity, MLN4924 inactivates CRL/SCF, leading to the accumulation of CRL/SCF substrates and the subsequent growth suppression of cancer cells.3 Owing to its promising anticancer efficacy, MLN4924 has been advanced into phase I trials for several solid tumors and hematological malignancies, which further highlights the promise of targeting CRL/SCF E3 for drug discovery and cancer treatment.4, 5
The core structure of CRL/SCF is a complex of regulator of Cullins-1 (ROC1) in which ROC1 interacts with all seven cullin family members to activate CRL/SCF.6 ROC1 is a highly evolutionarily conserved RING-H2 finger domain-containing protein that binds to two zinc ions and is required for CRL/SCF ligase activity.7, 8 On one hand, ROC1 complexes with cullin and through which the substrate-recruiting proteins to form functional CRL/SCF E3 ligases, and on the other hand, ROC1 binds to ubiquitin-loaded E2 ubiquitin-conjugating enzyme, catalyzing the reaction of transferring ubiquitin to specific substrates for proteasome-targeted degradation.9 As an essential component of CRL/SCF, ROC1 is required for the development of Caenorhabditis elegans,10 Drosophila11 and mouse,12 by preventing the accumulation of growth-suppressive substrates of CRL/SCF, such as p27.12
Recently, we reported that ROC1 is overexpressed in multiple human tumor tissues whereas ROC1 knockdown via siRNA silencing suppresses the growth of multiple lines of cancer cells.13 Mechanistically, ROC1 silencing disassembles CRL/SCF complexes and thus inhibits CRL/SCF activity. As the result, DNA replication licensing proteins CDT1 and ORC1, two well-known CRL/SCF substrates, accumulate to trigger DNA damage response, leading to G2–M cell cycle arrest, senescence and/or apoptosis in cancer cells. A recent study showed that autophagy could mediate the transition of oncogene-induced senescence (OIS).14, 15 Here, we determined whether ROC1 knockdown also induces autophagy and reported that, in liver cancer cells, ROC1 knockdown induces autophagy in addition to senescence, leading to substantial growth suppression. We also found that ROC1 is overexpressed in liver cancer, which is associated with poor survival of patients. Thus, our study provides the first piece of appealing evidence supporting the notion that ROC1 is an attractive target for liver cancer as well as serving as a potential prognosis marker.
Results
ROC1 silencing suppressed the growth of liver cancer cells in vitro and in vivo
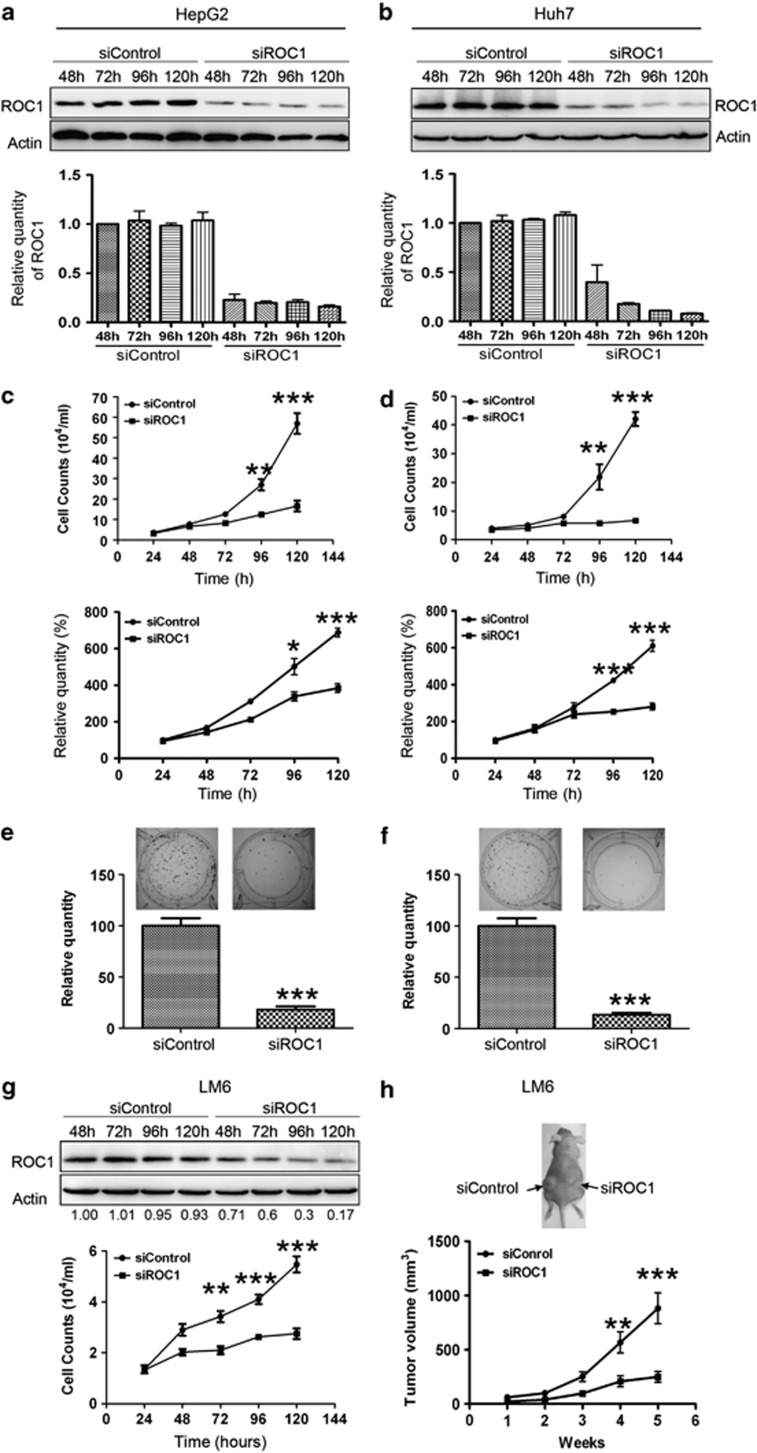
To address the role of ROC1 in the growth of liver cancer cells, we knocked down ROC1 in HepG2 and Huh7 cells using two siRNA oligoes targeting two well-identified regions of ROC1 sequences (named siROC1 and siROC1-2, respectively, Figures 1a and b; Supplementary Figure 1). ROC1 knockdown significantly inhibited the proliferation of HepG2 and Huh7 cells (Figures 1c and d; Supplementary Figure 1). ROC1 silencing also notably suppressed clonogenic survival by inhibiting colony formation in both cell lines (Figures 1e and f). Based on these in vitro findings, we further hypothesized that the ability of in vivo tumor formation of siROC1-silenced cells would be significantly impaired when compared with siControl cells. To address this, we next evaluated the effect of ROC1 knockdown on tumorigenesis using LM616, 17 xenograft model of human hepatocellular carcinomas (HCCs) with rapid growth upon transplantation into mice. We first confirmed that ROC1 knockdown indeed caused substantial growth suppression of LM6 cell in culture (Figure 1g), and then implanted LM6 cells transfected with control siRNA (siControl) and siROC1 into the left or right flanks of nude mice, respectively. As shown in Figure 1h, the tumor growth in the siROC1 group was significantly inhibited by 70% when compared with that of the siControl group. Thus, transient knockdown of ROC1 by siRNA silencing is sufficient to suppress in vivo tumor formation. Taken together, these findings demonstrated that ROC1 is required for the growth of liver cancer cells both in vitro and in vivo.
Figure 1.
The growth-suppressive effect of ROC1 silencing on liver cancer cells in vitro and in vivo. (a and b) ROC1 knockdown via siRNA silencing inhibited the proliferation of HepG2 (a) and Huh7 (b) cells. The cells were transfected with siControl or siROC1 for 24–120 h, and subjected to IB analysis of expression of ROC1 (a and b) with actin as a loading control, quantification relative to actin by densitometric analysis using the Image J software (MD, USA), and cell proliferation assay by cell counting (c and d, top panels) and CCK8 assay (c and d bottom panels). The results were presented as mean value±S.E. from three independent experiments with each running in triplicate. (e and f) ROC1 silencing reduced colony formation in HepG2 (e) and Huh7 (f) cells. (g and h) ROC1 knockdown inhibited the growth of LM6 cells in vitro and in vivo. LM6 cells transfected with siRNAs were subject to IB for ROC1 expression (g, top panel), quantification relative to actin by densitometric analysis using the Image J software, cell proliferation assay in vitro (g, bottom panel) and xenograft tumor growth in vivo (h). The representative image for xenograft tumor on the nude mouse is shown on (h top panel) and tumor growth curve was shown in (h bottom panel). (n=10). *P<0.05, **P<0.01 and ***P<0.001
ROC1 silencing induced G2–M cell cycle arrest and p21-dependent cell senescence
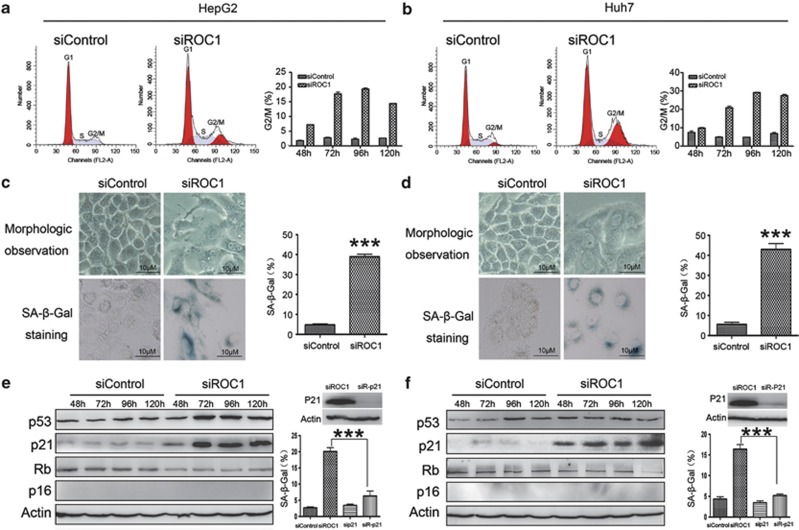
To investigate the mechanism underlying the growth suppression of liver cancer cells by ROC1 knockdown, we first determined cell cycle profile of the ROC1-silenced cells by PI staining and FACS analysis. As shown in Figure 2, siROC1 induced the G2–M arrest, which occurred at 48 h post ROC1 silencing, and reached a peak at 96 h in HepG2 (Figure 2a) and Huh7 (Figure 2b) as well as LM6 cells (data not shown). No obvious apoptosis occurred, as demonstrated by the lack of sub-G1 peak. Morphologically, when compared with control cells, ROC1-silenced cells were much larger in size with flattened shape, a feature of cell senescence, (Figures 2c and d, top left panel). To determine whether ROC1 knockdown indeed induced senescence, we examined the expression of senescence-associated β-galactosidase (SA-β-gal), a classic biochemical marker for cellular senescence, in ROC1-silenced cells by SA-β-gal staining. We found that about 40% of ROC1-knockdown cells, but <5% of control cells, were positively stained (Figures 2c and d, bottom left panel and right bar graph, and Supplementary Figure 2). The findings indicated that cells arrested at the G2/M upon ROC1 knockdown eventually underwent senescence.
Figure 2.
ROC1 silencing induced G2–M cell cycle arrest and p21-dependent cell senescence. (a and b) ROC1 silencing induced G2–M cell cycle arrest in HepG2 (a) and Huh7 (b) cells. Cells were transfected with siControl or siROC1 for 48–120 h, and subjected to PI staining and FACS analysis to determine cell cycle profile. (c and d) ROC1 silencing induced cell senescence in HepG2 (c) and Huh7 (d) cells. Cells were transfected with siControl or siROC1 for 120 h and subjected to cellular morphological observation (top left panels), SA-β-gal staining (bottom left panels) and quantification of positively stained cells (right panels). (e and f) ROC1 silencing-induced cell senescence is p21-dependent in HepG2 (e) and Huh7 (f) cells. The HepG2 and Huh7 cells transfected with siRNAs for 96 h, and were subjected to IB analysis of expression of proteins indicated (left panels) and senescence analysis with SA-β-gal staining (right panels). The results were presented as mean value±S.E. from three independent experiments, ***P<0.001
To address how ROC1 knockdown induced senescence in liver cancer cells, we determined the activation status of the p16/pRB and p53/p21 axes, two major senescence-triggering pathways in response to stresses18 and found that ROC1 knockdown consistently induced the accumulation of CRL/SCF substrate p21, but not p53, pRB and p16, in both HepG2 cells (Figure 2e and Supplementary Figure 2a) and Huh7 cells (Figure 2f and Supplementary Figure 2b), suggesting a potential involvement of p21 in ROC1 silencing-induced cellular senescence. We further showed that p21 knockdown largely abrogated senescence response induced by ROC1 knockdown (Figures 2e and f, right bar graphs). These results suggested that ROC1 knockdown induced a p21-dependent cell senescence to suppress the growth of liver cancer cells.
ROC1 silencing induced autophagy as a novel cellular response in liver cancer cells
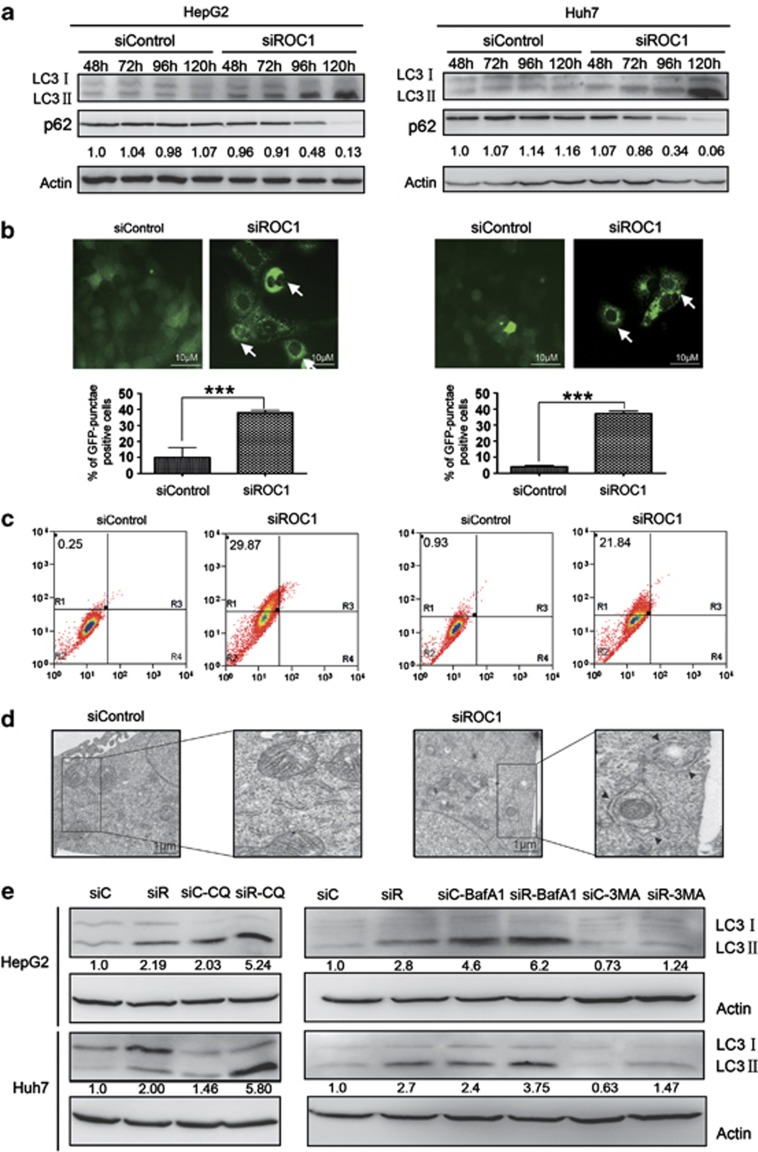
Having established that ROC1 knockdown induced cell senescence in liver cancer cells, we next investigated whether ROC1 knockdown also triggers autophagy, as a novel cellular response, to regulate cell survival upon CRL/SCF inactivation. During autophagy, microtubule-associated protein light chain 3-I (LC3-I) is converted to lipidated LC3-II, which is associated with autophagic vesicles and displays classical punctate distribution, as classical hallmarks of autophagy.19, 20 As shown in Figure 3, ROC1 silencing induced time-dependent conversion of LC3-I to LC3-II in both HepG2 and Huh7 cells (Figure 3a and Supplementary Figure 3) and punctate distribution of membrane-associated lipidated LC3II in HepG2-EGFP-LC3 (Figure 3b, top left panel) and Huh7-EGFP-LC3 cells (Figure 3b, top right panel). Specifically, 35–40% of ROC1-silenced cells, but only 5–10% of control cells, underwent autophagy (Figure 3b, bottom panels). Consistently, the degradation of p62, another autophagic marker, was observed in both cell lines upon ROC1 knockdown (Figure 3a). Furthermore, we performed cell staining with acridine orange (AO) and FACS analysis to detect acidic vesicular organelle (AVO) formation as a characteristic of autophagy, and found significant accumulation of AVO in the cytoplasm of ROC1-silenced cells, but not of control cells (Figure 3c), suggesting the induction of autophagy upon CRL/SCF inactivation. By transmission electron microscopy, we further observed the obvious double-membrane autophagosome and vacuoles with engulfed bulk cytoplasm and cytoplasmic organelles in siROC1-silenced cells, but not in siControl cells, as another golden hallmark of autophagy19, 20 (Figure 3d). Finally, we performed autophagic flux analysis by treating cells with classical autophagy inhibitor,20, 21 including 3-methyladenine (3-MA), bafilomycin A1 (BafA1) and Chloroquine (CQ), respectively. As expected, 3-MA inhibited, but BafA1 and CQ enhanced the accumulation of LC3 II, indicating that autophagic flux was intact and supraphysiological autophagic response was indeed induced by ROC1 knockdown (Figure 3e). These results convincingly demonstrated that ROC1 knockdown induces autophagy in liver cancer cells. Furthermore, we found that ROC1 knockdown also induced autophagy in Hela cervical cancer cells and H1299 human lung carcinoma cells (Supplementary Figure 4), indicating that the effect is not limited to liver cancer cells, and is likely a general phenomenon.
Figure 3.
ROC1 silencing induced autophagy in liver cancer cells. (a) ROC1 silencing induced obvious conversion of LC3-I to LC3-II and p62 degradation in HepG2 (left panel) and Huh7 (right panel) cells. Cells transfected with siControl or siROC1 for 48–120 h were subjected to IB analysis for the expression of LC3 and p62 with actin as a loading control, and quantification relative to actin by densitometric analysis using the Image J software. (b) ROC1 silencing at 120 h induced punctuative distribution of membrane-associated lipidated LC3II in HepG2-EGFP-LC3 (left panels) and Huh7-EGFP-LC3 (right panels) cells, observed with fluorescence microscope. Arrows denoted punctate vesicle structure indicating autophagy induction. The percentage of cells undergoing autophagy in 10 independent areas was quantified (b, bottom panels). (c) ROC1 silencing at 120 h induced significant accumulation of AVO in HepG2 (left panel) and Huh7 (right panel) cells, determined by AO staining and FACS analysis. (d) Obvious double-membraned autophagosome and vacuoles with engulfed bulk cytoplasm and cytoplasmic organelles in siROC1, but not siControl HepG2 cells at 120 h. (e) Autophagic flux analysis. HepG2 or Huh7 cells, transfected with siControl or siROC1 for 48 h, were incubated with or without CQ (50 μM), BafA1 (50 nM) or 3MA (5 mM) for 6 h. The treated cells were then subject to IB analysis with actin as a loading control, and quantification relative to actin by densitometric analysis using the Image J software
ROC1 silencing induced the accumulation of mammalian target of rapamycin (mTOR)-inhibitory protein Deptor to trigger autophagy response
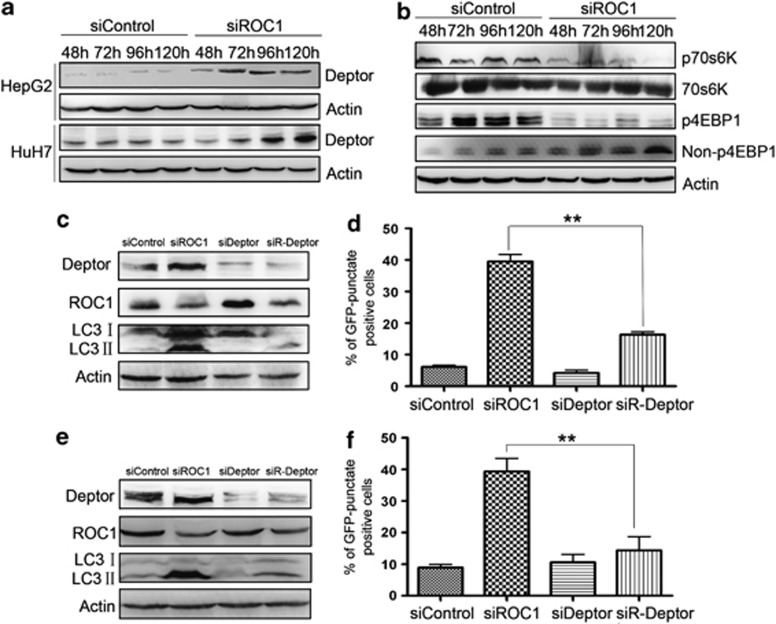
As ROC1 silencing triggers cellular responses by inactivating CRL/SCF, leading to the accumulation of CRL/SCF substrates, we next searched for CRL/SCF substrates whose accumulation may trigger autophagy. We focused on Deptor, a naturally occurring inhibitor of mTOR, a well-known negative regulator of autophagy, as our recent study showed that Deptor is bona fide SCF E3 ligase substrate.22, 23, 24 We hypothesized that by inactivating CRL/SCF to induce Deptor accumulation, thus inhibiting mTOR activity, ROC1 knockdown could trigger autophagy. Indeed, we found that, in HepG2 and Huh7 cells, the ROC1 knockdown caused Deptor accumulation (Figure 4a) and mTOR inactivation, as demonstrated by the significant decrease in phosphorylated 70S6K (p-70S6K) and phosphorylated 4EBP1 (p-4EBP1; Figure 4b), which are phosphorylated by mTOR and serve as classical markers for mTOR activation.22 As a positive control, the classical mTOR inhibitor rapamycin was included and shown to induce a significant reduction of p-4EBP1 and p-70S6K and trigger autophagy in liver cancer cells (data not shown). To determine whether the accumulation of Deptor upon ROC1 knockdown triggered autophagy directly, we knocked down Deptor via siRNA silencing and examined its effect on autophagy response in ROC1-silenced cells. Deptor knockdown largely abrogated ROC1 silencing-induced autophagy, as demonstrated by reduced conversion of LC3-I to LC3-II in HepG2 and Huh7 cells (Figures 4c and e) and decreased classical punctate distribution of EGFP-LC3 in HepG2 and Huh7 cells expressing EGPP-LC3 (Figures 4d and f). These findings indicated that Deptor is essential and causally related to autophagy induced by ROC1 knockdown in liver cancer cells.
Figure 4.
The accumulation of mTOR-inhibitory protein Deptor contributed to autophagy response upon ROC1 silencing. (a and b) Cells transfected with siControl or siROC1 were subjected to IB analysis for expression of indicated proteins over time. ROC1 silencing induced Deptor accumulation (a) and mTOR inactivation, as demonstrated by notable reduction of p70S6K and p4EBP1 in HepG2 cells (b). (c–f) Autophagy was rescued by Deptor siRNA silencing. Deptor knockdown largely abrogated ROC1 silencing-induced conversion of LC3-I to LC3-II in HepG2 (c) and Huh7 (e) cells, and decreased classical punctuative distribution of EGFP-LC3 in HepG2-EGFP-LC3 (d) and Huh7-EGFP-LC3 (f) cells 96 h post transfection. The percentage of GFP-punctuate-positive cells were quantified by counting cells in 10 independent areas. The results were presented as mean value±S.E. from three independent experiments with each running in triplicate. **P<0.01
Sequential induction of autophagy and senescence by ROC1 knockdown
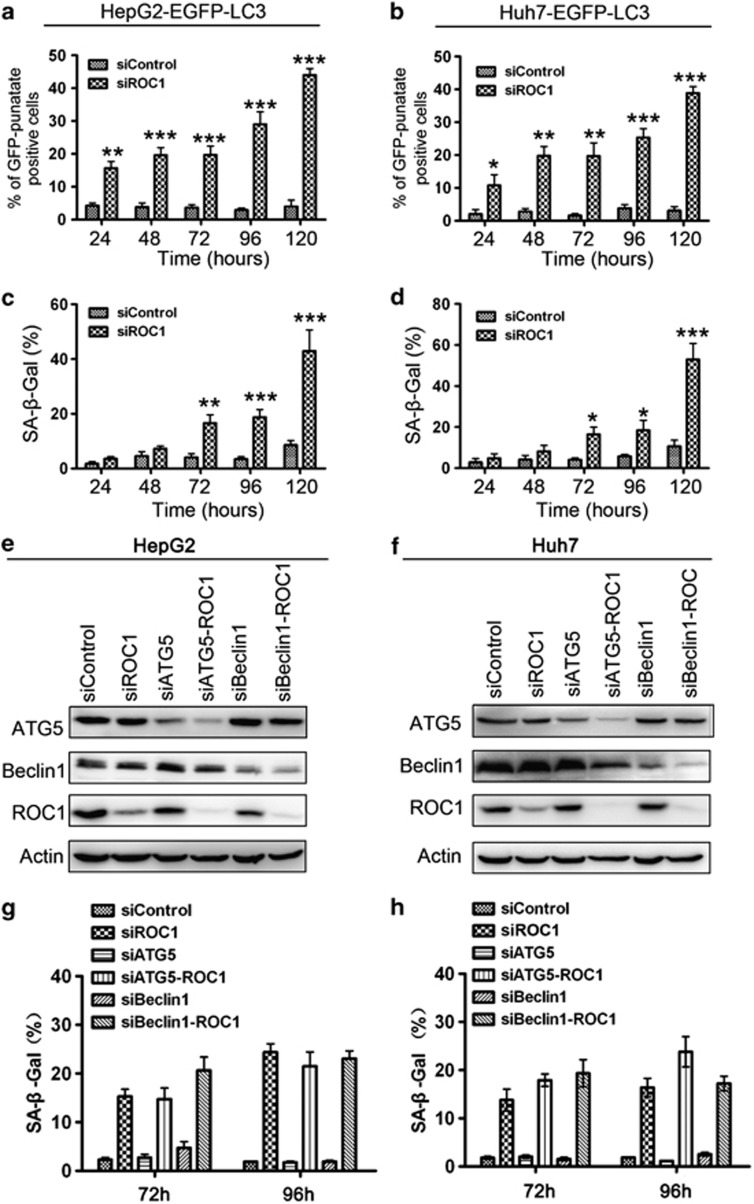
As we found that ROC1 knockdown induced both senescence and autophagy in liver cancer cells, we then determined how these cellular responses occurred temporally. To address this, we measured punctuative distribution of EGFP-LC3 for autophagy and performed the SA-β-gal staining for senescence in HepG2-EGFP-LC3 and Huh7-EGFP-LC3 cells upon ROC1 knockdown. As shown in Figure 5, autophagy occurred as early as 24 h, continued to increase over time and reached the peak at 120 h post treatment in both HepG2 and Huh7 cells (Figures 5a and b). In contrast, senescence started to occur at 72 h with continuous increase and reaching the peak at 120 h (Figures 5c and d). These data suggested that ROC1 knockdown caused a sequential induction of autophagy and senescence, with autophagy dominating at the early stage in liver cancer cells.
Figure 5.
Sequential induction of autophagy and senescence by ROC1 silencing. (a–d) Sequential induction of autophagy and senescence by ROC1 silencing. HepG2-EGFP-LC3 (a and c) or Huh7-EGFP-LC3 (b and d) cells transfected with siROC1 or siControl were subjected to autophagy analysis (a and b) by punctuative distribution of membrane-associated lipidated EGFP-LC3 under fluorescence microscope and senescence analysis (c and d) by SA-β-gal staining at time points indicated. (e–h) Blockage of autophagy pathway had no obvious effect on senescence induction upon ROC1 knockdown in liver cancer cells. HepG2 (e, g) and Huh7 (f, h) cells were transfected with siRNAs as indicated and were subjected to IB analysis of expression of proteins indicated and senescence analysis with SA-β-gal staining 96 h post transfection. A total of 10 independent areas were analyzed to quantify percentage of GFP-punctuate-positive cells (a and b) or SA-β-gal-positively stained cells(c and d, g and h).The results were presented as mean value±S.E. from three independent experiments with each running in triplicate
To address the possible relevance of autophagy activation to the occurrence of cell senescence, we blocked autophagy pathway by knockdown of autophagy essential genes Beclin and Atg5 in ROC1-silenced cells, and determined its effect on senescence induction, reflected by SA-β-gal staining, in HepG2 and Huh7 cells. As shown in Figures 5e–h, the blockage of autophagy pathway had no obvious effect on senescence induction upon ROC1 knockdown in both cell lines.
Autophagy induced by ROC1 knockdown was a survival signal and blockage of autophagy pathway promoted cancer cell death by triggering apoptosis
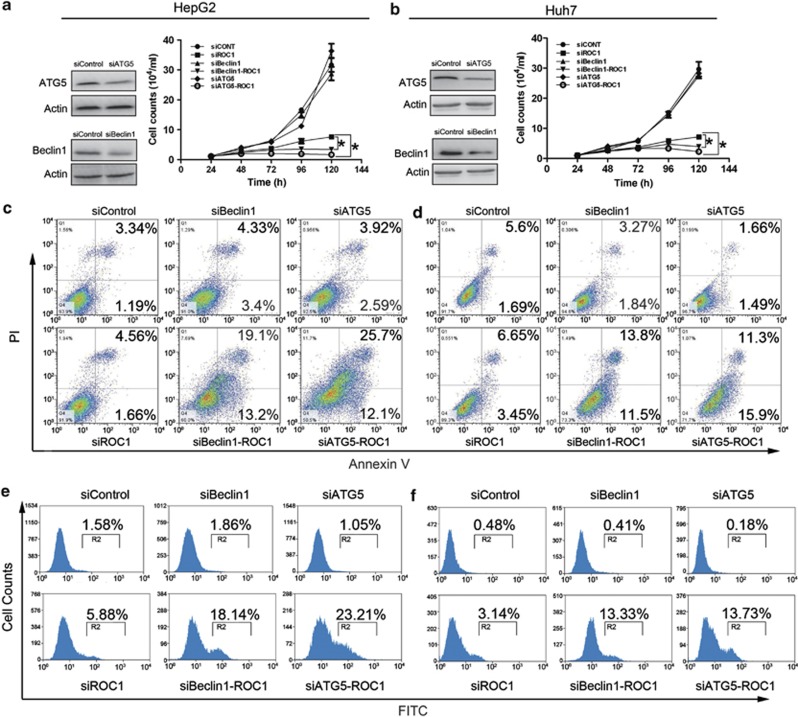
Next, we addressed the role of autophagy response induced by ROC1 knockdown in growth suppression of liver cancer cells. We blocked autophagy pathway via siRNA silencing of autophagy essential genes ATG5 or Beclin1 (Figures 6a and b, left panels), and found that while ROC1 knockdown consistently suppressed cell growth, knockdown of ATG5 or Beclin1 alone did not notably affect cell proliferation, as compared with control cells. However, the simultaneous knockdown of ROC1 and ATG5 or Beclin1 significantly enhanced the growth-suppressive effect of siROC1 in both HepG2 and Huh7 cells (Figures 6a and b, right panels), suggesting that autophagy response as a survival signal upon CRL/SCF inactivation. We next determined how blockage of autophagy pathway enhanced growth-inhibitory effect of ROC1 silencing. Morphological observation of treated cells showed that combinational knockdown of ROC1 with ATG5 or Beclin1 induced more cell death with shrunk cellular morphology, a feature of cell apoptosis (Supplementary Figure 5). Apoptosis assay using PI and Annexin V-FITC double staining further revealed that simultaneous knockdown of ROC1/ATG5 or ROC1/Beclin1 indeed rendered ROC1-silenced cells to undergo apoptosis in both cell lines (Figures 6c and d). Moreover, we found that combinational knockdown of ROC1 with ATG5 or Beclin1 significantly enhanced caspase3 activation when compared with ROC1 silencing alone (Figures 6e and f), as another golden maker of apoptosis induction. These data demonstrated that autophagy upon ROC1 knockdown serves as a survival signal and blockage of autophagy pathway sensitizes liver cancer cells to apoptosis.
Figure 6.
Blockage of autophagy pathway enhanced growth-inhibitory effects of siROC1 by triggering apoptosis. HepG2 (a, c and e) and Huh7 (b, d and f) cells were transfected with siRNAs as indicated for cell proliferation assay in 24–120 h (a and b), or for apoptosis assay by either annexin V and PI double staining (c and d) or by caspase 3 activation assay with the caspGLOW fluorescein active caspase-3 staining kit with FACS analysis (e and f) in 120 h. These data were representative results of at least two independent experiments with similar trend
ROC1 overexpression was observed in HCCs and predicted a poor prognosis in HCC patients
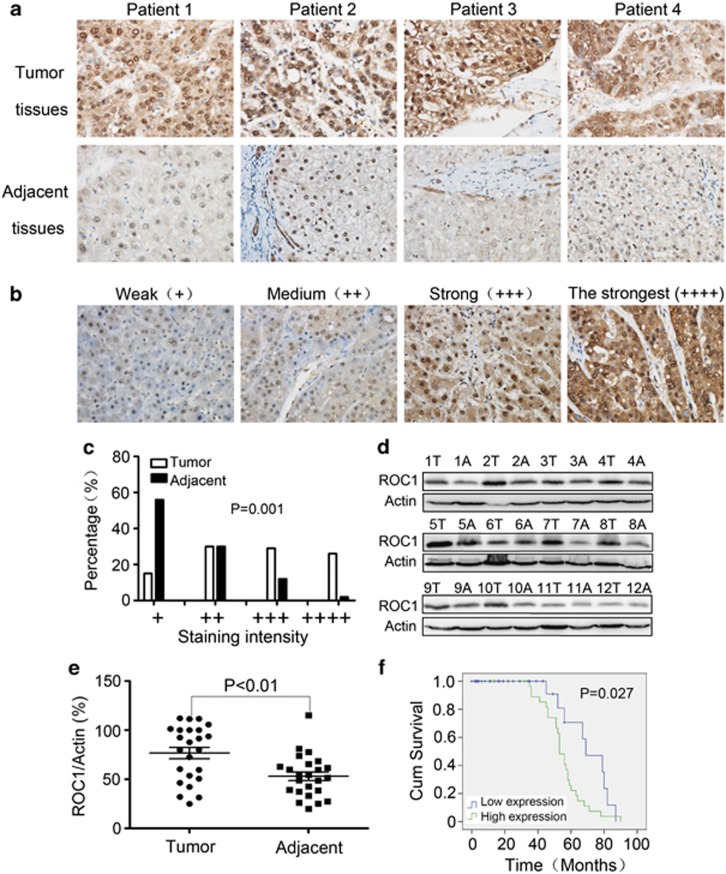
To investigate the clinical significance of ROC1 in liver cancers, we first determined the expression of ROC1 in HCCs and adjacent liver tissues by immunohistochemistry (IHC) staining of human HCC tissue array containing 151 primary HCC tissues and their adjacent liver tissues with a well-defined anti-ROC1 antibody.12, 13 As shown in Figure 7a, we found that ROC1 was overexpressed in the tumor tissues (top panels) compared with adjacent liver tissues (bottom panels). Based upon the intensity of staining, we classified the samples into four groups with increasing staining intensity from weak (+) to the strongest (++++ Figures 7b and c). ROC1 expression was weak, falling into groups 1 and 2, in a majority of adjacent normal tissues (86%). But it was high, falling into groups 2–4 in a majority of liver cancer tissues (85% Figure 7c). We further quantified the expression level of ROC1 in HCC tissues, as compared with their adjacent liver tissues (a total of 24 paired cancers versus adjacent samples) by immunoblotting (IB) analysis. As shown in Figures 7d and e, the level of ROC1 in tumor tissues was significantly higher than that in the surrounding adjacent liver tissues from the same patient.
Figure 7.
ROC1 was overexpressed in HCCs and negatively correlated with patient survival. (a) IHC staining of human HCC tissue array using ROC1-specific antibody, as described in Material and Methods. (b and c) Classification of samples according to the intensity of staining of ROC1 expression (n=151; P=0.001). (d) IB analysis to determine expression of ROC1 in HCCs and adjacent liver tissues. A, adjacent liver tissues; T, HCC tumor tissues. Representative results of 12 out of 24 pair of tissues were shown. (e) Quantification of ROC1 expression in HCCs and adjacent liver tissues (n=24). (f) Correlation analysis of ROC1 expression status and patient survival (n=75)
Finally, we analyzed the correlation of ROC1 expression status (low expression for group 1(+) and 2(++) versus high expression for group 3(+++) and 4(++++)) with clinicopathological features of HCC patients. We found that the ROC1 expression in the HCC tissues was negatively correlated with the survival rate of the patients (Figure 7f, P=0.027). Moreover, ROC1 expression seemed to be positively correlated with (a) tumor size, as high level of ROC1 expression was detected in 54 out of 87 tumors (62%) with size >5 cm, but in 28 out of 64 tumors (44%) with size <5 cm (Supplementary Table 1, P=0.032); and (b) to a less extent, pathological differentiation grade, as high level of ROC1 expression was detected in 36 out of 56 tumors (64%) with differentiation grade 3, but in 7 of 20 tumors (35%) with differentiation grade 1 (Supplementary Table 1, P=0.065). However, no correlation between ROC1 expression and other clinical parameters (e.g., age and tumor location) was observed. Taken together, these findings suggested that ROC1 overexpression may be required for liver tumorigenesis or for the maintenance of its malignant phenotypes. Thus, ROC1 overexpression has a potential to be developed as a prognosis biomarker for liver cancer patients.
Discussion
Our recent study revealed that ROC1 is essential for the growth and survival in a number of human non-hepatic cancer cell models, as ROC1 knockdown caused sequential induction of G2/M arrest, senescence and apoptosis.10, 13 Here, we extended this work to liver cancer cells and found that ROC1 knockdown indeed remarkably suppressed growth and survival of liver cancer cells with unique mechanisms involving G2/M arrest, senescence and autophagy, but not apoptosis. This difference in apoptotic induction in different cancer lines is most likely attributed to cell line-specific responses, but not the induction of autophagy, as ROC1 knockdown induced autophagy in all these cancer lines of hepatic lineage (Figure 3) and non-hepatic lineage (Supplementary Figure 4 and data not shown). Interestingly, apoptosis only occurs when autophagy is inhibited in liver cancer cells in response to ROC1 knockdown (Figure 6).
Cellular senescence is a mechanism to restrain proliferation of potentially tumorigenic cells, and induction of senescence in cancer cells has become a promising approach for cancer therapy.18, 25 In this study, we found that cell senescence induced by ROC1 knockdown contributes to the growth suppression of liver cancer cells. Consistently, recent studies from our laboratory and other groups revealed that CRL/SCF inhibition by MLN4924 also triggered cell senescence as mechanism of growth suppression,26, 27 indicating that induction of senescence is a general phenomenon of cancer cells in response to CRL/SCF inactivation. However, unlike senescence induced by ROC1 knockdown in H1299 and U87 cells in which p21 was not involved,26 we found that ROC1 knockdown-induced senescence in liver cancer cells is largely dependent on p21, as (a) p21 is significantly induced in response to ROC1 knockdown, and (b) simultaneous knockdown of p21 and ROC1 remarkably abrogated the senescence. This apparent discrepancy is likely due to cell line-dependent accumulation of CRL/SCF substrates in response to ROC1 knockdown. Nevertheless, it is noteworthy that senescence induced by CRL/SCF inhibitor MLN4924 was also attributable to p21 accumulation even in H1299 and U87 cells.26
ROC1 knockdown-induced senescence in liver cancer cells seemed to occur in a p53-independent manner as ROC1 silencing induced senescence in both wild type p53-expressing HepG2 cells28 and mutant p53-containing Huh7 cells29 (Figure 2). Similarly, we previously reported that, in other cancer cell lines, senescence induced by CRL/SCF inactivation via either ROC1 knockdown or MLN4924 treatment was also independent of p53.13, 26 In addition, our recent studies using multiple cancer lines indicated that senescence induced by CRL/SCF inactivation is pRB-independent as well.13, 26 In this study, we noticed that ROC1 knockdown reduced, but not increased the level of the tumor suppressor pRB, which contributes to cell senescence induction in some circumstances,25 further excluding the involvement of pRB in ROC1 silencing-induced senescence in liver cancer cells.
Autophagy is a process of cellular stress response by which some cytosolic materials are engulfed into autophagosome, followed by lysosome-mediated degradation. In this study, we made a novel observation that ROC1 knockdown induces autophagy in liver cancer cells (Figure 3). In addition to liver cancer cells, we found that autophagy could also be triggered by ROC1 knockdown in multiple other cancer cell lines, including Hela cervical cancer cells and H1299 human lung cancer cells (Supplementary Figure 4). Moreover, we found that CRL/SCF inactivation by MLN4924 triggers autophagy in a broad spectrum of cancer cells as well.30, 31 These findings indicate that autophagy is a universal cellular response to CRL/SCF inactivation, induced by either siRNA knockdown of its essential components (such as ROC1) or small molecule inhibitors (such as MLN4924).
Several recent studies implied that autophagy may regulate senescence. Reports from Narita and colleagues14, 15 supported a promoting role of autophagy in OIS in human diploid fibroblasts. They found that autophagy was activated during mitotic senescence transition and contributed to the induction of senescence. Consistently, overexpression of autophagy-related gene ULK3 induced autophagy and senescence. Conversely, another report32 showed that autophagy impairment via the depletion of ATG7, ATG12 or lysosomal-associated membrane protein 2 genes could also induce premature senescence in human diploid fibroblasts. The apparent discrepancy arising from these studies suggests that (a) potential regulation of senescence by autophagy could be context-dependent with mechanism(s) remaining elusive; and (b) autophagy response is not required for senescence induction under some circumstances. In this study, we found that the blockage of autophagy pathway had no obvious effect on senescence induction upon ROC1 silencing (Figure 5). A potential explanation of our results may be that ROC1 knockdown triggered autophagy and senescence independently, resulting from accumulation of different sets of CRL/SCF substrates. Indeed, we showed that accumulation of Deptor or p21 is causally related to autophagy and senescence, respectively (Figures 2 and 4).
It is well known that mTOR, as an evolutionarily conserved serine/threonine kinase, integrates signals from growth factors, nutrients and stresses to regulate cell survival and autophagy whereas the inhibition of mTOR by genetic inactivation or small molecule inhibitor triggers autophagy. Recently, Deptor, a physiological inhibitor of mTOR, was well-characterized as a substrate of CRL/SCF by three groups, including our own,22, 23, 24 and siRNA knockdown of β-TrCP, an F-box protein that binds to Deptor caused Deptor accumulation to block mTOR signals, thus inducing autophagy.21 Here, we reported that autophagy induced by ROC1 knockdown in liver cancer cells is largely dependent on Deptor, as evidenced by (a) notable accumulation of Deptor and subsequent mTOR inactivation upon ROC1 knockdown, and (b) more importantly, the notable rescue of autophagy response by simultaneous Deptor knockdown. However, it should be mentioned that other autophagy-regulated pathways may also be involved in autophagy response upon ROC1 knockdown as Deptor knockdown alone failed to completely abrogate autophagy response, an interesting subject for future investigation.
Autophagy is initially considered as an adaptive pro-survival program under cellular stresses. However, recent accumulated data indicate that autophagy response could also have a cell-killing but not cell-protective role under some cellular stresses, which leads to autophagic cell death (also known as type II programmed cell death).33, 34 In this study, we found that autophagy response upon CRL/SCF inactivation by ROC1 knockdown seemed a survival signal, as blockage of autophagy pathways enhanced its growth-suppressive effects and triggered massive apoptosis in liver cancer cells (Figure 6). Similarly, we found that pharmaceutical inactivation of CRL/SCF by MLN4924 also triggered pro-survival autophagy response in liver cancer cells,30 as well as in many other human cancer cells press.31 The findings provide proof-of-concept evidence for a novel drug combination of CRL/SCF inhibitor and autophagy inhibitors for more effective cancer therapy.
Another interesting finding of this study is that ROC1 is overexpressed in liver cancer tissues and ROC1 overexpression is associated with poor prognosis of liver cancer patients. Although descriptive, the finding suggests that ROC1 may contribute to liver carcinogenesis or is essential for the maintenance of malignant phenotypes of liver cancers. It is logically assumed that cells with ROC1 overexpression display a growth advantage and are likely selected for during liver tumorigenesis, as ROC1-mediated degradation of tumor suppressors (e.g., p21 and p27), and DNA replication licensing proteins (e.g., CDT1 and ORC1) would accelerate cell growth. Similarly, we found that other cancer cells are also addicted to overexpression of ROC1, likely due to the fact that ROC1 is the essential RING component of CRL/SCF E3 ligases that are required for the growth of cancer cells.10, 13, 26 Future work is directed to address this important issue using in vivo mouse models with liver-specific deletion and transgenic expression of ROC1. Furthermore, our study also provided a basis for future development of ROC1 as a prognosis biomarker for liver cancer.
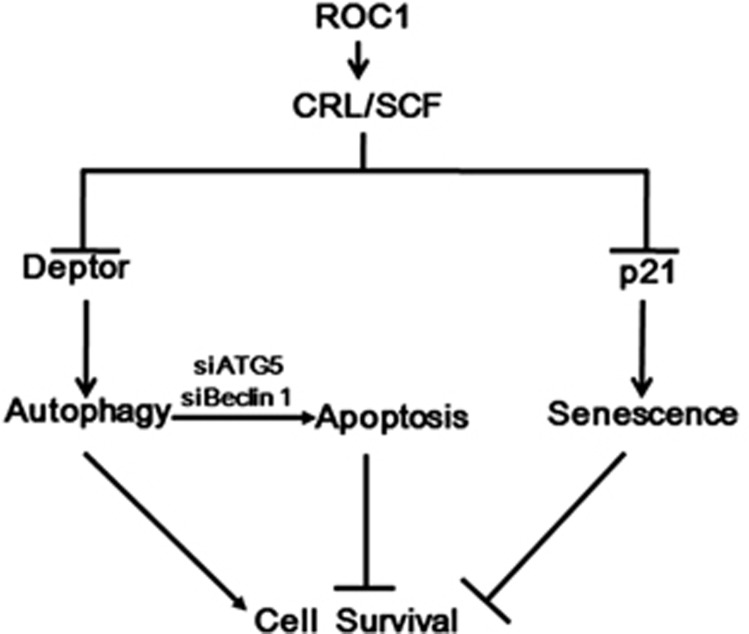
In summary, our study suggested the following working model. In liver cancer cells, ROC1 knockdown triggers autophagy response mainly by Deptor accumulation to maintain cell survival, while it induces senescence in p21-dependent manner to inhibit cell growth. Blockage of autophagy pathway sensitizes ROC1-silenced cells to apoptosis (Figure 8). Our study revealed a novel mechanism of ROC1 knockdown by inducing survival autophagy and suggested a rationale drug combination for effective treatment of liver cancer with ROC1 inhibitor (e.g., MLN4924) and an autophagy inhibitor.
Figure 8.
Working model. ROC1 silencing induced p21-dependent senescence to suppress the growth of liver cancer cells, while it triggered autophagy as a survival signal by inducing accumulation of Deptor as a CRL/SCF substrate. Blockage of autophagy pathway via siRNA silencing of autophagy essential genes sensitized cancer cells to apoptosis upon ROC1 silencing
Materials and Methods
Cell culture and reagents
Human liver cancer cell lines Huh-7 and Hep G2 were obtained from the American Type Culture Collection (Manassas, VA, USA) and the highly spontaneous metastatic human HCC cell line LM616, 17 was obtained from the Liver Cancer Institute, Zhongshan Hospital, Fudan University (Shanghai, China). These cells were cultured in Dulbecco's modified Eagle's medium (Hyclone), containing 10% fetal bovine serum and 1% Penicillin–Streptomycin solution, at 37°C with 5% CO2. CQ, BafA1 and 3-MA were purchased from Sigma (St. Louis, MO, USA).
Immunoblotting
Cell lysates were extracted with cell lysis buffer (Beyotime, Hangzhou, China) and the protein concentration in the lysates was quantified using an Enhanced BCA Protein Assay Kit (Beyotime). Protein samples with 30–50 μg were loaded for IB, using antibodies against p16, p4EBP1, 4EBP1, p70s6k, ATG5, Beclin1 (Cell Signaling Inc., Danvers, MA, USA), P53, p21, p-p70s6K (Epitomics, Hangzhou, China), Rb (Santa Cruz Biotechnology, Santa Cruz, CA, USA), LC3, Deptor (Sigma), ROC1 (Abcam, Hongkong, Hongkong) and Actin (Kangwei, Shanghai, China).
IHC staining of human tumor tissue array
Human HCC tumor tissue arrays were provided and IHC stained with ROC1-specific antibody made against COOH-terminal peptide of human ROC1 (Abcam) by Shanghai Biochip (Shanghai, China), using the DakoCytomation EnVision+ System-HRP (DAB) detection kit. Briefly, the tissue array sections in 5 μm were dehydrated and subject to peroxidase blocking. ROC1 antibody was added at a dilution of 1 : 200 and incubated at room temperature for 30 min on the Dako AutoStainer (Carpinteria, CA, USA) using the DakoCytomation EnVision+ System-HRP (DAB) detection kit. The slides were counterstained with hematoxylin. The stained slides were observed under microscope and images were acquired.
HCC tissue collection and patient follow-up
Fresh HCC tissues and their adjacent liver tissues were collected from 151 patients undergoing resection of HCCs from February 2004 to December 2008 at Huashan Hospital. HCC diagnosis was based on the World Health Organization criteria. Tumor differentiation was defined according to the Edmondson grading system. The detailed clinicopathological characteristics are given in Supplementary Table 1. Ethical approval was obtained from the Research Ethics Committee of Huashan Hospital, and written informed consent was obtained from each patient. Follow-ups were terminated until 8 December 2011. The median follow-up was 59 months (range, 2–90 months). During the follow-up period, a total of 76 patients were lost, which meant 75 patients were eventually available at the final follow-up, giving a follow-up rate of 49.6%.
siRNA silencing
Liver cancer cells were transfected with siRNA oligonucleotides using Lipofectamine 2000.10, 13 Briefly, siRNA and Lipofectamine 2000 were each incubated separately with Opti-MEM for 5 min, mixed together for 20 min at room temperature and then the mixture was applied to the cells plated in 4 ml of medium (final concentration of siRNA is 60 nM). The sequences of siRNAs are as follows: for ROC1,10, 13, 35 siROC1:5′-GACTTTCCCTGCTGTTACCTAATT-3′ siROC1-2:5′-CTGTGCCATCTGCAGGAACCACATT-3′ for ATG5,36 siATG5: 5′-GGATGAGATAACTGAAAGG-3′ for Beclin 1,37 siBeclin 1: 5′-CAGTTTGGCACAATCAATA-3′Deptor:5′-GCCATGACAATCGGAAATCTA-3′ for Deptor,38 siDeptor-1: 5′-GCCATGACAATCGGAAATCTA-3′, siDeptor-2: 5′-GCAAGGAAGACATTCACGATT-3′ and for control scrambled siRNA, siControl: 5′-TTCTCCGAACGTGTCACGTTT-3′. All above siRNAs were purchased from GenePharma (Shanghai, China). siRNA against p21 was purchased from Cell Signaling Inc.
FACS analysis
Cells were harvested and fixed in 70% ethanol at −20°C overnight, then stained with propidium iodide (36 μg/ml, Sigma) containing 400 μg/ml RNAase (Roche, Mannhein, Germany) with shaking for 1 h and analyzed by flow cytometry (CyAn ADP, Beckman Coulter, Brea, CA, USA) for cell cycle profile and apoptosis analysis. The activation of caspase 3 was determined by the CaspGLOW fluorescein active caspase-3 staining kit (BioVision, Milpitas, CA, USA) according to the manufacturer's instructions.
SA- β -galactosidase staining
The expression of senescence-associated β-galactosidase (SA-β-gal) in cells was determined by SA-β-gal staining as described.39
Cell proliferation and clonogenic assay
Cells transfected with the indicated siRNAs were split 24 h post transfection, and seeded into 24-well plates with 10 000 cells per well in quadruplicate for cell counting with TaiPan blue staining at indicated time points, or seeded into 96-well plates with 2000, cells per well in triplicate for CCK8 colorimetric assay40 (Dojindo) according to the manufacture's specifications. For clonogenic assay, the split cells were seeded into six-well plates (100 cells per well) and cultured for 10 days. The colonies on the plate were fixed with 4% paraformaldehyde, stained with crystal violet and counted.
Establishment of Huh-7-EGFP-LC3 and Hep G2-EGFP-LC3 stable cell lines
Huh-7 and Hep G2 cells expressing EGFP-LC3 fusion protein were established as described. Briefly, cells were seeded in six-well plates and transfected with 3 μg pEGFP-LC3 plasmid using Lipofectamine 2000 (Invitrogen, Carlsbad, CA, USA). Cells with EGFP fluorescence were selected by MoFlo XDP Cell Sorter (Beckman Coulter) and cultured in complete cell culture medium containing G418 at 200 μg/ml. The autophagy was measured by appearance of punctate vesicle structure and photographed under fluorescence microscope (Leica, Wetzlar, Germany).
AO staining
Quantification of autophagy by AO staining was performed as described.41 Briefly, cells were transfected with siROC1 or control siRNA for 120 h and stained with 1 μM AO in PBS solution at 37°C for 15 min. Cells were washed, re-suspended and subjected to FACS assays. Green (510–530 nm) and red (650 nm) fluorescence emission from cells illuminated with blue (488 nm) excitation light was measured by CyAn ADP (Beckman Coulter).
Tumor formation assay
Five-week-old female athymic nude mice were purchased from the Shanghai Experimental Animal Center (Shanghai, China). LM6 cells transfected with siROC1 or siControl for 24 h, were trypsinized, resuspended in PBS and then subcutaneously injected into the right back for siROC1 or left back for siControl with 106 cells per injection. Tumor size was measured by a vernier caliper weekly and calculated as (length × width2)/2. All procedures were performed in accordance with the National Institutes of Health Guide for the Care and Use of Laboratory Animals.
Statistical analysis
The statistical significance of differences between groups was assessed using the GraphPad Prism5 software, La Jolla, CA, USA. The unpaired two-tailed t-test was used for the comparison of parameters between two groups. We estimated the probabilities of overall survival rate according to the Kaplan–Meier method. For all the tests, three levels of significance (P<0.05, P<0.01 and P<0.001) were used.
Acknowledgments
This work is supported by the National Natural Science Foundation Grant of China (31071204), the National Basic Research Program of China (973 program, 2012CB910302) and Key Project of Shanghai Municipal Health Bureau (2010012) to Lijun Jia, the National Natural Science Foundation Grant of China to Dongqin Yang (81101811) and Jie Liu (91129702,81125001), as well as Postdoctoral Science Foundation of China to Dongqin Yang (KLF101054).
Glossary
- ROC1
regulator of Cullins-1
- CRL
Cullin-RING ligase
- SCF
SKP1-Cullin-F-box proteins
- mTOR
mammalian target of rapamycin
- HCCs
hepatocellular carcinomas
- SA-β-gal
senescence-associated β-galactosidase
- LC3-I
microtubule-associated protein light chain 3-I
- AVO
acidic vesicular organelle
- 3-MA
3-methyladenine
- BafA1
bafilomycin A1
- CQ
Chloroquine
- p-70S6K
phosphorylated 70S6K
- p-4EBP1
phosphorylated 4EBP1
- OIS
oncogene-induced senescence
Footnotes
Supplementary Information accompanies the paper on Cell Death and Differentiation website (http://www.nature.com/cdd)
Edited by D Klionsky
Supplementary Material
References
- Nalepa G, Rolfe M, Harper JW. Drug discovery in the ubiquitin-proteasome system. Nat Rev Drug Discov. 2006;5:596–613. doi: 10.1038/nrd2056. [DOI] [PubMed] [Google Scholar]
- Jia L, Sun Y. SCF E3 Ubiquitin as anticancer targets. Curr Cancer Drug Targets. 2011;11:347–356. doi: 10.2174/156800911794519734. [DOI] [PMC free article] [PubMed] [Google Scholar]
- Soucy TA, Smith PG, Milhollen MA, Berger AJ, Gavin JM, Adhikari S, et al. An inhibitor of NEDD8-activating enzyme as a new approach to treat cancer. Nature. 2009;458:732–736. doi: 10.1038/nature07884. [DOI] [PubMed] [Google Scholar]
- Soucy TA, Dick LR, Smith PG, Milhollen MA, Brownell JE. The NEDD8 Conjugation Pathway and Its Relevance in Cancer Biology and Therapy. Genes Cancer. 2010;1:708–716. doi: 10.1177/1947601910382898. [DOI] [PMC free article] [PubMed] [Google Scholar]
- Soucy TA, Smith PG, Rolfe M. Targeting NEDD8-activated Cullin-RING ligases for the treatment of cancer. Clin Cancer Res. 2009;15:3912–3916. doi: 10.1158/1078-0432.CCR-09-0343. [DOI] [PubMed] [Google Scholar]
- Li T, Robert EI, van Breugel PC, Strubin M, Zheng N. A promiscuous alpha-helical motif anchors viral hijackers and substrate receptors to the CUL4-DDB1 ubiquitin ligase machinery. Nat Struct Mol Biol. 2010;17:105–111. doi: 10.1038/nsmb.1719. [DOI] [PMC free article] [PubMed] [Google Scholar]
- Sun Y, Tan M, Duan H, Swaroop M. SAG/ROC/Rbx/Hrt, a zinc RING finger gene family: molecular cloning, biochemical properties, and biological functions. Antioxid Redox Signal. 2001;3:635–650. doi: 10.1089/15230860152542989. [DOI] [PubMed] [Google Scholar]
- Chen A, Wu K, Fuchs SY, Tan P, Gomez C, Pan ZQ. The conserved RING-H2 finger of ROC1 is required for ubiquitin ligation. J Biol Chem. 2000;275:15432–15439. doi: 10.1074/jbc.M907300199. [DOI] [PubMed] [Google Scholar]
- Zheng N, Schulman BA, Song L, Miller JJ, Jeffrey PD, Wang P, et al. Structure of the Cul1-Rbx1-Skp1-F boxSkp2 SCF ubiquitin ligase complex. Nature. 2002;416:703–709. doi: 10.1038/416703a. [DOI] [PubMed] [Google Scholar]
- Jia L, Bickel JS, Wu J, Morgan MA, Li H, Yang J, et al. RBX1 (RING box protein 1) E3 ubiquitin ligase is required for genomic integrity by modulating DNA replication licensing proteins. J Biol Chem. 2011;286:3379–3386. doi: 10.1074/jbc.M110.188425. [DOI] [PMC free article] [PubMed] [Google Scholar]
- Noureddine MA, Donaldson TD, Thacker SA, Duronio RJ. Drosophila Roc1a encodes a RING-H2 protein with a unique function in processing the Hh signal transducer Ci by the SCF E3 ubiquitin ligase. Dev Cell. 2002;2:757–770. doi: 10.1016/s1534-5807(02)00164-8. [DOI] [PubMed] [Google Scholar]
- Tan M, Davis SW, Saunders TL, Zhu Y, Sun Y. RBX1/ROC1 disruption results in early embryonic lethality due to proliferation failure, partially rescued by simultaneous loss of p27. Proc Nat Acad Sci USA. 2009;106:6203–6208. doi: 10.1073/pnas.0812425106. [DOI] [PMC free article] [PubMed] [Google Scholar]
- Jia L, Soengas MS, Sun Y. ROC1/RBX1 E3 ubiquitin ligase silencing suppresses tumor cell growth via sequential induction of G2-M arrest, apoptosis, and senescence. Cancer Res. 2009;69:4974–4982. doi: 10.1158/0008-5472.CAN-08-4671. [DOI] [PMC free article] [PubMed] [Google Scholar]
- Young AR, Narita M, Ferreira M, Kirschner K, Sadaie M, Darot JF, et al. Autophagy mediates the mitotic senescence transition. Genes Dev. 2009;23:798–803. doi: 10.1101/gad.519709. [DOI] [PMC free article] [PubMed] [Google Scholar]
- Narita M, Young AR. Autophagy facilitates oncogene-induced senescence. Autophagy. 2009;5:1046–1047. doi: 10.4161/auto.5.7.9444. [DOI] [PubMed] [Google Scholar]
- Fang J-H, Zhou H-C, Zeng C, Yang J, Liu Y, Huang X, et al. MicroRNA-29b suppresses tumor angiogenesis, invasion, and metastasis by regulating matrix metalloproteinase 2 expression. Hepatology. 2011;54:1729–1740. doi: 10.1002/hep.24577. [DOI] [PubMed] [Google Scholar]
- Li Y, Tian B, Yang J, Zhao L, Wu X, Ye SL, et al. Stepwise metastatic human hepatocellular carcinoma cell model system with multiple metastatic potentials established through consecutive in vivo selection and studies on metastatic characteristics. J Cancer Res Clin Oncol. 2004;130:460–468. doi: 10.1007/s00432-004-0564-9. [DOI] [PMC free article] [PubMed] [Google Scholar]
- Schmitt CA, Fridman JS, Yang M, Lee S, Baranov E, Hoffman RM, et al. A senescence program controlled by p53 and p16INK4a contributes to the outcome of cancer therapy. Cell. 2002;109:335–346. doi: 10.1016/s0092-8674(02)00734-1. [DOI] [PubMed] [Google Scholar]
- Mizushima N, Yoshimori T, Levine B. Methods in mammalian autophagy research. Cell. 2010;140:313–326. doi: 10.1016/j.cell.2010.01.028. [DOI] [PMC free article] [PubMed] [Google Scholar]
- Klionsky DJ, Cuervo AM, Seglen PO. Methods for monitoring autophagy from yeast to human. Autophagy. 2007;3:181–206. doi: 10.4161/auto.3678. [DOI] [PubMed] [Google Scholar]
- Klionsky DJ, Elazar Z, Seglen PO, Rubinsztein DC. Does bafilomycin A1 block the fusion of autophagosomes with lysosomes. Autophagy. 2008;4:849–850. doi: 10.4161/auto.6845. [DOI] [PubMed] [Google Scholar]
- Zhao Y, Xiong X, Sun Y. DEPTOR an mTOR inhibitor, is a physiological substrate of SCF(betaTrCP) E3 ubiquitin ligase and regulates survival and autophagy. Mol Cell. 2011;44:304–316. doi: 10.1016/j.molcel.2011.08.029. [DOI] [PMC free article] [PubMed] [Google Scholar]
- Duan S, Skaar JR, Kuchay S, Toschi A, Kanarek N, Ben-Neriah Y, et al. mTOR generates an auto-amplification loop by triggering the betaTrCP- and CK1alpha-dependent degradation of DEPTOR. Mol Cell. 2011;44:317–324. doi: 10.1016/j.molcel.2011.09.005. [DOI] [PMC free article] [PubMed] [Google Scholar]
- Gao D, Inuzuka H, Tan MK, Fukushima H, Locasale JW, Liu P, et al. mTOR drives its own activation via SCF(betaTrCP)-dependent degradation of the mTOR inhibitor DEPTOR. Mol Cell. 2011;44:290–303. doi: 10.1016/j.molcel.2011.08.030. [DOI] [PMC free article] [PubMed] [Google Scholar]
- Campisi J, d'Adda di Fagagna F. Cellular senescence: when bad things happen to good cells. Nat Rev Mol Cell Biol. 2007;8:729–740. doi: 10.1038/nrm2233. [DOI] [PubMed] [Google Scholar]
- Jia L, Li H, Sun Y. Induction of p21-dependent senescence by an NAE inhibitor, MLN4924, as a mechanism of growth suppression. Neoplasia. 2011;13:561–569. doi: 10.1593/neo.11420. [DOI] [PMC free article] [PubMed] [Google Scholar]
- Lin JJ, Milhollen MA, Smith PG, Narayanan U, Dutta A. NEDD8-targeting drug MLN4924 elicits DNA Rereplication by stabilizing Cdt1 in S phase, triggering checkpoint activation, apoptosis, and senescence in cancer cells. Cancer Res. 2010;70:10310–10320. doi: 10.1158/0008-5472.CAN-10-2062. [DOI] [PMC free article] [PubMed] [Google Scholar]
- Vollmer CM, Ribas A, Butterfield LH, Dissette VB, Andrews KJ, Eilber FC, et al. p53 selective and nonselective replication of an E1B-deleted adenovirus in hepatocellular carcinoma. Cancer Res. 1999;59:4369–4374. [PubMed] [Google Scholar]
- Huang LR, Hsu HC. Cloning and expression of CD24 gene in human hepatocellular carcinoma: a potential early tumor marker gene correlates with p53 mutation and tumor differentiation. Cancer Res. 1995;55:4717–4721. [PubMed] [Google Scholar]
- Luo Z, Yu G, Lee HW, Li L, Wang L, Yang D, et al. The Nedd8-activating enzyme inhibitor MLN4924 induces autophagy and apoptosis to suppress liver cancer cell growth. Cancer Res. 2012;72:3360–3371. doi: 10.1158/0008-5472.CAN-12-0388. [DOI] [PubMed] [Google Scholar]
- Zhao Y, Xiong X, Jia L, Sun Y.Targeting Cullin-RING ligases by MLN4924 induces autophagy via modulating the HIF1-REDD1-TSC1-MTORC1-DEPTOR axis Cell Death Disease 2012(in press) doi: 10.1038/cddis.2012.125 [DOI] [PMC free article] [PubMed]
- Kang HT, Lee KB, Kim SY, Choi HR, Park SC. Autophagy impairment induces premature senescence in primary human fibroblasts. PloS One. 2011;6:e23367. doi: 10.1371/journal.pone.0023367. [DOI] [PMC free article] [PubMed] [Google Scholar]
- Kroemer G, Levine B. Autophagic cell death: the story of a misnomer. Nat Rev Mol Cell Biol. 2008;9:1004–1010. doi: 10.1038/nrm2527. [DOI] [PMC free article] [PubMed] [Google Scholar]
- Mizushima N, Komatsu M. Autophagy: renovation of cells and tissues. Cell. 2011;147:728–741. doi: 10.1016/j.cell.2011.10.026. [DOI] [PubMed] [Google Scholar]
- Schlabach MR, Luo J, Solimini NL, Hu G, Xu Q, Li MZ, et al. Cancer proliferation gene discovery through functional genomics. Science. 2008;319:620–624. doi: 10.1126/science.1149200. [DOI] [PMC free article] [PubMed] [Google Scholar]
- Yee KS, Wilkinson S, James J, Ryan KM, Vousden KH. PUMA- and Bax-induced autophagy contributes to apoptosis. Cell Death Differ. 2009;16:1135–1145. doi: 10.1038/cdd.2009.28. [DOI] [PMC free article] [PubMed] [Google Scholar]
- Bock BC, Tagscherer KE, Fassl A, Kramer A, Oehme I, Zentgraf HW, et al. The PEA-15 protein regulates autophagy via activation of JNK. J Biol Chem. 2010;285:21644–21654. doi: 10.1074/jbc.M109.096628. [DOI] [PMC free article] [PubMed] [Google Scholar]
- Peterson TR, Laplante M, Thoreen CC, Sancak Y, Kang SA, Kuehl WM, et al. DEPTOR is an mTOR inhibitor frequently overexpressed in multiple myeloma cells and required for their survival. Cell. 2009;137:873–886. doi: 10.1016/j.cell.2009.03.046. [DOI] [PMC free article] [PubMed] [Google Scholar]
- Itahana K, Campisi J, Dimri GP. Methods to detect biomarkers of cellular senescence: the senescence-associated beta-galactosidase assay. Methods Mol Biol. 2007;371:21–31. doi: 10.1007/978-1-59745-361-5_3. [DOI] [PubMed] [Google Scholar]
- Wang C, Sheng G, Lu J, Xie L, Bai S, Wang Y, et al. Effect of RNAi-induced down regulation of nuclear factor kappa-B p65 on acute monocytic leukemia THP-1 cells in vitro and vivo. Mol Cell Biochem. 2012;359:125–133. doi: 10.1007/s11010-011-1006-z. [DOI] [PubMed] [Google Scholar]
- Ullen A, Farnebo M, Thyrell L, Mahmoudi S, Kharaziha P, Lennartsson L, et al. Sorafenib induces apoptosis and autophagy in prostate cancer cells in vitro. Int J Oncol. 2010;37:15–20. doi: 10.3892/ijo_00000648. [DOI] [PubMed] [Google Scholar]
Associated Data
This section collects any data citations, data availability statements, or supplementary materials included in this article.


