Abstract
Signal transducer and activator of transcription 3 (STAT3) is involved in cytokine- and nutrient-induced insulin resistance. The role of STAT3 in the development of skeletal muscle insulin resistance and type 2 diabetes (T2D) pathogenesis is incompletely defined. We tested the hypothesis that STAT3 signaling contributes to skeletal muscle insulin resistance in T2D. Protein abundance and phosphorylation of STAT3 signaling molecules were determined in skeletal muscle biopsy specimens from BMI- and age-matched overweight individuals with normal glucose tolerant (NGT) and T2D patients. The direct role of STAT3 in the development of lipid-induced skeletal muscle insulin resistance was determined using small interfering (si)RNA. Phosphorylated STAT3, phosphorylated Janus kinase 2 (JAK2), and suppressor of cytokine signaling 3 (SOCS3) protein abundance was increased in skeletal muscle from T2D patients. STAT3 phosphorylation positively correlated with free fatty acid level and measures of insulin sensitivity in NGT but not T2D patients. Palmitate exposure led to a constitutive phosphorylation of STAT3, increased protein abundance of SOCS3, and development of insulin resistance in L6 myotubes. These effects were prevented by siRNA-mediated STAT3 silencing. In summary, STAT3 is constitutively phosphorylated in skeletal muscle from T2D patients. STAT3 gene silencing prevents lipid-induced insulin resistance in cultured myotubes. Collectively, our results implicate excessive STAT3 signaling in the development of skeletal muscle insulin resistance in T2D.
The link between obesity and insulin resistance in type 2 diabetes (T2D) pathogenesis is increasingly appreciated (1). For instance, aberrant crosstalk between metabolically active organs in obese individuals can cause peripheral insulin resistance and increase T2D risk. In addition, obesity-induced elevations in circulating triglyceride and free fatty acid (FFA) levels are implicated in the development of skeletal muscle insulin resistance (1). Several factors secreted from adipose tissue (so-called adipocytokines) can also influence insulin action in skeletal muscle (2). Candidate adipokines, including tumor necrosis factor-α (TNF-α), interleukin-6 (IL-6), and adiponectin, orchestrate interorgan communication between adipose tissue and skeletal muscle and influence insulin sensitivity (3). Signals emanating from the cytokine-responsive Janus kinase (JAK)/signal transducer and activator of transcription (STAT) pathway are involved in adipokine-mediated crosstalk between adipocytes and liver or skeletal muscle (4–6). However, the role of STAT3 in the development of skeletal muscle insulin resistance in humans is inconclusive (7–9).
STAT3, a transcription factor expressed in multiple metabolic tissues, is activated through phosphorylation of Tyr705 and Tyr727 in response to cytokines, growth factors, and nutrients. STAT3 signaling pathways play a role in peripheral and hepatic insulin sensitivity. In liver hepatocarcinoma cell lines, STAT3 knockdown prevents amino acid–induced insulin resistance (10). Activation of STAT3 in adipocytes is linked to growth hormone–induced insulin resistance in rats chronically treated with arginine (11). In human smooth muscle cells, short-term palmitate exposure upregulates STAT3 phosphorylation (p-STAT3), whereas long-term exposure downregulates p-STAT3 and concomitantly increases suppressor of cytokine signaling 3 (SOCS3) protein abundance, implying a negative feedback in the regulation of this signaling cascade (12). Collectively, these studies provide evidence to suggest circulating factors and hormones signal through STAT3 to regulate insulin signaling in a variety of tissues. Thus, excessive STAT3 signaling may impose negative feedback regulation on canonical insulin-signaling pathways controlling metabolism in T2D.
The role of skeletal muscle STAT3 in the pathogenesis of T2D is incompletely defined. STAT3 has been implicated in the development of IL-6–induced insulin resistance in cultured skeletal myotubes derived from people with impaired glucose tolerance (IGT) (8). Whether these findings extend to T2D is unclear. SOCS3 links the JAK/STAT pathway to insulin signaling and, consequently, may play a role in the development of insulin resistance in obesity and T2D. SOCS3 protein is increased in skeletal muscle from severely obese or T2D patients compared with lean people with normal glucose tolerance (NGT) (13). Because activation of STAT3 regulates SOCS3 mRNA expression (12,14) in a time-dependent manner (15), constitutive STAT3 phosphorylation may be linked to the development of skeletal muscle insulin resistance in T2D.
Here we tested the hypothesis that STAT3 signaling contributes to the development of skeletal muscle insulin resistance in T2D. We measured levels of p-STAT3 and SOCS3 protein in skeletal muscle from BMI- and age-matched people with NGT or T2D. We also assessed the influence of circulating factors associated with peripheral insulin resistance on STAT3 and SOCS3 signaling. To determine the mechanisms by which STAT3 impairs insulin action on glucose metabolism in skeletal muscle, we used small interfering (si)RNA gene silencing. We provide clinical and experimental evidence implicating excessive STAT3 signaling in the development of skeletal muscle insulin resistance in T2D.
RESEARCH DESIGN AND METHODS
The study was approved by the Karolinska Institutet ethics committee. Informed, written consent was obtained from all volunteers.
Subjects.
Twenty overweight but otherwise healthy participants with NGT and 20 T2D patients were selected from a primary health care clinic. The NGT and T2D participants were matched for age and BMI. Individuals taking insulin or with symptomatic coronary heart disease were excluded. T2D patients were taking the following medications: metformin (n = 8), sulfonylurea (glibenclamide, glipizide, glimepiride [n = 2]), β-blockers (atenolol [n = 9] and metoprolol [n = 3]), ACE/angiotensin II inhibitors (n = 3), calcium channel blockers (n = 2), diuretics (n = 2), and lipid-lowering therapy (n = 11). Venous blood for standard clinical chemistry analysis (Table 1) and vastus lateralis skeletal muscle biopsy specimens were obtained from the participants after an overnight fast, as described earlier (16).
TABLE 1.
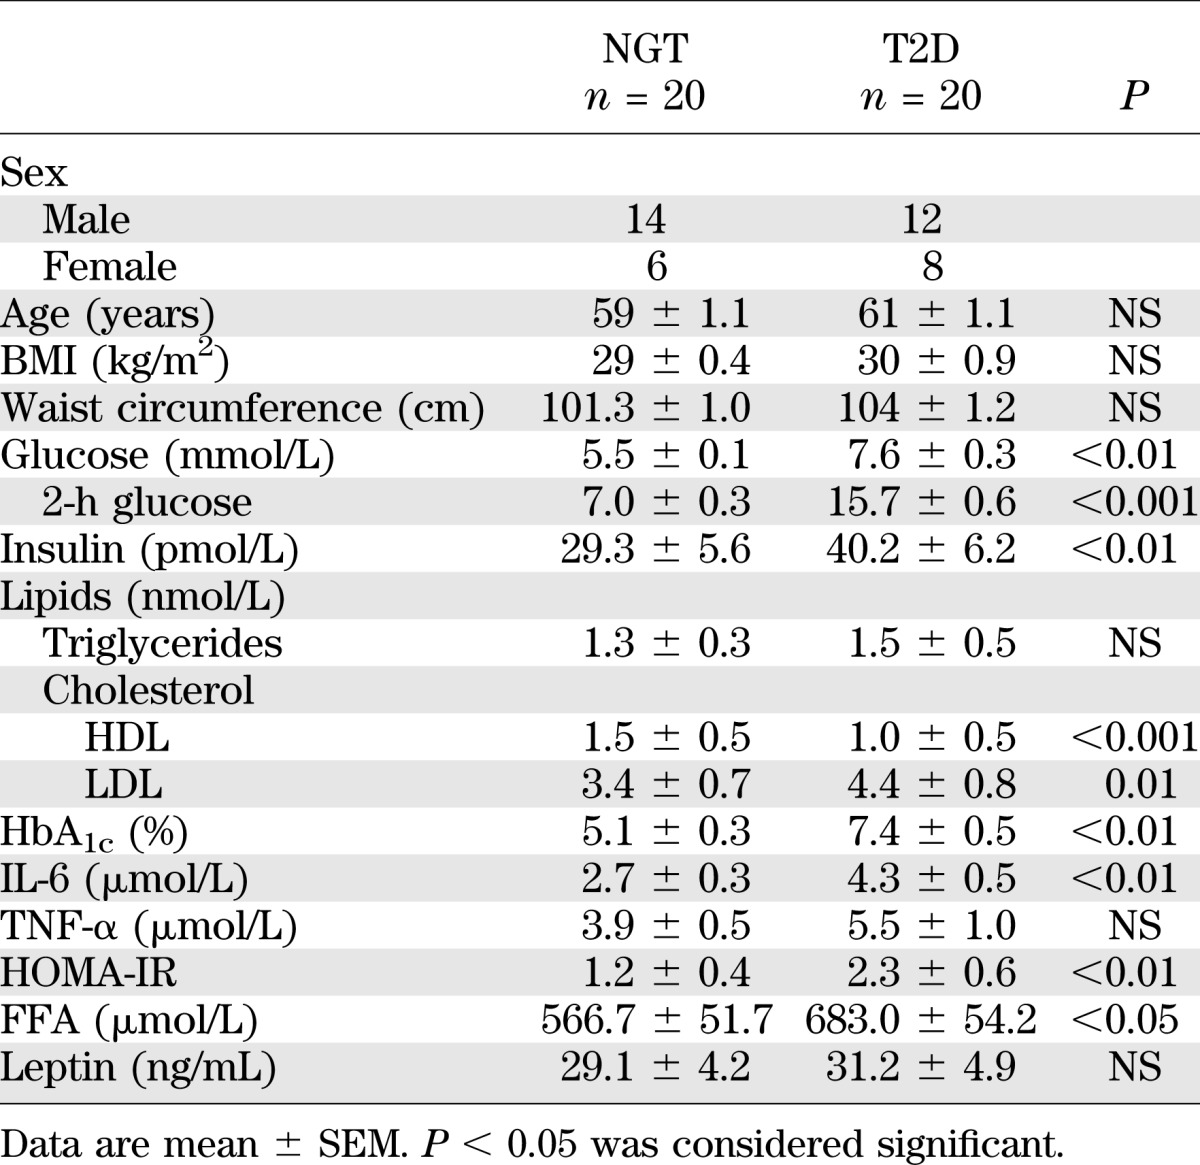
Clinical characteristics and anthropometric measurements of the study participants
Plasma FFA analysis.
Circulating FFA was measured in plasma using the plasma Human Free Fatty Acids detection kit (Zenbio), according to the manufacturer’s instructions. Samples were diluted 10 times with the dilution buffer before dispersal into a 96-well plate in duplicate. A standard curve using standards of known concentration was used to calculate the concentration of FFA within the samples. All measurements fell within the acceptable range of the standard curve. Plasma concentration of IL-6 and TNF-α was measured using a Novex multiplex Luminex assay for quantitation and detection of cytokines (Life Technologies, Carlsbad, CA).
Insulin resistance.
The homeostatic model assessment [fasting plasma insulin (µU/mL) × fasting plasma glucose (mmol/L)/22.5] was used to estimate insulin resistance (HOMA-IR). Plasma insulin was measured using a Novex multiplex Luminex assay (Life Technologies), and plasma glucose was determined by the Glucose Oxidase Method, using a Beckman Glucose Analyzer.
Gene expression studies.
SOCS3 mRNA expression was measured in vastus lateralis skeletal muscle and L6 myotubes using quantitative RT-PCR (ABI PRISM 7000 Sequence Detection System, Applied Biosystems). Total RNA was purified from skeletal muscle specimens using Trizol reagent (Invitrogen, Carlsbad, CA) and from L6 myotubes using RNeasy Mini Kit (Invitrogen). Purified RNA was treated with DNase using a DNA-free kit (Ambion), and cDNA synthesis was performed with SuperScript First Strand Synthesis system (Invitrogen). A SYBR Green–based gene expression assay was used to assess SOCS3 mRNA (Origene). All samples were assayed in duplicate, and values were compared against the housekeeping genes β-actin and 18S for internal control. Standard curve and relative expression methods were used to quantify mRNA expression (Applied Biosystems).
Cell culture reagents.
Palmitic acid and general laboratory reagents were purchased from Sigma (St. Louis, MO). Minimum essential media-α (MEM-α), FBS, penicillin, streptomycin, and Fungizone were purchased from GibcoBRL (Invitrogen, Sweden).
L6 cell culture.
Rat L6 muscle cells (from Professor Amira Klip, Hospital for Sick Children, Toronto, ON, Canada) were grown in MEM-α media (10% FBS, 1% penicillin/streptomycin, and 1% Fungizone) until confluent and then cultured with differentiating media (MEM-α with 2% FBS, 1% penicillin/streptomycin, and 1% Fungizone) for 4 days.
siRNA transfection and fatty acid treatment.
siRNA oligos for STAT3, SOCS3, or scrambled sequences (OnTargetplus) were purchased from Dharmacon (Chicago, IL). At 70% confluence and on day 3 of differentiation, myotubes were cultured in antibiotic-free MEM-α media and transfected with the specific siRNA (1 μg/mL) as indicated in the Fig. legends by calcium phosphate (Cell Phect Transfection kit, Amersham Pharmacia). On day 6 of differentiation, transfected myotubes were exposed to BSA (control) or BSA-conjugated saturated fatty acid (0.25 mmol/L palmitate) for 24 h. During the last 4 h of the incubation procedure, cells were cultured in serum-free media in the presence or absence of palmitate, as specified in the Fig. legends. Thereafter, myotubes were incubated in the presence or absence of 60 or 120 nmol/L insulin for determination of glucose incorporation into glycogen and protein phosphorylation. For time-course experiments, differentiated L6 myotubes were exposed to BSA-conjugated saturated fatty acids (0.25 mmol/L palmitate) or mouse recombinant IL-6 (20 ng/mL) for 0, 2, 6, 12, 24, or 36 h. A vehicle containing BSA without palmitate was used as a control. Cells were then harvested and lysates were prepared for Western blot analysis.
Glycogen synthesis.
Glucose incorporation to glycogen was determined as described (16). Myotubes were incubated in the absence or presence of 60 or 120 nmol/L insulin for 30 min and thereafter for an additional 90 min in Dulbecco’s modified Eagle’s medium (1 g glucose/L) containing insulin and d-glucose [U-14C] (1 μCi/mL; Amersham, Uppsala, Sweden). Protein concentration was determined using the Bradford method (Bio-Rad, Richmond, CA). Results are reported as nmol glucose × mg protein−1 × h−1.
Western blot analysis.
Aliquots of cell lysates were mixed with 4× Laemmli buffer. Proteins were resolved by SDS-PAGE, transferred to nitrocellulose membrane, and incubated with antibodies that detect phosphorylated or total protein level. Signaling parameters were assessed using antibodies against p-STAT3 (Tyr705), STAT3, p-JAK (Tyr1007/1008), SOCS3, p-Akt (Ser473), pan-Akt, p-Akt substrate of 160 kDa (p-AS160), p-mammalian target of rapamycin (mTOR; Ser2448) and glyceraldehyde 3-phosphate dehydrogenase (GAPDH; Cell Signaling Technology, Beverly, MA). Proteins were visualized by enhanced chemiluminescence and quantified by densitometry.
Statistics.
Results are presented as mean ± SEM. Differences between groups were determined by the Student t test. The Pearson correlation test was used to calculate the relationship between circulating FFAs and other clinical parameters. P < 0.05 was considered significant. Normality was tested and assumed before performing the statistical test.
RESULTS
Clinical and metabolic characteristics of the study participants.
The NGT and T2D participants were matched for BMI and age (Table 1). FFA, plasma glucose (fasting and 2 h), HbA1c, HOMA-IR, IL-6, and LDL-cholesterol levels were higher in T2D patients compared with NGT subjects (Table 1). Circulating TNF-α and leptin levels were similar between the two groups. The HDL-cholesterol level was lower in T2D patients (Table 1).
Protein phosphorylation and gene expression.
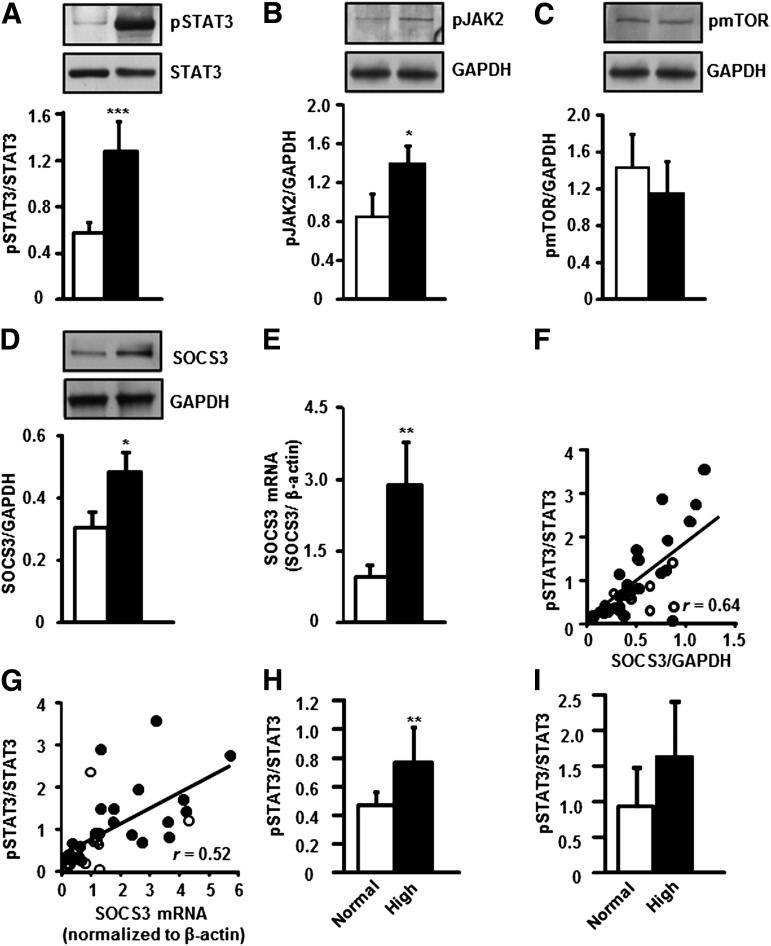
Skeletal muscle biopsy specimens were obtained from individuals with NGT or T2D. p-STAT3 (Tyr705) was increased 2.0-fold in T2D patients (Fig. 1A). Protein phosphorylation of JAK2, an upstream regulator of STAT3, was also increased (1.5-fold) in skeletal muscle from T2D patients (Fig. 1B). Conversely, phosphorylation of mTOR (Fig. 1C), another upstream regulator of STAT3, was unaltered between participants with T2D or NGT. Skeletal muscle SOCS3 protein (Fig. 1D) and mRNA (Fig. 1E) levels were increased 1.5- and 3.0-fold in T2D patients, respectively. p-STAT3 abundance was positively correlated with SOCS3 protein abundance (Fig. 1F) and mRNA expression (Fig. 1G) in skeletal muscle from individuals with T2D and NGT.
FIG. 1.
Protein phosphorylation and gene expression in skeletal muscle from NGT or T2D participants. Phosphorylation of STAT3 Tyr985 (A) JAK2 (B) and mTOR (C). SOCS3 total protein abundance (D) and mRNA expression (E) in skeletal muscle biopsy specimens. NGT (□) and T2D (■), n = 20 subjects. Results are mean ± SEM. ***P < 0.001, **P < 0.01, and *P < 0.05 vs. NGT, respectively. Correlation between STAT3 phosphorylation and SOCS3 protein abundance (F) and mRNA expression (G) in skeletal muscle specimens from participants with NGT (○) or T2D (●). P < 0.001, n = 40. NGT and T2D cohorts were separately divided into groups based on normal FFA (<600 μmol/L, □) or high FFA (>600 µmol/L, ■) level. Skeletal muscle p-STAT3 protein abundance is reported in NGT subjects (H) and T2D patients (I). Results are mean ± SEM. **P < 0.01 vs. normal FFA level, n = 20.
Relationship between clinical and metabolic parameters and p-STAT3 protein.
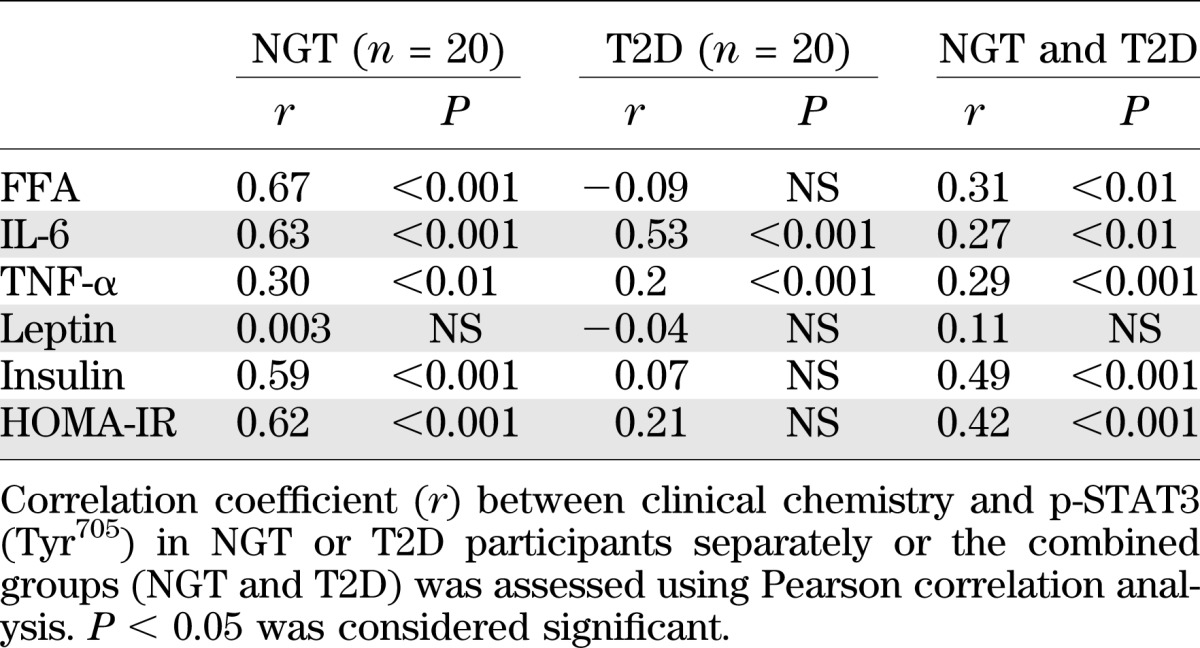
Owing to the high degree of variability in the level of p-STAT3, a regression analysis was performed to identify factors correlating with p-STAT3. This analysis was performed for the NGT and T2D participants separately, as well as for combined groups, and was adjusted for sex. FFA, IL-6, TNF-α, and fasting insulin levels, as well as HOMA-IR, showed a weak but positive correlation with p-STAT3 in the combined group of NGT and T2D participants (Table 2). IL-6 and TNF-α levels were positively correlated with p-STAT3 in the NGT and T2D participants, whereas FFA concentration was correlated with p-STAT3 only in NGT participants (Table 2). To further examine the relationship between FFA concentration and p-STAT3, the NGT and T2D participants were further divided into subgroups according to whether they presented with a normal or elevated FFA level. p-STAT3 abundance was increased in NGT participants presenting with an elevated FFA (>600 µmol/L) level (Fig. 1H). A nonsignificant tendency toward increased p-STAT3 abundance was noted in T2D patients with an elevated FFA level (Fig. 1I).
TABLE 2.
Correlation analysis between clinical chemistry and STAT3 phosphorylation
Relationship between FFA level, p-STAT3 signaling, and insulin sensitivity.
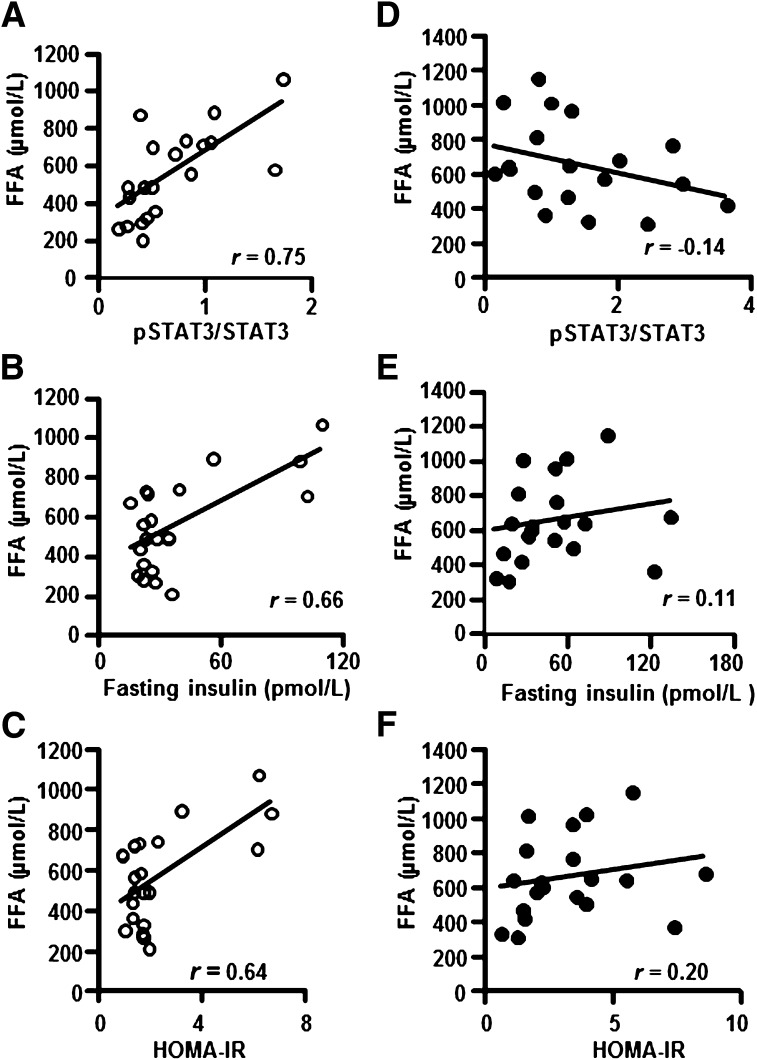
To further characterize the relationship between FFA level, p-STAT3, and insulin sensitivity, a correlation analysis between these parameters was performed in NGT or T2D participants. FFA level was positively correlated with p-STAT3 (Fig. 2A), fasting insulin (Fig. 2B), and HOMA-IR (Fig. 2C) in NGT but not in T2D (Fig. 2D–F) participants.
FIG. 2.
Correlation analysis between FFA and skeletal muscle p-STAT3 protein abundance, insulin, and HOMA-IR in NGT (○) or T2D (●) participants. Correlation between circulating FFA and skeletal muscle p-STAT3 (A), circulating FFA and insulin level (B), and HOMA-IR (C) in NGT participants. P < 0.001, n = 20. Correlation between FFA and circulating FFA and skeletal muscle p-STAT3 (D), circulating FFA and insulin level (E), and circulating FFA and HOMA-IR (F) in T2D patients. P = NS, n = 20.
Effect of palmitate exposure on p-STAT3 level and insulin action in L6 myotubes.
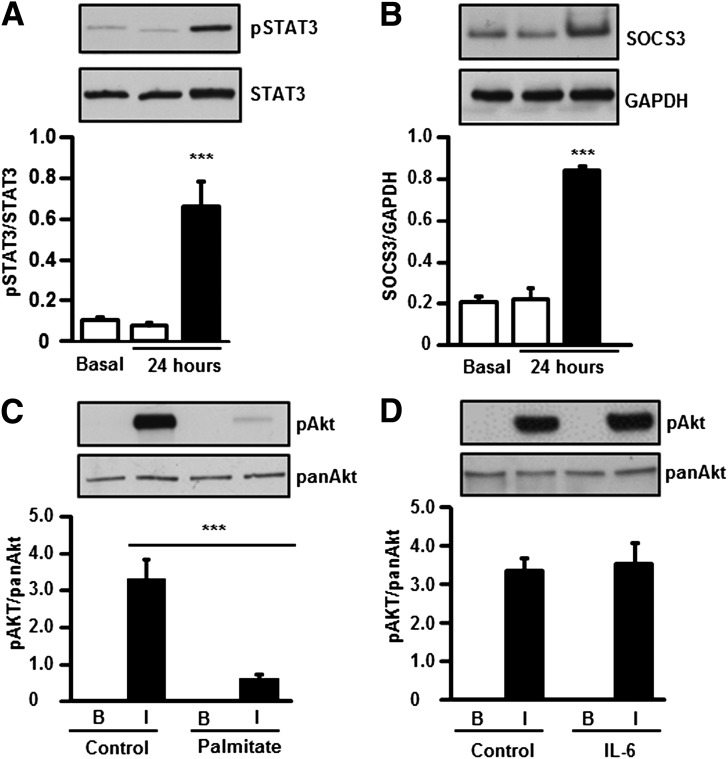
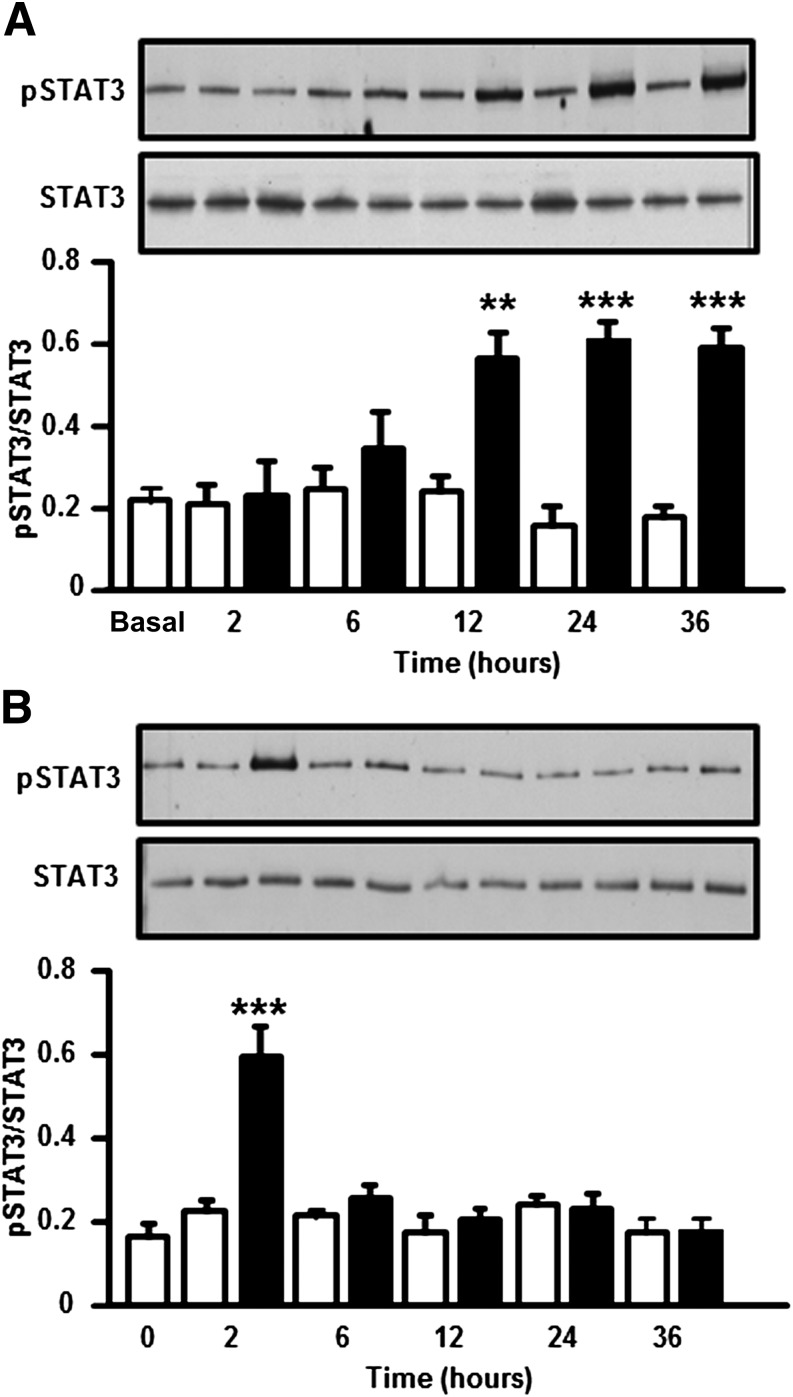
L6 myotubes were treated for 24 h with palmitate, a saturated fatty acid that accounts for >70% of circulating FFAs in insulin-resistant conditions (7). Palmitate exposure increased p-STAT3 level (Fig. 3A), coincident with an induction of SOCS3 protein (Fig. 3B) and a reduction in insulin-stimulated p-Akt (Fig. 3C). In contrast, insulin-stimulated p-Akt was unaltered after a 24-h exposure of myotubes to IL-6 (Fig. 3D). A time-course experiment was performed in which L6 myotubes were exposed to palmitate (0.25 mmol/L) or IL-6 (20 ng/mL) and p-STAT3 was assessed, as described in Fig. 4. We observed a late but persistent phosphorylation of STAT3 in response to palmitate (Fig. 4A) and an early but transient phosphorylation of STAT3 in response to IL-6 (Fig. 4B).
FIG. 3.
Effect of 24-h palmitate exposure on L6 myotubes. L6 myotubes were incubated in the absence (□, control) or presence (■) of palmitate (0.25 mmol/L) for 24 h, and p-STAT3 (A) and SOCS3 (B) protein abundance was measured. Basal refers to control cells in the absence of BSA added as vehicle control and is shown for reference in A and B. ***P < 0.0001 vs. 24-h control, n = 6. p-Akt was measured in L6 myotubes incubated for 24 h in the absence or in the presence of palmitate (0.25 mmol/L) (C) or mouse recombinant IL-6 (20 ng/mL) (D), followed by addition or omission of insulin (60 nmol/L) for 20 min. ***P < 0.0001 vs. control insulin-stimulated, n = 6. Results are mean ± SEM.
FIG. 4.
Time-dependent effect of palmitate or IL-6 on p-STAT3 in L6 myotubes. Myotubes were incubated in the absence (□; control) or presence (■) of palmitate (0.25 mmol/L) (A) or IL-6 (20 ng/mL) (B), and p-STAT3 was measured at the indicated time points. Results are mean ± SEM, n = 6. **P < 0.001, ***P < 0.001 vs. control.
SiRNA-based gene silencing of STAT3 improves insulin action in L6 myotubes.
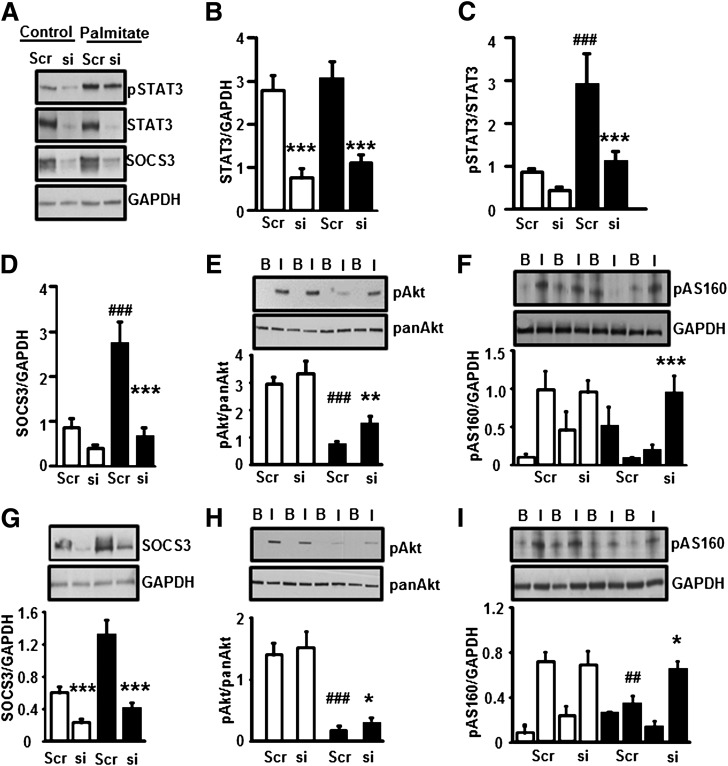
We next determined the role of STAT3 in the development of skeletal muscle insulin resistance using siRNA against STAT3. L6 myotubes were transfected with a scramble sequence or a STAT3-specific siRNA. Myotubes were then incubated for 24 h in the absence or presence of palmitate. STAT3 protein abundance was reduced 70% in control or palmitate-treated cells after transfection with siRNA against STAT3 (Fig. 5A and B). This was accompanied by a reduction in p-STAT3 (Fig. 5A and C) and SOCS3 protein (Fig. 5A and D). The palmitate-induced increase in SOCS3 abundance was abolished by STAT3 silencing (Fig. 5D). Palmitate-induced insulin resistance on p-Akt (Fig. 5E) and p-AS160 (Fig. 5F) was partially prevented by STAT3 silencing. To explore the role of the STAT3 target SOCS3 on insulin action, L6 myotubes were transfected with a SOCS3-specific siRNA or a scrambled sequence. Myotubes were then incubated for 24 h in the absence or presence of palmitate. SOCS3 protein abundance was reduced 75% in control or palmitate-treated cells after transfection with siRNA against SOCS3 (Fig. 5G). siRNA-mediated silencing of SOCS3 slightly prevented palmitate-induced insulin resistance on p-Akt (Fig. 5H) and partially rescued insulin action on p-AS160 (Fig. 5I).
FIG. 5.
Effect of STAT3 silencing on protein phosphorylation. Myotubes were transfected with siRNA against a scrambled sequence or STAT3. Transfected myotubes were incubated in the absence (control) or presence of palmitate (0.25 mmol/L) for 24 h. A: Representative immunoblots show the effect of palmitate and STAT3-specific siRNA on p-STAT3, STAT3, SOCS3, and GAPDH protein abundance. B: STAT3 was reduced 70% by siRNA STAT3 silencing. Phosphorylation of STAT3 (C) and expression of SOCS3 proteins (D) were measured. p-Akt (E) and p-AS160 (F) were measured in myotubes after incubation in the absence or presence of insulin (60 nmol/L). □, control myotubes; ■, palmitate-treated myotubes. ***P < 0.001, **P < 0.01 vs. siRNA; ###P < 0.001 vs. control scrambled, n = 6. Myotubes were transfected with siRNA against a scrambled sequence or SOCS3. Transfected myotubes were incubated in the absence (control) or presence of palmitate (0.25 mmol/L) for 24-h. G: SOCS3 was reduced 75% by siRNA SOCS3 silencing. Phosphorylation of p-Akt (H) and p-AS160 (I) was measured in myotubes after 20 min incubation in the absence or presence of insulin (60 nmol/L). □, control myotubes; ■, palmitate-treated myotubes. ***P < 0.001, *P < 0.05 vs. siRNA; ###P < 0.001, ##P < 0.01 vs. control scrambled, n = 6.
SiRNA-based gene silencing of STAT3 improves glycogen synthesis in L6 myotubes.
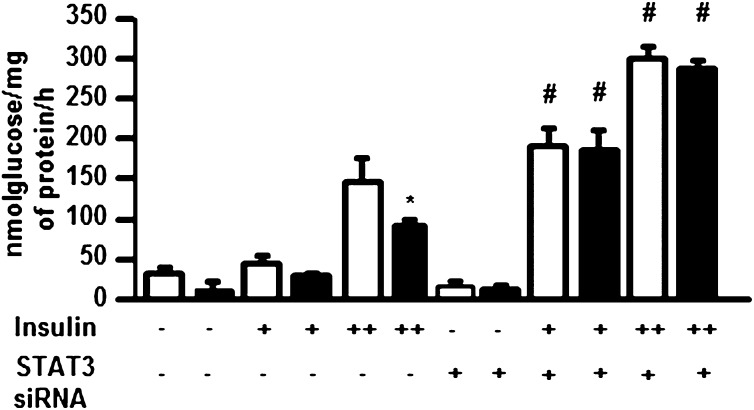
Glucose incorporation into glycogen was measured in the absence (basal) or presence of insulin. siRNA-mediated silencing of STAT3 increased insulin-stimulated glucose incorporation to glycogen 50% (Fig. 6) and prevented palmitate-induced insulin resistance in L6 myotubes. Furthermore, STAT3-silencing prevented palmitate-induced insulin resistance on glucose incorporation in L6 myotubes.
FIG. 6.
Effect of STAT3 silencing on glycogen synthesis in L6 myotubes. L6 myotubes were transfected with siRNA against a scrambled (−) sequence or STAT3 (+). Transfected myotubes were incubated for 24 h in the absence (□; control) or presence (■) of palmitate (0.25 mmol/L). Glucose incorporation to glycogen was assessed in control or palmitate-exposed myotubes the absence (−) or presence of insulin at 60 (+) or 120 nmol/L (++). *P < 0.01 control vs. palmitate treatment; #P < 0.01 scramble vs. siRNA, n = 6.
DISCUSSION
Elevated levels of circulating lipids are a clinical feature of T2D and are implicated in the development of peripheral insulin resistance (17,18). IGT and T2D patients display numerous disturbances in FFA and lipid metabolism. Insulin-mediated FFA suppression after an oral glucose load is impaired in IGT or T2D (19). Moreover, insulin-mediated suppression of plasma FFA is impaired in T2D, coupled with impairments in plasma FFA turnover, FFA oxidation, and nonoxidative FFA disposal (20). Here we used siRNA to investigate the mechanisms involved in the crosstalk between circulating lipids and STAT3 in the development of skeletal muscle insulin resistance. We provide evidence that p-STAT3 abundance is increased in skeletal muscle from overweight T2D patients compared with age- and BMI-matched overweight NGT individuals. Because STAT3 is involved in adipogenesis (21), obesity may directly influence STAT3 signaling. However, our findings are consistent with increased skeletal muscle p-STAT3 abundance in nonobese people with IGT (8). Thus, aberrant skeletal muscle STAT3 signaling appears to be an early marker of insulin resistance that precedes clinical diagnosis of T2D.
Acute elevations in FFA inhibit skeletal muscle glucose uptake and metabolism in healthy people (22). Here we observed that the plasma FFA level was positively correlated with skeletal muscle p-STAT3 abundance and inversely correlated with measures of insulin sensitivity in NGT individuals. In the T2D cohort, however, this relationship between FFA and p-STAT3 was not observed, despite the finding of elevated FFA levels and insulin resistance. We found that the plasma FFA level accounted for greatest variation in skeletal muscle p-STAT3 abundance, highlighting a relationship between circulating FFAs, STAT3 phosphorylation, and measures of insulin sensitivity. Several nutrients and circulating metabolites have been linked to STAT3 activation in different tissues (13,14,23,24). Given the clinical evidence that elevated FFA levels are a biomarker for the conversion from IGT to T2D (25,26), interventions that lower FFA may prevent excessive p-STAT3 and maintain appropriate insulin-signaling responses in skeletal muscle to control glucose and lipid metabolism. Furthermore, oral medications used to treat diabetes may directly or indirectly prevent excessive p-STAT3 signaling. Metformin and AMP-activated protein kinase (AMPK) activation represses inflammatory responses by downregulating p-STAT3 and SOCS3 production in cultured hepatocytes and mouse liver (27,28). Although several of the T2D patients in this study were treated with metformin, no obvious difference in p-STAT3 abundance was noted. Because metformin mainly acts by decreasing endogenous glucose production, rather than by improving peripheral insulin sensitivity (29), any effect of this drug in skeletal muscle is likely to be secondary to improvements in hepatic insulin sensitivity. Nevertheless, further studies are warranted to assess the direct effect of metformin treatment on skeletal muscle p-STAT3.
SOCS3, a key player linking the JAK/STAT pathway to insulin signaling, is implicated in the development of insulin resistance in obesity and T2D (30). SOCS3 protein and mRNA are increased in skeletal muscle from severely obese or T2D patients compared with lean people with NGT (13). Consistently, we found an upregulation of SOCS3 protein abundance and mRNA expression in skeletal muscle from T2D patients, supporting a link between aberrant signal transduction and reduced insulin sensitivity. We also observed a positive association between p-STAT3 and SOCS3 protein and mRNA levels in NGT and T2D patients, suggesting a physiological link between phosphorylation of STAT3 and SOCS3 induction. In liver, STAT3 phosphorylation upregulates SOCS3 protein and subsequently causes insulin resistance (10,23). Despite a strong association between FFA and p-STAT3 protein abundance, only a weak correlation was observed between FFA and skeletal muscle SOCS3 protein or mRNA in the NGT or T2D groups analyzed separately (data not shown), reinforcing the complex physiological interaction between circulating metabolites and signaling parameters.
Acute exposure of cultured myotubes to saturated FFAs (7) or IL-6 (7,8) increases STAT3 phosphorylation and activation. To determine whether these systemic factors cause skeletal muscle insulin resistance via a STAT3-mediated mechanism, we studied their direct effect on L6 cultured myotubes. Exposure of cultured myotubes to palmitate resulted in a slow but persistent phosphorylation of STAT3 and reduced insulin-stimulated Akt phosphorylation. However, IL-6 exposure resulted in a rapid, but transient phosphorylation of STAT3, without altering insulin action on p-Akt abundance. This time-related difference in STAT3 phosphorylation between IL-6 and palmitate exposure may explain the divergent effects between these two stimuli on insulin signaling. Interestingly, chronic palmitate treatment of human myotubes increases expression and protein production of IL-6 via a proteasome-dependent mechanism involving nuclear factor-κβ (NF-κβ), which subsequently potentiates p-STAT3 protein abundance (7). Saturated fatty acids activate Toll-like receptor-4 (TLR-4) (31), which transmits signals to the inhibitor of κβ (Iκβ) and the NF-κβ pathway to simulate the production of a number of inflammatory cytokines, including IL-6 and TNF-α, that subsequently lead to the development of insulin resistance (32,33). Silencing of TLR-4 in IL-6–treated human myotubes prevents defects in Akt phosphorylation and glucose uptake (8). Given the clinical evidence that obese and T2D patients have increased TLR-4 mRNA and protein levels in skeletal muscle, as well as the experimental evidence showing TLR-4 action blockade with neutralizing antibodies prevents lipid-induced TLR-4–driven signaling involving Iκβ/NF-κβ (34), strategies to silence STAT3 or TLR-4 may be efficacious in preserving skeletal muscle insulin sensitivity.
Tissue-specific knockout mice reveal STAT3 plays a role in the development of insulin resistance in liver (35) and body weight homeostasis through the control of adipocyte hypertrophy (36). Enhanced STAT3 activation in proopiomelanocortin-expressing neurons of the hypothalamus has been directly linked to the development of hypothalamic leptin and insulin resistance, indicating this pathway also plays a major role in the central control of body weight and glucose homeostasis (37). However, in mice with liver and pancreatic islets STAT3 inactivation, insulin resistance develops concomitant with an upregulation of glycogen synthase kinase-3β and a decrease in glycogen synthase activity (38). Using siRNA, we determined the direct role of STAT3 on lipid-induced insulin resistance in skeletal muscle and found that STAT3 silencing in L6 myotubes led to a parallel downregulation of SOCS3 protein abundance. Importantly, the palmitate-induced increase in SOCS3 protein abundance, as well as the lipid-induced reduction in insulin-stimulated glucose incorporation into glycogen and Akt phosphorylation, was prevented by STAT3 silencing. The partial restoration of Akt signaling may be sufficient to fully restore insulin-stimulated glycogen synthesis (39). The weaker enhancement of Akt phosphorylation in SOCS3-silenced versus STAT3-silenced cells may reflect both SOCS1 and SOCS3 activation (8,10,23,40). STAT3 silencing may downregulate SOCS1 and SOCS3 protein abundance, thereby enhancing tyrosine phosphorylation of insulin receptor substrate (IRS)-1 and IRS-2 (6), which may lead to a robust enhancement in Akt signaling. Conversely, SOCS3 silencing increases IRS-1 tyrosine phosphorylation, with only a modest effect on IRS-2 phosphorylation (6). However, we noted that lipid-induced insulin resistance on AS160 was prevented by silencing SOCS3 or STAT3. Our evidence that STAT3 silencing improves insulin sensitivity is consistent with earlier findings in liver hepatocarcinoma cells or human myotubes after treatment with amino acids or IL-6, respectively (8,10,23,40), but opposes the insulin-resistant phenotype observed in mice with a lifelong inactivation of STAT3 in both liver and pancreatic islets (38). Hence, the role of STAT3 in the development of tissue-specific insulin resistance requires further clarification.
In conclusion, STAT3 is constitutively phosphorylated in skeletal muscle from T2D patients. Moreover, systemic factors are likely to contribute to the development of insulin resistance and impairments in signal transduction in T2D because p-STAT3 was inversely correlated with the FFA level in NGT subjects. Thus, our results are consistent with a feedback loop (37), whereby elevations in systemic factors increase p-STAT3 and negatively affect skeletal muscle insulin signaling and glucose uptake. Our results using siRNA-mediated silencing support this notion, because a 70% reduction in STAT3 protein prevents the development of lipid-induced insulin resistance in skeletal muscle. Collectively, our results provide evidence for a link between excessive STAT3 signaling in the early development of insulin resistance and T2D pathogenesis.
ACKNOWLEDGMENTS
This study was supported with funding from the European Research Council Advanced Grant Ideas Program, the European Foundation for the Study of Diabetes, the Swedish Research Council, the Swedish Diabetes Association, the Stockholm County Council, the Strategic Research Foundation, the Novo Nordisk Foundation, the Knut and Alice Wallenberg Foundation, and The Strategic Diabetes Program at Karolinska Institutet.
No potential conflicts of interest relevant to this article were reported.
F.M. performed the experiments, analyzed and researched data, and wrote the manuscript. A.V.C. analyzed and researched data, contributed to discussion, and reviewed and edited the manuscript. A.K. analyzed data, contributed to discussion, and reviewed and edited the manuscript. J.R.Z. designed the study, analyzed data, contributed to discussion, and wrote, reviewed, and edited the manuscript. J.R.Z. is the guarantor of this work and, as such, had full access to all of the data in the study and takes responsibility for the integrity of the data and the accuracy of the data analysis.
REFERENCES
- 1.Guilherme A, Virbasius JV, Puri V, Czech MP. Adipocyte dysfunctions linking obesity to insulin resistance and type 2 diabetes. Nat Rev Mol Cell Biol 2008;9:367–377 [DOI] [PMC free article] [PubMed] [Google Scholar]
- 2.Pittas AG, Joseph NA, Greenberg AS. Adipocytokines and insulin resistance. J Clin Endocrinol Metab 2004;89:447–452 [DOI] [PubMed] [Google Scholar]
- 3.Greenberg AS, McDaniel ML. Identifying the links between obesity, insulin resistance and beta-cell function: potential role of adipocyte-derived cytokines in the pathogenesis of type 2 diabetes. Eur J Clin Invest 2002;32(Suppl. 3):24–34 [DOI] [PubMed] [Google Scholar]
- 4.Emanuelli B, Peraldi P, Filloux C, et al. SOCS-3 inhibits insulin signaling and is up-regulated in response to tumor necrosis factor-alpha in the adipose tissue of obese mice. J Biol Chem 2001;276:47944–47949 [DOI] [PubMed] [Google Scholar]
- 5.Rui L, Yuan M, Frantz D, Shoelson S, White MF. SOCS-1 and SOCS-3 block insulin signaling by ubiquitin-mediated degradation of IRS1 and IRS2. J Biol Chem 2002;277:42394–42398 [DOI] [PubMed] [Google Scholar]
- 6.Ueki K, Kondo T, Kahn CR. Suppressor of cytokine signaling 1 (SOCS-1) and SOCS-3 cause insulin resistance through inhibition of tyrosine phosphorylation of insulin receptor substrate proteins by discrete mechanisms. Mol Cell Biol 2004;24:5434–5446 [DOI] [PMC free article] [PubMed] [Google Scholar]
- 7.Weigert C, Brodbeck K, Staiger H, et al. Palmitate, but not unsaturated fatty acids, induces the expression of interleukin-6 in human myotubes through proteasome-dependent activation of nuclear factor-kappaB. J Biol Chem 2004;279:23942–23952 [DOI] [PubMed] [Google Scholar]
- 8.Kim TH, Choi SE, Ha ES, et al. IL-6 induction of TLR-4 gene expression via STAT3 has an effect on insulin resistance in human skeletal muscle. Acta Diabetol 4 February 2011 [Epub ahead of print] [DOI] [PubMed]
- 9.Carey AL, Steinberg GR, Macaulay SL, et al. Interleukin-6 increases insulin-stimulated glucose disposal in humans and glucose uptake and fatty acid oxidation in vitro via AMP-activated protein kinase. Diabetes 2006;55:2688–2697 [DOI] [PubMed] [Google Scholar]
- 10.Kim JH, Bachmann RA, Chen J. Interleukin-6 and insulin resistance. Vitam Horm 2009;80:613–633 [DOI] [PubMed] [Google Scholar]
- 11.de Castro Barbosa T, de Carvalho JE, Poyares LL, Bordin S, Machado UF, Nunes MT. Potential role of growth hormone in impairment of insulin signaling in skeletal muscle, adipose tissue, and liver of rats chronically treated with arginine. Endocrinology 2009;150:2080–2086 [DOI] [PubMed] [Google Scholar]
- 12.Oberbach A, Schlichting N, Blüher M, et al. Palmitate induced IL-6 and MCP-1 expression in human bladder smooth muscle cells provides a link between diabetes and urinary tract infections. PLoS ONE 2010;5:e10882. [DOI] [PMC free article] [PubMed] [Google Scholar]
- 13.Rieusset J, Bouzakri K, Chevillotte E, et al. Suppressor of cytokine signaling 3 expression and insulin resistance in skeletal muscle of obese and type 2 diabetic patients. Diabetes 2004;53:2232–2241 [DOI] [PubMed] [Google Scholar]
- 14.Senn JJ, Klover PJ, Nowak IA, et al. Suppressor of cytokine signaling-3 (SOCS-3), a potential mediator of interleukin-6-dependent insulin resistance in hepatocytes. J Biol Chem 2003;278:13740–13746 [DOI] [PubMed] [Google Scholar]
- 15.Weigert C, Hennige AM, Brodbeck K, Häring HU, Schleicher ED. Interleukin-6 acts as insulin sensitizer on glycogen synthesis in human skeletal muscle cells by phosphorylation of Ser473 of Akt. Am J Physiol Endocrinol Metab 2005;289:E251–E257 [DOI] [PubMed] [Google Scholar]
- 16.Al-Khalili L, Chibalin AV, Kannisto K, et al. Insulin action in cultured human skeletal muscle cells during differentiation: assessment of cell surface GLUT4 and GLUT1 content. Cell Mol Life Sci 2003;60:991–998 [DOI] [PMC free article] [PubMed] [Google Scholar]
- 17.Senn JJ. Toll-like receptor-2 is essential for the development of palmitate-induced insulin resistance in myotubes. J Biol Chem 2006;281:26865–26875 [DOI] [PubMed] [Google Scholar]
- 18.Thrush AB, Heigenhauser GJ, Mullen KL, Wright DC, Dyck DJ. Palmitate acutely induces insulin resistance in isolated muscle from obese but not lean humans. Am J Physiol Regul Integr Comp Physiol 2008;294:R1205–R1212 [DOI] [PubMed] [Google Scholar]
- 19.Laws A, Hoen HM, Selby JV, Saad MF, Haffner SM, Howard BV, Insulin Resistance Atherosclerosis Study (IRAS) Investigators Differences in insulin suppression of free fatty acid levels by gender and glucose tolerance status. Relation to plasma triglyceride and apolipoprotein B concentrations. Arterioscler Thromb Vasc Biol 1997;17:64–71 [DOI] [PubMed] [Google Scholar]
- 20.Groop LC, Bonadonna RC, DelPrato S, et al. Glucose and free fatty acid metabolism in non-insulin-dependent diabetes mellitus. Evidence for multiple sites of insulin resistance. J Clin Invest 1989;84:205–213 [DOI] [PMC free article] [PubMed] [Google Scholar]
- 21.Zhang K, Guo W, Yang Y, Wu J. JAK2/STAT3 pathway is involved in the early stage of adipogenesis through regulating C/EBPβ transcription. J Cell Biochem 2011;112:488–497 [DOI] [PubMed] [Google Scholar]
- 22.Ferrannini E, Barrett EJ, Bevilacqua S, DeFronzo RA. Effect of fatty acids on glucose production and utilization in man. J Clin Invest 1983;72:1737–1747 [DOI] [PMC free article] [PubMed] [Google Scholar]
- 23.Kim JH, Kim JE, Liu HY, Cao W, Chen J. Regulation of interleukin-6-induced hepatic insulin resistance by mammalian target of rapamycin through the STAT3-SOCS3 pathway. J Biol Chem 2008;283:708–715 [DOI] [PubMed] [Google Scholar]
- 24.He HJ, Zhu TN, Xie Y, et al. Pyrrolidine dithiocarbamate inhibits interleukin-6 signaling through impaired STAT3 activation and association with transcriptional coactivators in hepatocytes. J Biol Chem 2006;281:31369–31379 [DOI] [PubMed] [Google Scholar]
- 25.Charles MA, Eschwège E, Thibult N, et al. The role of non-esterified fatty acids in the deterioration of glucose tolerance in Caucasian subjects: results of the Paris Prospective Study. Diabetologia 1997;40:1101–1106 [DOI] [PubMed] [Google Scholar]
- 26.Paolisso G, Tataranni PA, Foley JE, Bogardus C, Howard BV, Ravussin E. A high concentration of fasting plasma non-esterified fatty acids is a risk factor for the development of NIDDM. Diabetologia 1995;38:1213–1217 [DOI] [PubMed] [Google Scholar]
- 27.Deng XS, Wang S, Deng A, et al. Metformin targets Stat3 to inhibit cell growth and induce apoptosis in triple-negative breast cancers. Cell Cycle 2012;11:367–376 [DOI] [PubMed] [Google Scholar]
- 28.Nerstedt A, Johansson A, Andersson CX, Cansby E, Smith U, Mahlapuu M. AMP-activated protein kinase inhibits IL-6-stimulated inflammatory response in human liver cells by suppressing phosphorylation of signal transducer and activator of transcription 3 (STAT3). Diabetologia 2010;53:2406–2416 [DOI] [PubMed] [Google Scholar]
- 29.Inzucchi SE, Maggs DG, Spollett GR, et al. Efficacy and metabolic effects of metformin and troglitazone in type II diabetes mellitus. N Engl J Med 1998;338:867–872 [DOI] [PubMed] [Google Scholar]
- 30.Howard JK, Flier JS. Attenuation of leptin and insulin signaling by SOCS proteins. Trends Endocrinol Metab 2006;17:365–371 [DOI] [PubMed] [Google Scholar]
- 31.Lee JY, Zhao L, Youn HS, et al. Saturated fatty acid activates but polyunsaturated fatty acid inhibits Toll-like receptor 2 dimerized with Toll-like receptor 6 or 1. J Biol Chem 2004;279:16971–16979 [DOI] [PubMed] [Google Scholar]
- 32.Kim JK. Fat uses a TOLL-road to connect inflammation and diabetes. Cell Metab 2006;4:417–419 [DOI] [PubMed] [Google Scholar]
- 33.Song MJ, Kim KH, Yoon JM, Kim JB. Activation of Toll-like receptor 4 is associated with insulin resistance in adipocytes. Biochem Biophys Res Commun 2006;346:739–745 [DOI] [PubMed] [Google Scholar]
- 34.Reyna SM, Ghosh S, Tantiwong P, et al. Elevated toll-like receptor 4 expression and signaling in muscle from insulin-resistant subjects. Diabetes 2008;57:2595–2602 [DOI] [PMC free article] [PubMed] [Google Scholar]
- 35.Inoue H, Ogawa W, Ozaki M, et al. Role of STAT-3 in regulation of hepatic gluconeogenic genes and carbohydrate metabolism in vivo. Nat Med 2004;10:168–174 [DOI] [PubMed] [Google Scholar]
- 36.Cernkovich ER, Deng J, Bond MC, Combs TP, Harp JB. Adipose-specific disruption of signal transducer and activator of transcription 3 increases body weight and adiposity. Endocrinology 2008;149:1581–1590 [DOI] [PMC free article] [PubMed] [Google Scholar]
- 37.Ernst MB, Wunderlich CM, Hess S, et al. Enhanced Stat3 activation in POMC neurons provokes negative feedback inhibition of leptin and insulin signaling in obesity. J Neurosci 2009;29:11582–11593 [DOI] [PMC free article] [PubMed] [Google Scholar]
- 38.Moh A, Zhang W, Yu S, et al. STAT3 sensitizes insulin signaling by negatively regulating glycogen synthase kinase-3 beta. Diabetes 2008;57:1227–1235 [DOI] [PubMed] [Google Scholar]
- 39.Tan SX, Ng Y, Meoli CC, et al. Amplification and demultiplexing in insulin-regulated Akt protein kinase pathway in adipocytes. J Biol Chem 2012;287:6128–6138 [DOI] [PMC free article] [PubMed] [Google Scholar]
- 40.Kim JH, Yoon MS, Chen J. Signal transducer and activator of transcription 3 (STAT3) mediates amino acid inhibition of insulin signaling through serine 727 phosphorylation. J Biol Chem 2009;284:35425–35432 [DOI] [PMC free article] [PubMed] [Google Scholar]


