

Abstract
Elevated serum free fatty acids (FFAs) levels play an important role in the development of insulin resistance (IR) and diabetes. We investigated the dynamic changes and the underlying regulatory mechanism of postprandial FFA profile in hyperlipidemia (HLP) and their relation with insulin sensitivity in both humans and mice. We found that serum stearic acid (SA) is the only fatty acid that is increased dramatically in the postprandial state. The elevation of SA is due to increased insulin-stimulated de novo synthesis mediated by sterol regulatory element–binding protein-1c (SREBP-1c)/acetyl-CoA carboxylase/fatty acid synthase/elongation of long-chain fatty acid family member 6 (ELOVL6) and the elongation of palmitic acid (PA) catalyzed by ELOVL6. Downregulation of SREBP-1c or ELOVL6 by small interfering RNA can reduce SA synthesis in liver and serum SA level, followed by amelioration of IR in HLP mice. However, inhibition of SREBP-1c is more effective in improving IR than suppression of ELOVL6, which resulted in accumulation of PA. In summary, increased postprandial SA is caused by the insulin-stimulated SREBP-1c pathway and elongation of PA in HLP. Reduction of postprandial SA is a good candidate for improving IR, and SREBP-1c is potentially a better target to prevent IR and diabetes by decreasing SA.
Hyperlipidemia (HLP) is strikingly common in patients with type 2 diabetes (1), and disturbance of lipid metabolism appears to be an early event in the development of diabetes, potentially preceding disease onset by several years (2). Increased serum free fatty acids (FFAs) are a major pathogenic factor in HLP, and FFAs appear to play an important role in the development of insulin resistance (IR) and diabetes (3–5).
Different species of FFAs have different effects on the progress of IR and diabetes (6–9), and reports of the relationships between unsaturated fatty acids and IR or diabetes in human are not consistent (8,9). However, almost all of the evidence points to a negative effect of saturated fatty acids, such as palmitic acid (PA), on IR (9–11). The mechanisms include increasing saturated faty acids, resulting in the accumulation of various lipid metabolites in tissues, which impairs β-cell function or interferes with insulin signaling (9,11–13). However, most of the studies mentioned above were focused on the relationship between individual species or total fatty acids and IR (3,13–15). The FFA profile, which can better reflect the development of IR and/or diabetes and reveal its potential mechanisms, is attracting increasing levels of interest. The FFA profile is changed markedly in diabetes, and some fatty acid species can be regarded as biomarkers predicting and/or identifying IR (16–18). So far, however, few studies have investigated changes in serum FFA profile in HLP. All of those studies were done in the fasting state (19), but is important to note that the body is in the postprandial state for most of the day. Changes in FFAs and metabolism in the postprandial state could contribute more to the alteration of the pathophysiological function of the body; therefore, it is important to study the potential effect of change in the FFA profile and metabolism in the postprandial state. It is unclear, however, whether the postprandial FFA profile can be changed and further aggravate IR in HLP.
In this study, we investigated dynamic changes in the profile of postprandial serum FFAs in primary HLP patients after glucose loading and found that serum stearic acid (SA) increased dramatically. We asked: 1) why postprandial SA is increased significantly in HLP, 2) what the relationship is between SA and IR, and 3) how to reduce increased postprandial SA. A series of experiments, including human, animal, and cell essays, were performed to comprehensively address these questions.
RESEARCH DESIGN AND METHODS
Participants.
The study was a case-control trial with 51 normolipidemic individuals and 52 primary hyperlipidemic patients selected from the published Harbin People’s Health Study (20). All participants received a clinical examination, and anthropometric, health, and lifestyle information were collected. HLP was diagnosed according to fasting serum triglyceride (TG; cutoff 1.7 mmol/L) and cholesterol (TC; cutoff 5.7 mmol/L) measurements. Patients receiving treatment with medication (especially hyperlipidemic medication) or any other disease likely to interfere with the study were excluded. Before the experiment, participants received an isocaloric diet (65, 25, and 10% of energy derived from carbohydrate, fat, and protein, respectively) for 3 days.
After fasting for 12 h, participants were challenged with the equivalent of 75 g of anhydrous glucose dissolved in 250 mL of water (oral glucose tolerance test [OGTT]). Blood samples were collected at 0, 30, 60, 90, 120, 180, 240, and 300 min. Another 75 g of glucose was administered immediately after the blood sample was collected at 300 min, and blood samples were obtained after the subsequent 120 min. All blood samples were centrifuged at low speed, and serum was stored at −80°C.
The study was approved by the Ethics Committee of Harbin Medical University and done in accordance with the Declaration of Helsinki. Written informed consent was obtained from each participant.
Animal experiment.
Male 8-week-old C57BL/6 mice obtained from Vitalriver (Beijing, China) were housed in a pathogen-free barrier facility at a temperature of 22 ± 2°C and maintained on a 12-h light/dark cycle with water ad libitum. Mice were randomly assigned to either a low-fat diet (normal mice; n = 40) or a high-fat diet (HLP mice; n = 60). The low-fat diet provides 3.94 kcal/g of energy (63.8% carbohydrate, 20.3% protein, and 15.9% fat). The high-fat diet provided 4.67 kcal/g of energy (40.5% carbohydrate, 17.1% protein, and 42.4% fat; Supplementary Table 1). The mice were fed for 16 weeks, and then after fasting overnight, the mice were given an intraperitoneal injection of 10% (weight for volume) glucose solution (1 g/kg). Blood samples were collected via retro-orbital bleeding at 0, 30, 60, 90, and 120 min (n = 6 mice for each time point in each group). Liver and muscle tissues were dissected and then frozen and stored in liquid nitrogen.
The HLP mice received a tail vein injection of small interfering RNA (siRNA) with 2’-O-methyl-modification for sterol regulatory element-binding protein-1c (SREBP-1c) (siRNA-SRE), long-chain fatty acid family member 6 (ELOVL6) (siRNA-ELOV), or scrambled siRNA (siRNA-ctrl) five times at 48-h intervals. Normal mice were injected only siRNA-ctrl. The siRNAs were synthesized by RiboBio Co. (Guangzhou, China). The sequences of siRNA were shown in Supplementary Table 2. Each siRNA (0.2 nmol/g) was administered at ∼0.2 mL/injection. Intraperitoneal injection of glucose was done 24 h after the last injection of siRNA. Blood samples and liver tissue were collected at 0 and 120 min after glucose loading (n = 5 mice for each time point in each group).
Cell culture and treatment.
Human hepatoma HepG2 cells obtained from the Chinese Academy of Science (Shanghai, China) were incubated in a 5% CO2 atmosphere at 37°C.
To study insulin action on SA synthesis, cells were cultured in normal culture medium. After 12 h of serum starvation, cells were treated with 0, 0.1, 1, 10, and 100 nmol/L insulin for 0, 2, and 4 h, respectively. Intracellular SA, PA, and genes involved in SA synthesis were detected.
To study the effect of SA on IR, after serum starvation, HepG2 cells were treated with 0, 200, 300, 400, and 500 μmol/L SA (Sigma-Aldrich, Taufkirchen, Germany) for 24 h and stimulated with 100 nmol/L insulin for 10 min. Then insulin receptor substrate-2 (IRS-2), protein kinase B (Akt), forkhead box O1 (FoxO1) proteins, and their phosphorylations (pIRS-2, pAkt, and pFoxO1) were examined. Meanwhile, cells were starved for 12 h in serum- and antibiotic-free medium and then transfected with siRNA-SRE, siRNA-ELOV, or siRNA-ctrl with Lipofectamine 2000 (Invitrogen, Carlsbad, CA) according to the manufacturer’s instructions. The sequences of siRNA purchased from Santa Cruz Biotechnology (Santa Cruz, CA) are shown in Supplementary Table 2. At 48 h after transfection, cells were rendered IR by a prolonged insulin treatment (100 nmol/L insulin, 10 h) (21). Cells transfected with siRNA-ctrl without prolonged insulin treatment were used as the normal group. Following washing and incubation for 1 h in insulin-free medium to dissociate any insulin, all of the cells were acutely stimulated with 100 nmol/L insulin for 10 min. Intracellular SA, PA, and related genes were detected.
Serum FFA profile and intracellular fatty acid analysis.
Total lipids were extracted from liver and muscle tissues, and FFAs in samples were transformed to fatty acid methyl esters as described in our earlier study (22,23). Gas chromatography–mass spectrometry analysis was done with a gas chromatography coupled to an ion-trap mass spectrometer (TRACE GC/PolarisQ MS; Thermo Finnigan, San Jose, CA). Separation was performed on a DB-WAX capillary column (30 m x 0.25 mm I.D., 0.25-μm film thickness; Agilent J&W Scientific, Folsom, CA).
Serum glucose, insulin, and lipids.
Serum glucose, TC, TG, and HDL cholesterol (HDL-c) were measured using kits purchased from Biosino Biotechnology Co. (Beijing, China). LDL cholesterol (LDL-c) was calculated by subtracting HDL-c from TC. Human insulin was measured with an autoanalyzer using commercial kits (Centaur; Bayer Corporation, Bayer Leverkusen, Germany). Mouse insulin was measured with a rat/mouse insulin ELISA kit (LINCO Research, St. Charles, MS). Homeostasis model assessment (HOMA)-IR = (fasting insulin [mU/L] × fasting glucose [mmol/L])/22.5 (24). Insulin sensitivity index (HOMA-ISI) = 2/(insulinp [mU/L] × glucosep [mmol/L] + 1) (25).
Quantitative real-time PCR.
Total RNA were isolated from cells and liver tissue with TRIzol reagent (Invitrogen) according to the manufacturer’s instructions. RNA was reverse transcribed to cDNA using a High-Capacity cDNA Reverse Transcription Kit (Applied Biosystems, Foster City, CA). Real-time PCR was performed with the SYBR Green PCR Master Mix and a 7500 FAST Real-time PCR System (Applied Biosystems). The sequences of all primers are listed in Supplementary Table 3 (26).
Western blotting.
Western blot was done as described (27). All of the primary antibodies used in this study are rabbit polyclonal antibodies: SREBP-1c, pIRS-2 (Tyr612), and β-actin antibodies (Santa Cruz Biotechnology); acetyl-CoA carboxylase (ACC), IRS-2, Akt, pAkt (Ser473), FoxO1, and pFoxO1 (Thr24) antibodies (Cell Signaling Technology, Beverly, MA); and fatty acid synthase (FAS) and ELOVL6 antibodies (Abcam, Cambridge, MA). Secondary antibody was alkaline phosphatase (goat polyclonal antibody to rabbit IgG; Santa Cruz Biotechnology).
Statistical analysis.
Values are presented as mean ± SEM. Statistical analyses were done with SPSS 10.0 software (SPSS, Chicago, IL). Significance was determined by using two-tailed Student t test or one- or two-way ANOVA as appropriate. Correlations between changes in variables were tested using Pearson correlation. The level of statistical significance was set at P ≤ 0.05.
RESULTS
Demographic and metabolic features of the participants.
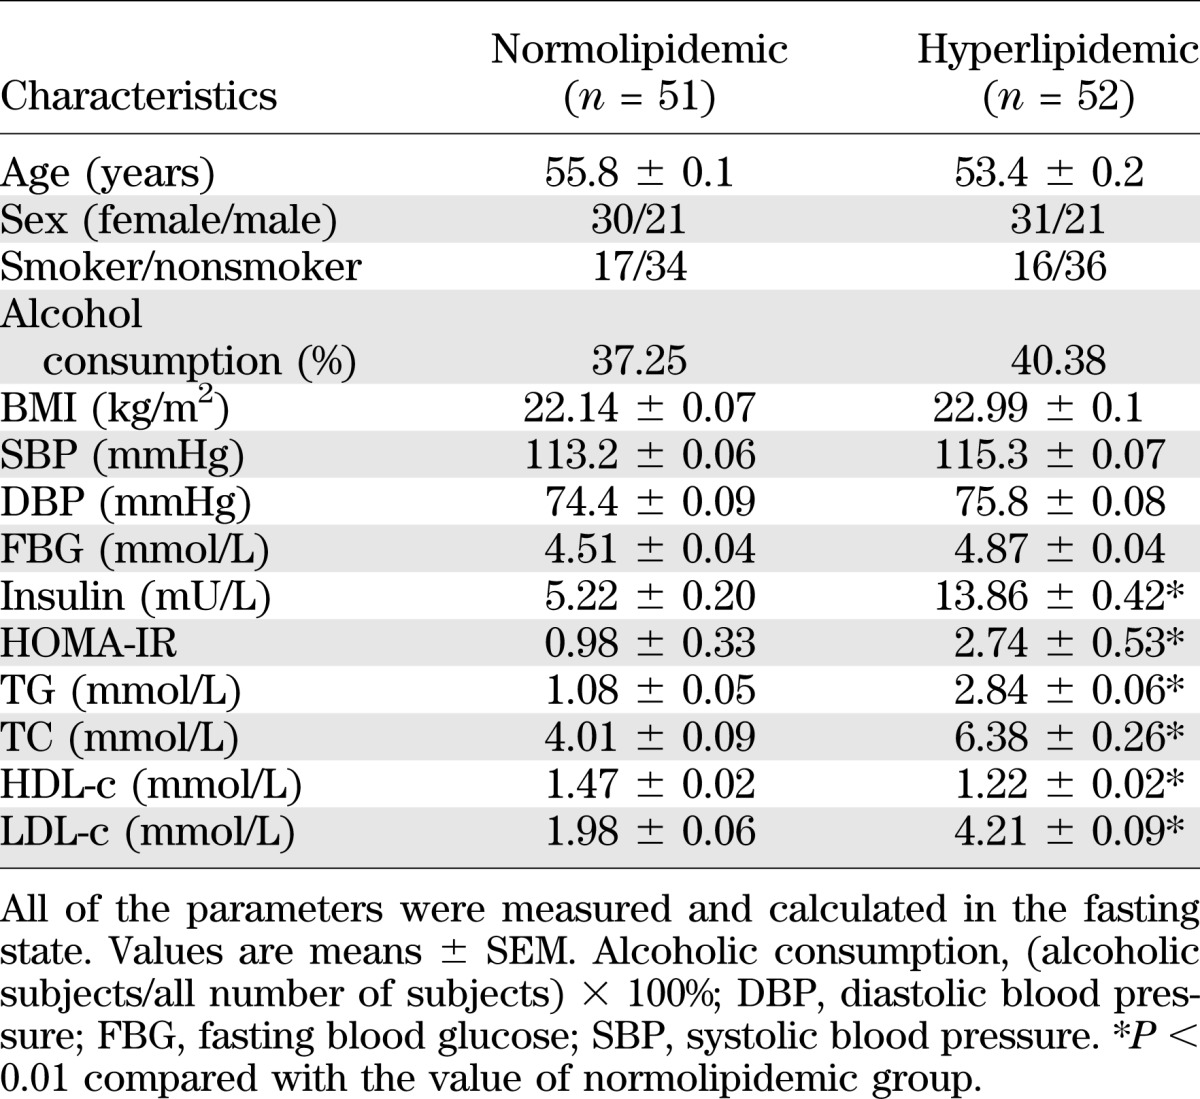
Demographic details and basic biochemical characteristics of the normolipidemic and HLP participants in the fasting state are given in Table 1. There was no significant difference between the two groups in age, sex, BMI, systolic blood pressure, diastolic blood pressure, or fasting blood glucose. The fasting serum insulin was 2.66-fold higher in the HLP group than that of normolipidemic group. HOMA-IR was significantly higher in HLP patients, indicating the presence of IR. As expected, the concentrations of serum TG, TC, and LDL-c in HLP group were significantly higher, whereas the concentration of HDL-c was lower compared with that in the normolipidemic group.
TABLE 1.
Demographic and metabolic features of the participants
Serum glucose, insulin, and insulin sensitivity during 300 min of the OGTT.
During the OGTT, serum glucose level reached a peak at 30 min and then returned gradually to the baseline at 120 min in normolipidemic and HLP participants (Fig. 1A). Serum insulin level reached a peak at 30 min in both groups and then declined (Fig. 1B). The insulin level was significantly higher in HLP group than that in normolipidemic group during the whole OGTT. The area under the curve (AUC) of glucose and insulin between 0 and 120 min in the HLP group was 26 and 85% higher, respectively, compared with the normolipidemic group (Fig. 1C and D). HOMA-ISI between 0 and 120 min was significantly lower in HLP group compared with that in the normolipidemic group (Fig. 1E).
FIG. 1.

The changes in serum glucose and insulin during 300 min of the OGTT and HOMA-ISI in normolipidemic and hyperlipidemic participants. The changes in serum glucose level (A) and insulin level (B) during OGTT. The AUC of glucose (C) and insulin (D) between 0 and 120 min of OGTT. E: HOMA-ISI values between 0 and 120 min of OGTT. **P < 0.01, compared with the value at 0 min of OGTT in the same group; ^P < 0.05, ^^P < 0.01, compared with the value of normolipidemic group at the same time point of OGTT. H, hyperlipidemic patients, n = 52; N, normolipidemic participants, n = 51.
FFA profile change in the subjects during 300 min of the OGTT.
In all, 15 species of serum FFAs were detected, and the levels of 14 were decreased or unaltered during OGTT compared with the respective baseline in both the normolipidemic and HLP groups (Supplementary Table 4). SA was the only fatty acid species with a different dynamic change during OGTT. Serum SA level was increased dramatically after glucose loading and reached a maximum at 120 min in both groups (Fig. 2A). In particular, the change of serum SA level between 0 and 120 min in the HLP group was much greater than that in the normolipidemic group (Fig. 2B). In HLP patients, serum SA level at 120 min was increased by 2.06-fold compared with that at the baseline, whereas it was only a 0.61-fold increase in the normolipidemic group. The SA level was elevated throughout the OGTT and had not returned to baseline at 300 min in HLP patients. After a second glucose loading at 300 min, the SA level continued to increase. In addition, the change in SA between 0 and 120 min in HLP patients was correlated positively with the change in insulin (r = 0.560; P < 0.05) but not with glucose (r = 0.229; P > 0.05). Furthermore, the change in SA in HLP patients was correlated positively with HOMA-IR (r = 0.372; P < 0.05) and negatively with HOMA-ISI (r = −0.364; P < 0.05).
FIG. 2.

The changes in serum SA after glucose loading in normolipidemic and hyperlipidemic participants. A: Serum SA concentrations at indicated time after glucose loading. B: The changes in SA level between 0 min and 120 min after the first glucose loading (ΔSA) in normolipidemic and hyperlipidemic participants. *P < 0.05, **P < 0.01, compared with the value at 0 min after the first glucose loading in the same group; ^^P < 0.01 compared with the value of normolipidemic group at the same time point; #P < 0.05 for the indicated comparison. H, hyperlipidemic patients, n = 52; N, normolipidemic participants, n = 51.
Metabolic features of HLP mice.
At 16 weeks, body weight, serum TG, TC, glucose, and insulin as well as HOMA-IR were significantly higher in HLP mice (Supplementary Table 5). The levels of most fatty acids were increased, and total FFA was significantly higher in both liver and muscle in HLP mice compared with the levels in normal mice (Supplementary Table 6). Meanwhile, the changed profile of serum FFAs in HLP mice after glucose loading (Supplementary Table 7) was similar to that in HLP patients.
After glucose loading, serum SA level was increased gradually in both normal and HLP mice, and it was significantly higher in HLP mice than in normal mice at each time point (Fig. 3). The levels of SREBP-1c, ACC, FAS, and ELOVL6 mRNA in HLP mice were significantly higher than those in normal mice at each time point. The increase of SREBP-1c and ELOVL6 mRNA was statistically significant at 30 min (Supplementary Fig. 1A and B), and the increase of ACC and FAS mRNA was statistically significant at 60 min in both groups (Supplementary Fig. 1C and D). These results suggest that both de novo synthesis and elongation of PA for SA synthesis contribute to the elevation of postprandial SA.
FIG. 3.

The changes in serum SA after glucose loading in normal and hyperlipidemic mice. n = 6 for each time point in each group. *P < 0.05, **P < 0.01 compared with the value at 0 min after glucose loading in the same group; ^P < 0.05, ^^P < 0.01 compared with the value of normal mice at the same time point. H, hyperlipidemic mice; N, normal mice.
Effects of insulin on SA synthesis in HepG2 cells.
Insulin increased intracellular concentrations of SA and PA in a time- and dose-dependent manner within 4 h in HepG2 cells (Fig. 4A). The concentrations of intracellular SA and PA were highest when the cells were treated with 100 nmol/L insulin for 4 h, which was 253 and 24%, respectively, higher than that of 0 nmol/L insulin treatment. Meanwhile, insulin can induce a dose-dependent upregulation of the protein expression of SREBP-1c, ACC, FAS, and ELOVL6 (Fig. 4B). These data indicate that insulin can induce SA synthesis through de novo synthesis and elongation of PA.
FIG. 4.

Effects of insulin on SA synthesis in HepG2 cells. A: The concentrations of intracellular SA and PA in HepG2 cells treated with 0, 0.1, 1, 10, and 100 nmol/L insulin for 0, 2, and 4 h. B: Protein expression of mature form of SREBP-1c (m-SREBP-1c) in nuclear extracts and ACC, FAS, ELOVL6, and β-actin in whole-cell lysates from HepG2 cells treated with different concentrations of insulin for 4 h. Each of the experiments was repeated four times. *P < 0.05, **P < 0.01 compared with the value of 0 nmol/L insulin group at the same time point.
Effects of SA on insulin sensitivity in HepG2 cells.
IRS/Akt/FoxO1 is an important insulin-signaling pathway (28,29). After the HepG2 cells were treated with 400 or 500 μmol/L SA for 24 h, SA attenuated the expression of pIRS-2, pAkt, and pFoxO1 (Fig. 5A).
FIG. 5.


Effects of SA on insulin sensitivity in HepG2 cells. A: Protein expression of IRS-2, Akt, FoxO1, and their phosphorylations in response to different concentrations of SA in HepG2 cells. After 12 h of starvation, HepG2 cells were treated with 0, 200, 300, 400, and 500 μmol/L SA for 24 h and then exposed to 100 nmol/L insulin for 10 min. Cells treated with 0 μmol/L SA was used as normal group. Intracellular SA (B) and PA (C) concentrations in different siRNA groups with (+) or without (−) prolonged insulin treatment. D: Protein expression of IRS-2, Akt, FoxO1, and their phosphorylations in different siRNA groups with or without prolonged insulin treatment. E: Protein expression of ELOVL6 and β-actin in whole-cell lysates from HepG2 cells transfected with siRNA-ctrl or siRNA-ELOV with or without prolonged insulin treatment. F: Protein expression of mature form of SREBP-1c (m-SREBP-1c) in nuclear extracts and ACC, FAS, ELOVL6, and β-actin in whole-cell lysates from HepG2 cells transfected with siRNA-ctrl or siRNA-SRE with or without prolonged insulin treatment. Each of the experiments was repeated four times. The HepG2 cells were transfected with siRNA-ctrl, siRNA-SRE, or siRNA-ELOV for 48 h and then cells were rendered IR by prolonged insulin treatment (100 nmol/L insulin for 10 h). Cells transfected with siRNA-ctrl without prolonged insulin treatment were set as normal group. After washing and culture in normal medium for 1 h, all of the cells were stimulated with 100 nmol/L insulin for 10 min. *P < 0.05, **P < 0.01 compared with the value of normal group; ^P < 0.05, ^^P < 0.01 for the indicated comparison.
Prolonged high-insulin treatment can reduce insulin sensitivity in vitro (21). The results above showed that insulin induced SA synthesis and extracellular high SA level reduced insulin sensitivity in HepG2 cells, so we asked whether intracellular SA could be increased also and might be associated with IR induced by prolonged insulin treatment. The results showed that in HepG2 cells transfected with siRNA-ctrl, intracellular SA was increased by 350%, and PA was increased by 30% after treatment with 100 nmol/L insulin for 10 h (Fig. 5B and C) compared with cells without prolonged insulin treatment, and the expression of pIRS-2, pAkt, and pFoxO1 were decreased significantly (Fig. 5D). In HepG2 cells transfected with siRNA-ELOV, which inhibits the elongation of PA, ELOVL6 protein was decreased significantly (Fig. 5E). Accordingly, intracellular SA was reduced significantly and PA was increased (Fig. 5B and C), and the decreases of pIRS-2, pAkt, and pFoxO1 proteins were inhibited significantly (Fig. 5D) compared with cells transfected with siRNA-ctrl. After knocking down SREBP-1c expression by siRNA-SRE, which suppresses the de novo synthesis of SA, the insulin-stimulated increase of SREBP-1c and downstream targets, including ACC, FAS, and ELOVL6, was suppressed effectively (Fig. 5F). Moreover, intracellular SA and PA were decreased (Fig. 5B and C), and the decreases of pIRS-2, pAkt, and pFoxO1 proteins were inhibited significantly (Fig. 5D) compared with cells transfected with siRNA-ctrl. These results suggest that the elevation of intracellular SA partly contributes to insulin desensitivity, and the decrease of intracellular SA content can enhance insulin sensitivity to a certain extent in HepG2 cells. In addition, we compared the difference in intracellular SA and insulin sensitivity between the siRNA-SRE and siRNA-ELOV groups. There was no significant difference in the SA level (Fig. 5B). However, the degree of change of intracellular PA was different between these two groups. Intracellular PA was increased in the siRNA-ELOV group but decreased in the siRNA-SRE group (Fig. 5C), indicating that inhibition of ELOVL6 resulted in accumulation of intracellular PA. Moreover, the expressions of pIRS-2, pAkt, and pFoxO1 were significantly higher in the siRNA-SRE group than those in the siRNA-ELOV group (Fig. 5D).
Effects of inhibition of SREBP-1c or ELOVL6 with siRNA on postprandial serum SA and insulin sensitivity in HLP mice.
The expression of hepatic SREBP-1c or ELOVL6 was inhibited effectively in HLP mice injected with siRNA-SRE or siRNA-ELOV at both the protein and mRNA levels at 0 and 120 min after glucose loading compared with HLP mice injected with siRNA-ctrl (Fig. 6A and B and Supplementary Fig. 2A and B). In the siRNA-SRE group, the downstream molecules regulated by SREBP-1c, including ACC, FAS, and ELOVL6, were suppressed effectively at 0 and 120 min after glucose loading (Fig. 6A and Supplementary Fig. 2C–E).
FIG. 6.

Protein expression of key transcription factor and enzymes involved in SA synthesis in normal and hyperlipidemic mice injected with different siRNA at 0 and 120 min after glucose loading. A: Protein expression of mature form of SREBP-1c (m-SREBP-1c) in nuclear extracts and ACC, FAS, ELOVL6, and β-actin in whole-cell lysates from the livers of normal and hyperlipidemic mice injected with siRNA-ctrl or siRNA-SRE at 0 and 120 min of glucose loading. B: Protein expression of ELOVL6 and β-actin in whole-cell lysates from the livers of normal and hyperlipidemic mice injected with siRNA-ctrl or siRNA-ELOV at 0 and 120 min of glucose loading. Each of the experiments was repeated four times. H+siRNA-ctrl, hyperlipidemic mice injected with scrambled siRNA; H+siRNA-ELOV, hyperlipidemic mice injected with siRNA for ELOVL6; H+siRNA-SRE, hyperlipidemic mice injected with siRNA for SREBP-1c; N+siRNA-ctrl, normal mice injected with scrambled siRNA. **P < 0.01 for the indicated comparison.
After glucose loading, serum SA level in the siRNA-SRE and siRNA-ELOV groups was decreased significantly compared with HLP mice injected with siRNA-ctrl at 0 and 120 min (Table 2). The extent of SA increase (ΔSA) between 0 and 120 min in both the siRNA-SRE and siRNA-ELOV groups was significantly lower (H+siRNA-ctrl, ΔSA = 130.85 ± 2.89 μmol/L; H+siRNA-SRE, ΔSA = 56.93 ± 4.37 μmol/L; and H+siRNA-ELOV, ΔSA = 60.38 ± 3.98 μmol/L), but there was no significant difference in the level of the change of SA between the siRNA-SRE and siRNA-ELOV groups. Serum PA level was decreased in the siRNA-SRE group but increased in the siRNA-ELOV group at both 0 and 120 min compared with HLP mice injected with siRNA-ctrl (Table 2).
TABLE 2.
Serum SA and PA concentrations, HOMA-IR, and HOMA-ISI in mice at 0 and 120 min after glucose loading
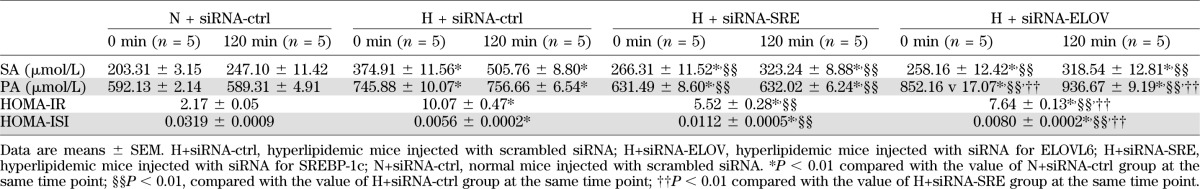
HOMA-IR was lower in the siRNA-SRE and siRNA-ELOV groups compared with HLP mice with the siRNA-ctrl injection, and it was lower in the siRNA-SRE group than that in the siRNA-ELOV group. HOMA-ISI was higher in the siRNA-SRE and siRNA-ELOV groups compared with HLP mice with siRNA-ctrl injection, and it was higher in the siRNA-SRE group compared with that in the siRNA-ELOV group (Table 2).
DISCUSSION
Elevated fasting serum FFAs is widely recognized as a risk factor for IR and diabetes (3–5). However, no study of the metabolic change of postprandial FFAs and its effect on IR in HLP has been reported. Therefore, we used oral glucose intake to simulate the eating process and analyzed the change of postprandial FFAs profile in HLP.
Although serum glucose in HLP patients could not reach the diagnostic criteria of impaired glucose tolerance, serum glucose in HLP patients after glucose loading was significantly higher than that in the normolipidemic group, suggesting that the alteration of glucose tolerance has occurred in HLP patients. Therefore, the glucose curve and AUC after glucose loading in HLP were different from that in normolipidemic participants.
With regard to the postprandial FFA profile, we found for the first time that only serum SA level was increased dramatically after glucose loading in primary HLP patients. Moreover, serum SA level did not recover to the baseline even at 300 min after glucose loading when the next meal should be administered, indicating that serum SA is at a higher level at most times of the day in HLP patients. Further, the change of postprandial SA was correlated negatively with insulin sensitivity. These results suggest that postprandial elevation of SA is a major characteristic of fatty acid metabolism in HLP, and the excessive elevation of postprandial SA is possibly related to IR, which should be seriously concerned in HLP population.
We asked why is postprandial SA increased significantly in primary HLP patients? Besides dietary sources, endogenous synthesis of SA in the body should be considered (30). The de novo synthesis of endogenous SA is catalyzed by ACC and FAS to generate PA, which is then converted into SA via ELOVL6 (31,32). Generally, the expressions of ACC, FAS, and ELOVL6 are regulated directly by SREBP-1c (31,33,34) and carbohydrate-responsive element-binding protein (35,36), which are stimulated mainly by insulin and glucose, respectively (37,38). Therefore, insulin and glucose can induce de novo fatty acid synthesis. However, no study has addressed how elevated SA is regulated in the postprandial state in HLP, and the underlying mechanism is unclear. In our study, the change in insulin was correlated positively with the change in the SA level at 120 min after glucose loading in HLP patients. However, the change in the postprandial glucose level was not correlated with the change in SA. These results imply that the increase of postprandial SA level was regulated by insulin in primary HLP patients. SREBP-1c is a key target of insulin in the regulation of fatty acid synthesis in liver (37). No study has reported whether insulin can induce postprandial SA synthesis via SREBP-1c/ACC/FAS/ELOVL6. Therefore, we investigated the role of insulin on postprandial SA synthesis and clarified its potential mechanisms using both animal and cell experiments. In HLP mice, the levels of SREBP-1c, ACC, FAS, and ELOVL6 mRNA in liver and serum SA after glucose loading were increased significantly. In HepG2 cells, insulin-induced increase of intracellular SA, which is dose- and time-dependent, accompanies the increase of SREBP-1c, ACC, FAS, and ELOVL6 expression. Silencing of SREBP-1c and ELOVL6 by siRNA in HLP mice and HepG2 cells, respectively, further confirm that postprandial SA synthesis is regulated by the SREBP-1c pathway (insulin/SREBP-1c/ACC/FAS/ELOVL6) and elongation of PA (ELOVL6) in HLP.
It has been widely acknowledged that increased PA is a risk factor of IR (9–11). However, relatively few study of the effect of SA on IR has been reported. Van den Berg et al. (39) found that increased dietary SA intake could cause whole-body IR characterized by severe hepatic IR in C57BL/6 mice, but the effect of increased endogenous SA synthesis on IR is unclear. In our study, the increase of serum SA after glucose loading was owing to the enhanced endogenous synthesis in HLP patients. We found that the change of postprandial serum SA level was correlated negatively with insulin sensitivity. The result is strengthened by the results of studies by Ebbesson et al. and Kusunoki et al. (40,41) showing that serum SA is correlated negatively with insulin sensitivity in patients with diabetes, although these studies were conducted in the fasting state. The whole-body insulin desensitivity induced by SA is likely, at least partly, owing to hepatic IR caused by excessive SA synthesis and accumulation in liver, which is a main site for fatty acid synthesis. This is supported by our finding that SA could induce IR in HepG2 cells, and knocking down SREBP-1c or ELOVL6 could improve insulin sensitivity through inhibition of hepatic SA synthesis in HLP mice. Our results are further supported by those of the study by Matsuzaka et al. (32), who found that hepatic SA level was decreased and IR was improved in mice deficient for ELOVL6, even with concurrent obesity. Besides liver, increased serum SA also leads to the accumulation of lipid metabolites in skeletal muscle and fat tissue (13,42). Therefore, elevated SA can induce IR in skeletal muscle cells and adipocytes, as shown by studies by Hirabara et al. and Song et al. (12,43). These indicate SA affects insulin sensitivity in multiple tissues or organs, and the insulin desensitivity of these tissues or organs collectively contribute to the whole-body IR. However, Louheranta et al. (44) reported that a high-SA diet of 4 weeks did not impair glucose tolerance and insulin sensitivity in healthy women. The discrepancy is likely due to different experimental subjects and intervention time. The capacity to switch easily between glucose and fat for fuel is a key feature of healthy individuals, whereas these natural responses break down and become pathological in IR (45). In the study by Louheranta et al. (44), the healthy women without IR have stronger self-regulatory capacity for maintaining the glucose and lipid homeostasis in response to a short-term intake of high SA, which results in no alteration of insulin sensitivity. However, in this study, HLP patients have presented disorders of lipid metabolism and IR for a long period, which cause the deterioration of glucose tolerance and insulin sensitivity in HLP.
In this study, injection of siRNA-SRE or siRNA-ELOV both decrease postprandial serum SA level in HLP via the inhibition of SA synthesis and improve IR. However, HOMA-IR was higher in the siRNA-ELOV group than in the siRNA-SRE group, implying the improvement of IR is greater in the siRNA-SRE group. There was no difference in the change of postprandial serum SA level between the two groups, but serum PA level was increased in the siRNA-ELOV group and decreased significantly in the siRNA-SRE group. PA is correlated positively with HOMA-IR (46). Therefore, the difference of IR improvement in the two groups is likely caused by the different level of PA. In the siRNA-SRE group, inhibiting SREBP-1c led to the suppression of ACC, FAS, and ELOVL6, resulting in the decreased synthesis of total fatty acids, including PA and SA. In the siRNA-ELOV group, inhibiting ELOVL6 suppressed the elongation of PA, leading to the decrease of SA and the increase of PA. Therefore, we propose that inhibition of SREBP-1c is superior to suppression of ELOVL6 in ameliorating IR in HLP.
This study was focused on the effect of SA on IR. However, the level of some other species in the FFA profile was changed significantly after glucose loading, and the roles of these fatty acids in the development of IR require further study.
In summary, we have found for the first time that the postprandial serum SA level is increased dramatically in primary HLP patients. This increase is likely due to the enhanced synthesis through activating the SREBP-1c pathway (insulin/SREBP-1c/ACC/FAS/ELOVL6) and the elongation of PA in HLP. The elevation of postprandial serum SA provides a mechanistic link for the development of IR and diabetes from HLP. Reduction of postprandial SA is a good candidate for improving IR. SREBP-1c is a potential better target to prevent IR and diabetes by decreasing SA.
ACKNOWLEDGMENTS
This research was supported by grants from National High Technology Research and the Development Program of China (863 program, 2010AA023002), State Key Program of National Natural Science of China (81130049), National 12th Five-Year Scientific and Technical Program of China (2012BAI02B02), and Research Fund for Innovation Talents of Science and Technology in Harbin City (2011RFQXS081).
No potential conflicts of interest relevant to this article were reported.
X.C., L.L., and H.L. wrote the manuscript and researched data. L.N. and S.L. wrote the manuscript. Y.L. and C.S. reviewed and edited the manuscript. C.S. is the guarantor of this work and, as such, had full access to all the data in the study and takes responsibility for the integrity of the data and the accuracy of the data analysis.
Footnotes
This article contains Supplementary Data online at http://diabetes.diabetesjournals.org/lookup/suppl/doi:10.2337/db12-0139/-/DC1.
REFERENCES
- 1.Saydah SH, Fradkin J, Cowie CC. Poor control of risk factors for vascular disease among adults with previously diagnosed diabetes. JAMA 2004;291:335–342 [DOI] [PubMed] [Google Scholar]
- 2.Adiels M, Olofsson SO, Taskinen MR, Borén J. Overproduction of very low-density lipoproteins is the hallmark of the dyslipidemia in the metabolic syndrome. Arterioscler Thromb Vasc Biol 2008;28:1225–1236 [DOI] [PubMed] [Google Scholar]
- 3.Bergman RN, Ader M. Free fatty acids and pathogenesis of type 2 diabetes mellitus. Trends Endocrinol Metab 2000;11:351–356 [DOI] [PubMed] [Google Scholar]
- 4.Pankow JS, Duncan BB, Schmidt MI, et al. Atherosclerosis Risk in Communities Study Fasting plasma free fatty acids and risk of type 2 diabetes: the atherosclerosis risk in communities study. Diabetes Care 2004;27:77–82 [DOI] [PubMed] [Google Scholar]
- 5.Wilding JP. The importance of free fatty acids in the development of Type 2 diabetes. Diabet Med 2007;24:934–945 [DOI] [PubMed] [Google Scholar]
- 6.Holland WL, Bikman BT, Wang LP, et al. Lipid-induced insulin resistance mediated by the proinflammatory receptor TLR4 requires saturated fatty acid-induced ceramide biosynthesis in mice. J Clin Invest 2011;121:1858–1870 [DOI] [PMC free article] [PubMed] [Google Scholar]
- 7.Summers LK, Fielding BA, Bradshaw HA, et al. Substituting dietary saturated fat with polyunsaturated fat changes abdominal fat distribution and improves insulin sensitivity. Diabetologia 2002;45:369–377 [DOI] [PubMed] [Google Scholar]
- 8.Mostad IL, Bjerve KS, Bjorgaas MR, Lydersen S, Grill V. Effects of n-3 fatty acids in subjects with type 2 diabetes: reduction of insulin sensitivity and time-dependent alteration from carbohydrate to fat oxidation. Am J Clin Nutr 2006;84:540–550 [DOI] [PubMed] [Google Scholar]
- 9.Rockett BD, Salameh M, Carraway K, Morrison K, Shaikh SR. n-3 PUFA improves fatty acid composition, prevents palmitate-induced apoptosis, and differentially modifies B cell cytokine secretion in vitro and ex vivo. J Lipid Res 2010;51:1284–1297 [DOI] [PMC free article] [PubMed] [Google Scholar]
- 10.Melanson EL, Astrup A, Donahoo WT. The relationship between dietary fat and fatty acid intake and body weight, diabetes, and the metabolic syndrome. Ann Nutr Metab 2009;55:229–243 [DOI] [PubMed] [Google Scholar]
- 11.Hunnicutt JW, Hardy RW, Williford J, McDonald JM. Saturated fatty acid-induced insulin resistance in rat adipocytes. Diabetes 1994;43:540–545 [DOI] [PubMed] [Google Scholar]
- 12.Hirabara SM, Curi R, Maechler P. Saturated fatty acid-induced insulin resistance is associated with mitochondrial dysfunction in skeletal muscle cells. J Cell Physiol 2010;222:187–194 [DOI] [PubMed] [Google Scholar]
- 13.Frangioudakis G, Garrard J, Raddatz K, Nadler JL, Mitchell TW, Schmitz-Peiffer C. Saturated- and n-6 polyunsaturated-fat diets each induce ceramide accumulation in mouse skeletal muscle: reversal and improvement of glucose tolerance by lipid metabolism inhibitors. Endocrinology 2010;151:4187–4196 [DOI] [PMC free article] [PubMed] [Google Scholar]
- 14.Roden M, Price TB, Perseghin G, et al. Mechanism of free fatty acid-induced insulin resistance in humans. J Clin Invest 1996;97:2859–2865 [DOI] [PMC free article] [PubMed] [Google Scholar]
- 15.Fedor D, Kelley DS. Prevention of insulin resistance by n-3 polyunsaturated fatty acids. Curr Opin Clin Nutr Metab Care 2009;12:138–146 [DOI] [PubMed] [Google Scholar]
- 16.Yi LZ, He J, Liang YZ, Yuan DL, Chau FT. Plasma fatty acid metabolic profiling and biomarkers of type 2 diabetes mellitus based on GC/MS and PLS-LDA. FEBS Lett 2006;580:6837–6845 [DOI] [PubMed] [Google Scholar]
- 17.Wang C, Kong H, Guan Y, et al. Plasma phospholipid metabolic profiling and biomarkers of type 2 diabetes mellitus based on high-performance liquid chromatography/electrospray mass spectrometry and multivariate statistical analysis. Anal Chem 2005;77:4108–4116 [DOI] [PubMed] [Google Scholar]
- 18.Ramkumar KM, Vijayakumar RS, Ponmanickam P, Velayuthaprabhu S, Archunan G, Rajaguru P. Antihyperlipidaemic effect of Gymnema montanum: a study on lipid profile and fatty acid composition in experimental diabetes. Basic Clin Pharmacol Toxicol 2008;103:538–545 [DOI] [PubMed] [Google Scholar]
- 19.Jula A, Marniemi J, Rönnemaa T, Virtanen A, Huupponen R. Effects of diet and simvastatin on fatty acid composition in hypercholesterolemic men: a randomized controlled trial. Arterioscler Thromb Vasc Biol 2005;25:1952–1959 [DOI] [PubMed] [Google Scholar]
- 20.Huang L, Xue J, He Y, et al. Dietary calcium but not elemental calcium from supplements is associated with body composition and obesity in Chinese women. PLoS ONE 2011;6:e27703. [DOI] [PMC free article] [PubMed] [Google Scholar]
- 21.Ricort JM, Tanti JF, Cormont M, Van Obberghen E, Le Marchand-Brustel Y. Parallel changes in Glut 4 and Rab4 movements in two insulin-resistant states. FEBS Lett 1994;347:42–44 [DOI] [PubMed] [Google Scholar]
- 22.Liu L, Li Y, Guan C, et al. Free fatty acid metabolic profile and biomarkers of isolated post-challenge diabetes and type 2 diabetes mellitus based on GC-MS and multivariate statistical analysis. J Chromatogr B Analyt Technol Biomed Life Sci 2010;878:2817–2825 [DOI] [PubMed] [Google Scholar]
- 23.Guo F, Huang C, Liao X, et al. Beneficial effects of mangiferin on hyperlipidemia in high-fat-fed hamsters. Mol Nutr Food Res 2011;55:1809–1818 [DOI] [PubMed] [Google Scholar]
- 24.Uwaifo GI, Fallon EM, Chin J, Elberg J, Parikh SJ, Yanovski JA. Indices of insulin action, disposal, and secretion derived from fasting samples and clamps in normal glucose-tolerant black and white children. Diabetes Care 2002;25:2081–2087 [DOI] [PubMed] [Google Scholar]
- 25.Belfiore F, Iannello S, Camuto M, Fagone S, Cavaleri A. Insulin sensitivity of blood glucose versus insulin sensitivity of blood free fatty acids in normal, obese, and obese-diabetic subjects. Metabolism 2001;50:573–582 [DOI] [PubMed] [Google Scholar]
- 26.Nakajima T, Tanaka N, Kanbe H, et al. Bezafibrate at clinically relevant doses decreases serum/liver triglycerides via down-regulation of sterol regulatory element-binding protein-1c in mice: a novel peroxisome proliferator-activated receptor alpha-independent mechanism. Mol Pharmacol 2009;75:782–792 [DOI] [PMC free article] [PubMed] [Google Scholar]
- 27.Lu N, Li Y, Qin H, Zhang YL, Sun CH. Gossypin up-regulates LDL receptor through activation of ERK pathway: a signaling mechanism for the hypocholesterolemic effect. J Agric Food Chem 2008;56:11526–11532 [DOI] [PubMed] [Google Scholar]
- 28.Matsumoto M, Han S, Kitamura T, Accili D. Dual role of transcription factor FoxO1 in controlling hepatic insulin sensitivity and lipid metabolism. J Clin Invest 2006;116:2464–2472 [DOI] [PMC free article] [PubMed] [Google Scholar]
- 29.Ni YG, Wang N, Cao DJ, et al. FoxO transcription factors activate Akt and attenuate insulin signaling in heart by inhibiting protein phosphatases. Proc Natl Acad Sci USA 2007;104:20517–20522 [DOI] [PMC free article] [PubMed] [Google Scholar]
- 30.Sampath H, Ntambi JM. The fate and intermediary metabolism of stearic acid. Lipids 2005;40:1187–1191 [DOI] [PubMed] [Google Scholar]
- 31.Moon YA, Shah NA, Mohapatra S, Warrington JA, Horton JD. Identification of a mammalian long chain fatty acyl elongase regulated by sterol regulatory element-binding proteins. J Biol Chem 2001;276:45358–45366 [DOI] [PubMed] [Google Scholar]
- 32.Matsuzaka T, Shimano H, Yahagi N, et al. Crucial role of a long-chain fatty acid elongase, Elovl6, in obesity-induced insulin resistance. Nat Med 2007;13:1193–1202 [DOI] [PubMed] [Google Scholar]
- 33.Shimano H, Yahagi N, Amemiya-Kudo M, et al. Sterol regulatory element-binding protein-1 as a key transcription factor for nutritional induction of lipogenic enzyme genes. J Biol Chem 1999;274:35832–35839 [DOI] [PubMed] [Google Scholar]
- 34.Postic C, Girard J. Contribution of de novo fatty acid synthesis to hepatic steatosis and insulin resistance: lessons from genetically engineered mice. J Clin Invest 2008;118:829–838 [DOI] [PMC free article] [PubMed] [Google Scholar]
- 35.Iizuka K, Bruick RK, Liang G, Horton JD, Uyeda K. Deficiency of carbohydrate response element-binding protein (ChREBP) reduces lipogenesis as well as glycolysis. Proc Natl Acad Sci USA 2004;101:7281–7286 [DOI] [PMC free article] [PubMed] [Google Scholar]
- 36.Wang Y, Botolin D, Xu J, et al. Regulation of hepatic fatty acid elongase and desaturase expression in diabetes and obesity. J Lipid Res 2006;47:2028–2041 [DOI] [PMC free article] [PubMed] [Google Scholar]
- 37.Eberlé D, Hegarty B, Bossard P, Ferré P, Foufelle F. SREBP transcription factors: master regulators of lipid homeostasis. Biochimie 2004;86:839–848 [DOI] [PubMed] [Google Scholar]
- 38.Yamashita H, Takenoshita M, Sakurai M, et al. A glucose-responsive transcription factor that regulates carbohydrate metabolism in the liver. Proc Natl Acad Sci USA 2001;98:9116–9121 [DOI] [PMC free article] [PubMed] [Google Scholar]
- 39.van den Berg SA, Guigas B, Bijland S, et al. High levels of dietary stearate promote adiposity and deteriorate hepatic insulin sensitivity. Nutr Metab (Lond) 2010;7:24. [DOI] [PMC free article] [PubMed] [Google Scholar]
- 40.Ebbesson SO, Tejero ME, López-Alvarenga JC, et al. Individual saturated fatty acids are associated with different components of insulin resistance and glucose metabolism: the GOCADAN study. Int J Circumpolar Health 2010;69:344–351 [DOI] [PMC free article] [PubMed] [Google Scholar]
- 41.Kusunoki M, Tsutsumi K, Nakayama M, et al. Relationship between serum concentrations of saturated fatty acids and unsaturated fatty acids and the homeostasis model insulin resistance index in Japanese patients with type 2 diabetes mellitus. J Med Invest 2007;54:243–247 [DOI] [PubMed] [Google Scholar]
- 42.Kennedy A, Martinez K, Chuang CC, LaPoint K, McIntosh M. Saturated fatty acid-mediated inflammation and insulin resistance in adipose tissue: mechanisms of action and implications. J Nutr 2009;139:1–4 [DOI] [PubMed] [Google Scholar]
- 43.Song MJ, Kim KH, Yoon JM, Kim JB. Activation of Toll-like receptor 4 is associated with insulin resistance in adipocytes. Biochem Biophys Res Commun 2006;346:739–745 [DOI] [PubMed] [Google Scholar]
- 44.Louheranta AM, Turpeinen AK, Schwab US, Vidgren HM, Parviainen MT, Uusitupa MI. A high-stearic acid diet does not impair glucose tolerance and insulin sensitivity in healthy women. Metabolism 1998;47:529–534 [DOI] [PubMed] [Google Scholar]
- 45.Taubes G. Insulin resistance. Prosperity’s plague. Science 2009;325:256–260 [DOI] [PubMed] [Google Scholar]
- 46.Kotronen A, Velagapudi VR, Yetukuri L, et al. Serum saturated fatty acids containing triacylglycerols are better markers of insulin resistance than total serum triacylglycerol concentrations. Diabetologia 2009;52:684–690 [DOI] [PubMed] [Google Scholar]