Abstract
The therapeutic effect of pterosin A, a small-molecular-weight natural product, on diabetes was investigated. Pterosin A, administered orally for 4 weeks, effectively improved hyperglycemia and glucose intolerance in streptozotocin, high-fat diet–fed, and db/db diabetic mice. There were no adverse effects in normal or diabetic mice treated with pterosin A for 4 weeks. Pterosin A significantly reversed the increased serum insulin and insulin resistance (IR) in dexamethasone-IR mice and in db/db mice. Pterosin A significantly reversed the reduced muscle GLUT-4 translocation and the increased liver phosphoenolpyruvate carboxyl kinase (PEPCK) expression in diabetic mice. Pterosin A also significantly reversed the decreased phosphorylations of AMP-activated protein kinase (AMPK) and Akt in muscles of diabetic mice. The decreased AMPK phosphorylation and increased p38 phosphorylation in livers of db/db mice were effectively reversed by pterosin A. Pterosin A enhanced glucose uptake and AMPK phosphorylation in cultured human muscle cells. In cultured liver cells, pterosin A inhibited inducer-enhanced PEPCK expression, triggered the phosphorylations of AMPK, acetyl CoA carboxylase, and glycogen synthase kinase-3, decreased glycogen synthase phosphorylation, and increased the intracellular glycogen level. These findings indicate that pterosin A may be a potential therapeutic option for diabetes.
Diabetes is a worldwide and national threat. The total number of people with diabetes is projected to rise from 366 million in 2011 to an estimated 552 million by 2030 (1). Diabetes is a known major risk factor for cardiovascular disease, metabolic syndrome, dyslipidemia, and end-stage renal disease (2). Patients with diabetes require optimal glycemic control and prevention of diabetes complications to improve their quality of life (3). Pharmacological therapy, as monotherapy or combination therapy, is often necessary to achieve glycemic control in the management of diabetes. However, it has been reported that neither sulfonylureas nor biguanides can significantly alter the rate of progression of hyperglycemia in type 2 diabetic patients (4). Hypoglycemia and weight gain are the main side effects of conventional insulin secretagogues sulfonylureas (5). Among the risks of the thiazolidinediones, including rosiglitazone and pioglitazone, are weight gain, edema, anemia, pulmonary edema, and congestive heart failure (5). Therefore, development of new antihyperglycemic agents with safety and effectiveness is an urgent need.
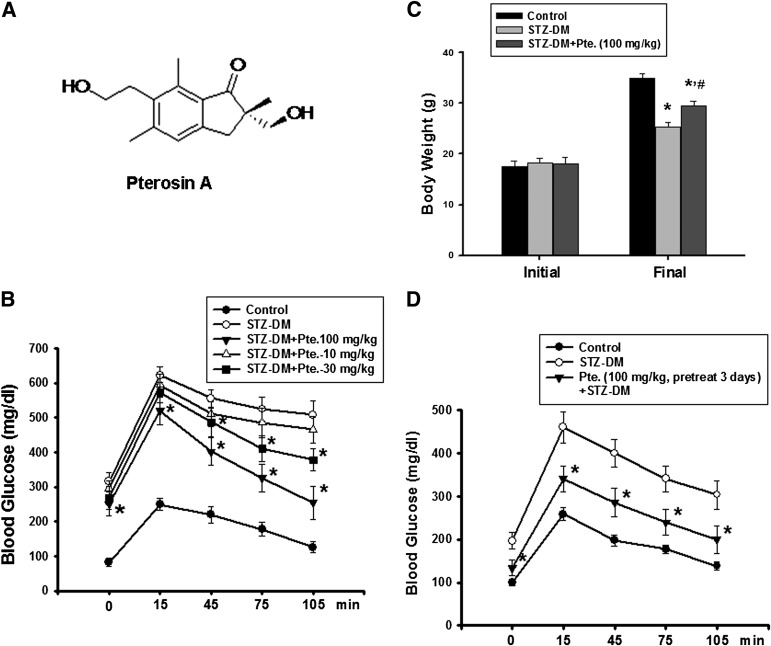
Traditional medicines derived from medicinal plants are used by ∼70% of the world’s population (6). As alternatives to synthetic chemical compounds, plants are an important source for hypoglycemic drugs, which are widely used in several systems of traditional medicine to prevent diabetes (7,8). Several fern plants have been shown to possess hypolipidemic, hypoglycemic, vascular protective, anti-inflammatory, and antinociceptive activities (9–12). Several pterosin compounds isolated from fern plants have been shown to have smooth muscle relaxant, leishmanicidal, and anticancer activities in vitro (13–15). The antidiabetic activity of pterosin compounds still remains unclear. Pterosin A, a natural product with a molecular weight of 248.3, can be isolated from several fern plants (chemical structure is shown in Fig. 1A).
FIG. 1.
A: Chemical structure of pterosin A. Effects of pterosin A on hyperglycemia, glucose intolerance, and body weight in a STZ-induced diabetic mouse (DM) model. The STZ-induced diabetic mice were orally treated with pterosin A (10–100 mg/kg) for 4 weeks, and the oral glucose tolerance test was performed (B) and the body weights were measured (C). D: Mice were pretreated with pterosin A for 3 days, STZ was injected, and the oral glucose tolerance test was performed after 1 week. Data are presented as mean ± SEM (n = 8). *P < 0.05 vs. diabetic mice without pterosin A; #P < 0.05 vs. diabetic mice alone.
Here, we investigated the effect and possible mechanism of pterosin A, which was isolated from a fern plant Hypolepis punctata (Thunb.) Mett., on glucose metabolism in diabetic animals. The antidiabetic activity of pterosin A was investigated in several diabetic mouse models. Blood glucose levels are maintained by the balance between glucose uptake by peripheral tissues and glucose secretion by the liver. We also tested the involvement of glucose uptake and gluconeogenesis-related signaling molecules in the antihyperglycemic effect of pterosin A. The results showed that the antihyperglycemic effect of pterosin A is associated with inhibited gluconeogenesis in the liver and enhanced glucose consumption in peripheral tissues.
RESEARCH DESIGN AND METHODS
Preparation of pterosin A.
The fresh whole plants of Hypolepis punctata (Thunb.) Mett. were extracted with methanol to afford the crude extracts, which were then partitioned between n-hexane, ethyl acetate, and H2O. The ethyl acetate fraction was subject to chromatographies to isolate and purify the tested compound pterosin A. The purity of pterosin A was 99.7% as determined by high-performance liquid chromatography. The structure of pterosin A (Fig. 1A) was elucidated using one- and two-dimensional nuclear magnetic resonance spectroscopy and mass spectrometry; the data are presented below:
Pterosin A: C15H20O3, m.p. 122–123°C,  −45.0° (c = 0.1, MeOH), a tan amorphous powder.
1H-NMR (Methanol-d4, 500 MHz) δ, ppm: 1.08 (s, 3H, H-10), 2.43 (s, 3H, H-15), 2.65 (s, 3H, H-14), 2.71 (d, J = 17.1 Hz, 1H, H-3), 2.98 (t, 2H, J = 7.6 Hz, H-12), 3.22 (d, J = 17.1 Hz, 1H, H-3), δ3.45 (d, J = 10.7 Hz, 1H, H-11), 3.60 (t, 2H, J = 7.6 Hz, H-13), δ3.70 (d, J = 10.7 Hz, 1H, H-11), 7.15 (s, 1H, H-5).
13C-NMR (Methanol-d4, 125 MHz) δ, ppm: 13.8 (C-14), 21.0 (C-15), 21.4 (C-10), 31.8 (C-12), 36.9 (C-3), 50.6 (C-2), 61.6 (13C), 68.2 (11C), 125.9 (C-5), 131.6 (C-9), 135.1 (C-7), 138.3 (C-8), 145.0 (C-6), 152.3 (C-4), 211.9 (C-1).
Experimental animals.
The protocols in this study were approved by the institutional animal care and use committee, and the care and use of laboratory animals were conducted in accordance with the guidelines of the animal research committee of the College of Medicine, National Taiwan University. The mice used in this study were treated humanely and with regard for alleviation of suffering.
Crj:CD-1 (ICR) mice.
Male ICR mice (4 weeks old) were purchased from the Animal Center of the College of Medicine, National Taiwan University, Taipei, Taiwan. The mice were housed five per cage under standard laboratory conditions at a constant temperature 22 ± 2°C with 12-h light/dark cycles (1).
Experimental diabetic mice.
Mice were fasted overnight and then were intraperitoneally injected with 100 mg/kg streptozotocin (STZ; Sigma). STZ was dissolved in sodium citrate buffer (pH 4.5) and injected within 15 min of preparation. One week after STZ injection, the blood glucose levels reached more than 400 mg/dL. Age-matched mice were treated with vehicle. The STZ-induced diabetic mice were then orally treated with pterosin A (10–100 mg/kg) or vehicle for 4 weeks (2).
High-fat diet (HFD)–induced diabetic mice.
The mice had free access to standard rodent chow (fat content, 2% kcal; age-matched control mice) or an HFD (fat content, 60% kcal based on lard; TestDiet, Richmond, IN) for 8 weeks and then were orally treated with pterosin A (100 mg/kg) or vehicle for 4 weeks (3).
Dexamethasone-induced insulin-resistance (IR) mouse model.
Mice were daily treated with dexamethasone (1 mg/kg, i.p.) in the presence or absence of pterosin A (100 mg/kg, oral) or metformin (300 mg/kg, oral) for 1 week. Age-matched mice were given an equal volume of normal saline.
db/db diabetic mice.
Male C57BL6 db/db mice and nondiabetic littermate control db/m mice (6 weeks old) were obtained from The Jackson Laboratory (Bar Harbor, ME). Mice were housed in a room at a constant temperature of 22 ± 2°C with 12-h light/dark cycles. Mice were orally treated with pterosin A (100 mg/kg) or vehicle for 4 weeks and then were killed by exsanguination under anesthesia after blood samples were collected. Fasting blood glucose and insulin were measured. The homeostasis model assessment IR (HOMA-IR) index was calculated as follows: fasting glucose (mmol/L) × fasting insulin (mU/L)/22.5.
Oral glucose tolerance and insulin tolerance tests.
The oral glucose tolerance test was performed as described previously (16). Mice with or without drug treatment received an oral glucose challenge (1 g/kg). Blood samples were collected before and at 15, 45, 75, and 105 min after delivery of the glucose load. The insulin tolerance test was performed after an 8-h fast, and insulin (1 unit/kg) was administered by intraperitoneal injection. Blood samples were collected from the orbital sinus of each mouse at 0, 30, and 60 min after the insulin injection.
Measurements of blood glucose and insulin.
Blood glucose levels were determined using the SURESTEP blood glucose meter (LifeScan). To measure the amount of insulin, aliquots of samples were collected from the serum at indicated intervals and analyzed by an insulin antiserum immunoassay according to the instructions of the manufacturer (Mercodia AB).
Cell culture
Rat hepatic H4-IIE cells and human hepatic HepG2 cells.
The cells were cultured in a humidified chamber with a 5% CO2 and 95% air mixture at 37°C and maintained in Dulbecco’s modified Eagle’s medium containing glucose (4.5 g/L) and l-glutamine (2 mmol/L), supplemented with 10% FBS and 1% penicillin-streptomycin.
Human primary skeletal muscle cells.
Skeletal muscle biopsy samples (∼0.2 g) were obtained from patients in the course of orthopedic surgery, with institutional ethical committee approval and informed consent, at the National Taiwan University Hospital, Taipei, Taiwan. Human myoblasts were isolated and differentiated to myotubes, as previously described (17). The cells were cultured in Ham’s F-10 supplemented with 20% FBS, 2.5 ng/mL basic fibroblastic growth factor, and 1% penicillin-streptomycin in 5% CO2 at 37°C.
Rat β-cell line RINm5F cells.
The cells were cultured in a humidified chamber with a 5% CO2 and 95% air mixture at 37°C and maintained in RPMI 1640 medium supplemented with 10% FBS and 1% penicillin-streptomycin.
Western blotting.
The experiments were performed as described previously (18). The equivalent of 30–50 μg total protein was subjected to electrophoresis on 10% SDS-polyacrylamide gels. The membrane was blocked for 1 h in PBS and 0.01% Tween-20 containing 5% nonfat dry milk and incubated with anti–GLUT-4, anti–phospho-AMP–activated protein kinase (AMPK), anti–phospho-acetyl CoA carboxylase (ACC), anti-glycogen synthase kinase 3 (GSK3)-α/β, anti–phospho-GSK3-α/β, anti-glycogen synthase (GS), anti–phospho-GS (Cell Signaling Technology), anti-phosphoenolpyruvate carboxyl kinase (PEPCK), anti-p38, anti–phospho-p38, and anti–α-tubulin (Santa Cruz Biotechnology, Inc.) antibodies. After the membranes were washed in PBS and 0.01% Tween-20, the respective secondary antibodies conjugated to horseradish peroxidase were applied for 1 h. The antibody-reactive bands were identified by enhanced chemiluminescence reagents (Amersham Pharmacia Biotech) and exposed on Kodak radiographic film.
Real-time quantitative PCR analysis.
H4-IIE cells were cultured with or without pterosin A in the presence or absence of PEPCK inducers 8-bromo-cAMP (62.5 μmol/L) and dexamethasone (62.5 nmol/L) (19) for 24 h. Total RNA was isolated from the cells with Trizol reagent. The relative mRNA expression for PEPCK was determined by real-time quantitative PCR as previously described (20). Briefly, 0.5–1 μg total RNA was used for the reverse transcription of RNA to cDNA using avian myeloblastosis virus reverse transcriptase (Promega). Each sample (2 μL cDNA) was tested with real-time SYBR Green PCR reagent (Invitrogen) with specific primers (forward and reverse [5′ to 3′]): PEPCK: GAGTGCCCATCGAAGGCAT and CCAGTGCGCCAGGTACTTG; β-actin: GCCCTAGACTTCGAGC and CTTTACGGATGTCAACGT. Amplification was performed using an ABI StepOnePlus sequence detection system (PE, Applied Biosystems), and data were analyzed using StepOne 2.1 software (Applied Biosystems).
Measurement of intracellular glycogen.
H4-IIE cells were seeded at 1 × 10⁶ cells/well in a 6-well plate and allowed to adhere and recover overnight. Cells were changed to fresh media and incubated with or without pterosin A. After 24-h treatment, intracellular glycogen was extracted as previously described (21), and the amount of glycogen was determined by a glycogen assay kit (BioVision).
Cell viability assay.
Cell proliferation was determined by a colorimetric assay using 3-(4,5-dimethyl thiazol-2-yl)-2,5-diphenyl tetrazolium bromide (MTT; Sigma). This assay measures the activity of living cells via mitochondrial dehydrogenase activity that reduces MTT to purple formazan. The formazan was solubilized by DMSO, and its absorbance at 570 nm was measured.
Measurement of glucose uptake.
A fluorescent glucose analog 2-(N-[7-nitrobenz-2-oxa-1,3-diazol-4-yl]amino)-2-deoxyglucose (2-NBDG; Invitrogen) was used to measure glucose uptake in primary human skeletal muscle cells. A total of 104 cells/well were seeded in a black 96-well tissue culture plate. Cells were washed with Krebs-Ringer buffer. Cells were preincubated for 30 min with pterosin A (10–150 μg/mL) or/and insulin (100 nmol/L) at 37°C. 2-NBDG was added at a final concentration of 100 μmol/L, the uptake proceeded for 30 min at 37°C, and then cells were washed with PBS. Fluorescence in the cells was measured at an excitation wavelength of 485 nm and an emission wavelength of 535 nm with a fluorescence microplate reader.
Measurement of nitric oxide (NO) production.
Nitrite (NO2−) concentrations in the culture supernatants were measured by the Griess reagent (Active motif), and absorbance was determined at 540 nm.
Statistical analysis.
The data are given as means ± SEM. When more than one group was compared with one control, significance was evaluated according to one-way ANOVA. Duncan’s post hoc test was applied to identify group differences. Probability values of <0.05 were considered significant.
RESULTS
Effects of pterosin A on hyperglycemia and glucose intolerance in several diabetic animal models.
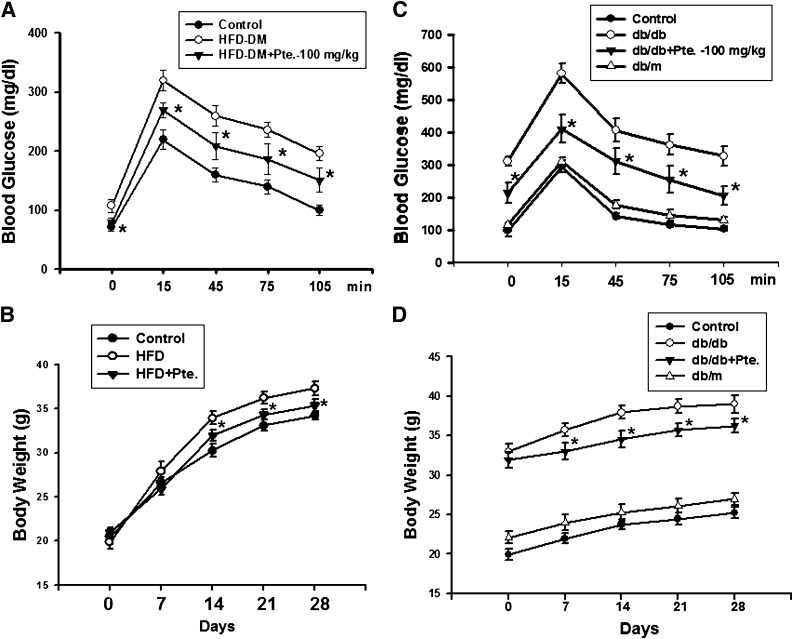
We first investigated the antihyperglycemic effects of pterosin A on several well-known mouse models of diabetes. Pterosin A (10–100 mg/kg) administered orally for 4 weeks effectively improved hyperglycemia and glucose intolerance in several diabetic mouse models, including STZ injection (Fig. 1B), HFD-fed (Fig. 2A), and db/db diabetic mice (Fig. 2C). Pretreatment with pterosin A (100 mg/kg) before STZ injection also provided protection against STZ-induced hyperglycemia (Fig. 1D). Pterosin A reversed the decreased body weight in STZ diabetic mice (Fig. 1C) and the increased body weight in HFD-fed mice (Fig. 2B) and db/db diabetic mice (Fig. 2D).
FIG. 2.
Effects of pterosin A on hyperglycemia, glucose intolerance, and body weight in HFD-fed–induced and db/db diabetic mouse models. The HFD-fed–induced (A and B) or db/db (C and D) diabetic mice were orally treated with pterosin A (100 mg/kg) for 4 weeks, oral glucose tolerance tests were performed, and body weights were measured. Data are presented as mean ± SEM (n = 8). *P < 0.05 vs. diabetic mice without pterosin A.
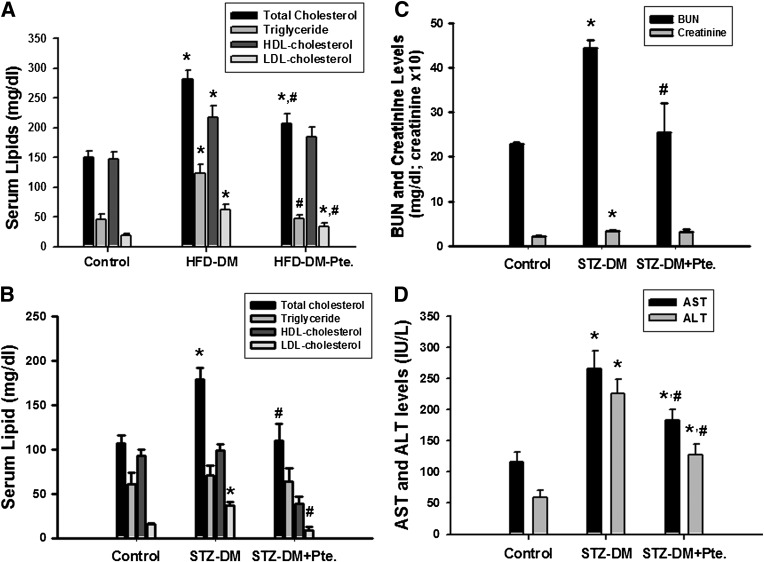
Pterosin A showed no influence on food intake in diabetic mice (data not shown). The increased serum levels of total cholesterol and LDL-cholesterol in HFD- and STZ-induced diabetic mice were also reversed by the pterosin A treatment (Fig. 3A and B). Pterosin A was capable of decreasing the increased serum blood urea nitrogen, creatinine (Fig. 3C), aspartate aminotransferase, and alanine aminotransferase levels (Fig. 3D) in STZ-induced diabetic mice. No adverse effects were observed in normal control mice treated with pterosin A (100 mg/kg) for 4 weeks, including behavior, blood pressure, heart rate, blood glucose, organ weights, blood biochemical markers, and pathological examination (data not shown). We also completed an acute oral limit test for pterosin A, at a dose of 5,000 mg/kg, and no deaths or other toxic symptoms appeared (data not shown).
FIG. 3.
Effects of pterosin A on serum levels of lipid, blood urea nitrogen (BUN), creatinine, aspartate aminotransferase (AST), and alanine aminotransferase (ALT) in HFD-fed or STZ-induced diabetic mouse (DM) models. The HFD-feeding or STZ-induced diabetic mice were orally treated with pterosin A (100 mg/kg) for 4 weeks. Serum lipids (total cholesterol, triglyceride, LDL-cholesterol, HDL-cholesterol) (A and B), BUN and creatinine (C), and AST and ALT (D) levels were measured in fasting mice. Data are presented as mean ± SEM (n = 8). *P < 0.05 vs. control. #P < 0.05 vs. STZ or HFD diabetic mice without pterosin A.
Effect of pterosin A on IR in the mouse models.
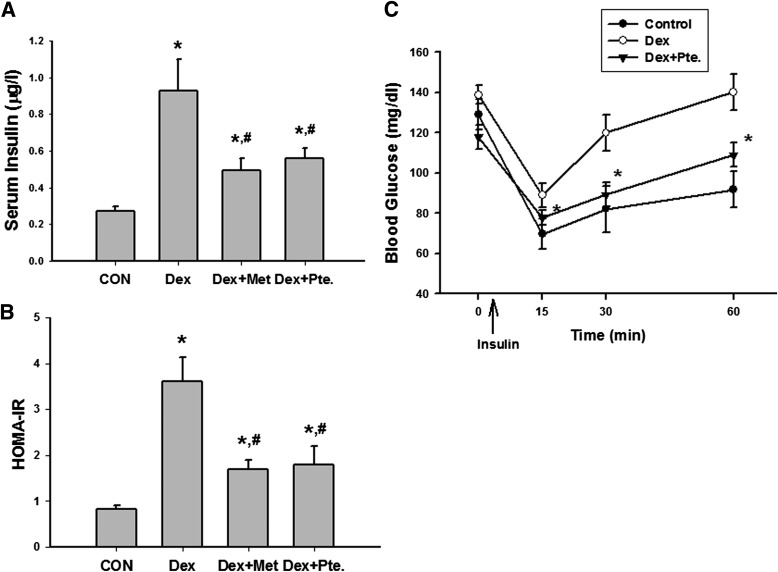
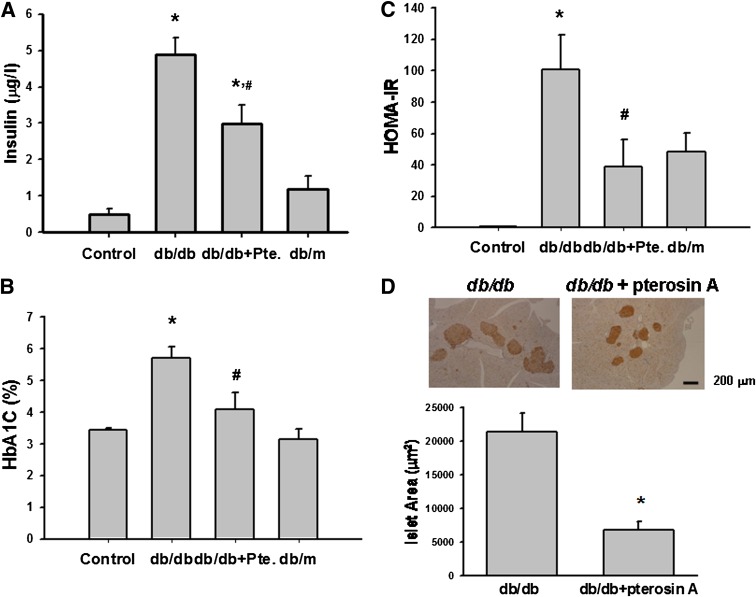
We next test the effect of pterosin A on IR in dexamethasone-treated mice and db/db diabetic mice. As shown in Fig. 4, serum insulin levels, HOMA-IR index, and insulin intolerance were increased in a dexamethasone-induced IR mouse model. Pterosin A (100 mg/kg) and metformin (300 mg/kg, as a positive control) administered orally for 1 week significantly reversed IR in the dexamethasone-treated mice. The levels of serum insulin, HbA1c, and the HOMA-IR index were markedly enhanced in db/db diabetic mice, which were also significantly reversed by the oral administration of pterosin A (100 mg/kg) for 4 weeks (Fig. 5A–C). Moreover, immunohistochemical insulin staining for islet hypertrophy showed that pterosin A treatment effectively reversed the islet hypertrophy in pancreas of db/db mice (Fig. 5D).
FIG. 4.
Effects of pterosin A on serum insulin, HOMA-IR, and insulin intolerance in a dexamethasone-induced IR mouse model. Mice were intraperitoneally treated with dexamethasone (Dex, 1 mg/kg) for 1 week and then were orally treated with pterosin A (Pte, 100 mg/kg) or metformin (Met, 300 mg/kg) for 1 week, and serum insulin (A), HOMA-IR (B), and insulin tolerance test (C) were detected. Data are presented as mean ± SEM (n = 5). *P < 0.05 vs. control. #P < 0.05 vs. dexamethasone group without pterosin A.
FIG. 5.
Effects of pterosin A on serum insulin, HbA1c, HOMA-IR index, and islet hypertrophy in db/db diabetic mice. Diabetic mice were orally treated with pterosin A (100 mg/kg) for 4 weeks, and the serum insulin (A), HbA1c (B), HOMA-IR (C), and immunohistochemical insulin staining for pancreatic islet hypertrophy (D) were detected. Data are presented as mean ± SEM (n = 8). *P < 0.05 vs. control. #P < 0.05 vs. diabetic mice without pterosin A. (A high-quality color representation of this figure is available in the online issue.)
Effects of pterosin A on glucose uptake and gluconeogenesis-related signaling molecules in diabetic mice and cultured muscle and liver cells.
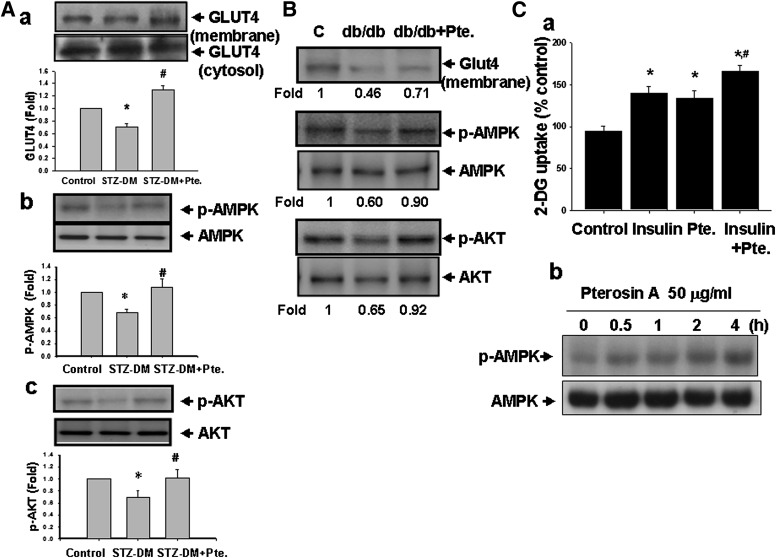
Next, we tested whether glucose uptake and gluconeogenesis-related signal molecules are involved in the effect of pterosin A. As shown in Fig. 6, pterosin A (100 mg/kg) administered orally for 4 weeks was capable of reversing the reduced GLUT-4 translocation from the cytosol to the membrane fraction and the decreased phosphorylated AMPK and phosphorylated Akt protein expressions in the skeletal muscles of STZ-induced diabetic mice (Fig. 6A) and db/db diabetic mice (Fig. 6B). Moreover, pterosin A (50 μg/mL) significantly increased 2-NBDG uptake (Fig. 6Ca) and phosphorylated AMPK expression (Fig. 6Cb) in cultured primary human skeletal muscle cells.
FIG. 6.
Effects of pterosin A on the glucose uptake–related signal proteins in skeletal muscles of diabetic mice (DM) and cultured primary human skeletal muscle cells. The STZ-induced diabetic mice (A) and db/db diabetic mice (B) were orally treated with pterosin A (100 mg/kg) for 4 weeks. A: Protein expressions of muscle GLUT-4 (a), phosphorylated AMPK (b), and phosphorylated Akt (c) were determined by Western blotting. C: Uptake of 2-NBDG (a) and phosphorylated AMPK expression (b) in cultured primary human skeletal muscle were detected. Data in A and Ca are presented as mean ± SEM (n = 4). *P < 0.05 vs. control. #P < 0.05 vs. diabetic mice without pterosin A or with pterosin A alone in cultured cells. B and Cb: Representative images of three independent experiments are shown.
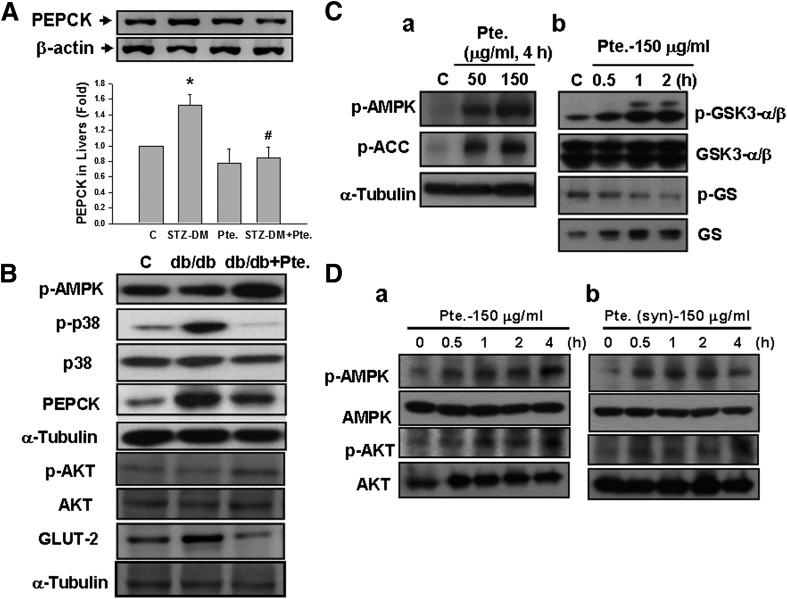
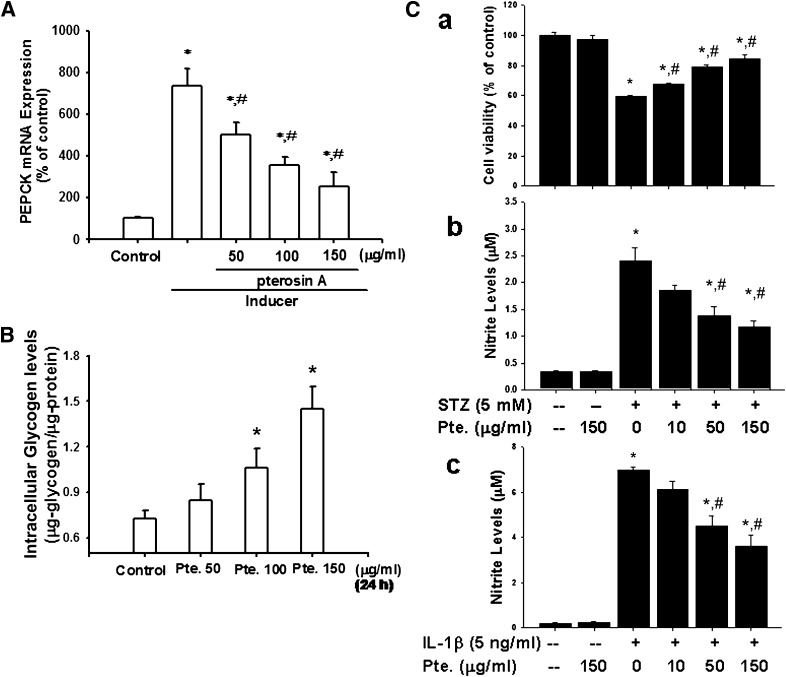
Pterosin A (100 mg/kg) was also capable of reversing the increased PEPCK expression in the livers (Fig. 7A) of STZ-induced diabetic mice. Moreover, pterosin A (100 mg/kg) reversed the reduced phosphorylations of AMPK and Akt, increased p38 phosphorylation, and increased PEPCK and GLUT-2 protein expressions in the livers of db/db diabetic mice (Fig. 7B). However, the results of in vitro studies showed that pterosin A (50–150 μg/mL) effectively triggered the phosphorylations of AMPK and its downstream signal ACC (Fig. 7Ca) and increased the GSK3-α/β phosphorylation and decreased the GS phosphorylation (Fig. 7Cb) in cultured rat hepatic cell line H4-IIE cells. Similarly, pterosin A (150 μg/mL) from a plant extract source and pterosin A (150 μg/mL) from a chemically synthesized source both effectively triggered the phosphorylations of AMPK and Akt proteins in cultured human hepatic cell line HepG2 cells (Fig. 7D). Moreover, pterosin A (50–150 μg/mL) effectively inhibited 8-bromo-cAMP/dexamethasone-enhanced PEPCK mRNA expression in a dose-dependent manner (Fig. 8A) and significantly enhanced the intracellular glycogen contents (Fig. 8B) in H4-IIE cells.
FIG. 7.
Effects of pterosin A on the liver gluconeogenesis–related signal proteins in diabetic mice (DM) and cultured liver cells. STZ-induced diabetic mice (A) and db/db diabetic mice (B) were orally treated with pterosin A (100 mg/kg) for 4 weeks. The protein expressions of liver gluconeogenesis–related signal proteins (PEPCK, phosphorylated AMPK, phosphorylated Akt, and phosphorylated p38) and GLUT-2 were determined by Western blotting. Phosphorylations of AMPK, Akt, ACC, GSK3-α/β, and GS in cultured H4-IIE (C) and HepG2 (D) liver cells treated with pterosin A (50–150 μg/mL) for 0.5–4 h were detected. Db: Pterosin A from a chemically synthesized source was used. A: Data are presented as mean ± SEM (n = 4). *P < 0.05 vs. control (C). #P < 0.05 vs. diabetic mice without pterosin A. B–D: Representative images of three independent experiments are shown.
FIG. 8.
Effects of pterosin A on PEPCK mRNA expression and intracellular glycogen in cultured liver cells and on cell viability and nitrite production in cultured β-cells. A: Hepatic H4-IIE cells were treated with pterosin A (50–150 μg/mL) in the presence or absence of PEPCK inducer for 24 h, and the expressions of PEPCK mRNA were determined by real-time PCR. B: H4-IIE cells were treated with pterosin A (50–150 μg/mL) for 24 h, and intracellular glycogen levels were measured. C: β-Cell line RINm5F cells were treated with pterosin A (10–150 μg/mL) for 24 h in the presence or absence of STZ (5 mmol/L; a, b) or interleukin (IL)-1β (5 ng/mL; c), and then the cell viability (a) and nitrite (b, c) production were measured. All data are presented as mean ± SEM of three to five independent experiments. *P < 0.05 vs. control. #P < 0.05 vs. PEPCK inducer alone or STZ alone or IL-1β alone.
Effects of pterosin A on cell viability and NO production in β-cells.
Pterosin A (10–150 μg/mL) effectively reversed the STZ-reduced cell viability and STZ-increased NO production in β-cell line RINm5F cells in a dose-dependent manner (Fig. 8Ca and b). Moreover, pterosin A (10–150 μg/mL) also significantly reversed the interleukin-1β–increased nitrite production in RINm5F cells in a dose-dependent manner (Fig. 8Cc).
DISCUSSION
In this study, we demonstrate for the first time that pterosin A, a small-molecular-weight natural product, can effectively alleviate the hyperglycemia, glucose intolerance, insulin resistance, dyslipidemia, and islet hypertrophy in diabetic mouse models. Pterosin A improves diabetes through mechanisms in the inhibition of liver gluconeogenesis and the enhancement of glucose disposal. Moreover, pterosin A can improve the decreased body weight in STZ-diabetic mice and the increased body weight in HFD-fed mice and in db/db diabetic mice, which may be attributed to the ability of pterosin A to significantly improve glucose homeostasis and insulin resistance (22,23).
Glucose homeostasis in circulation is maintained by the balance between the rate of glucose entering the circulation (glucose appearance) and the rate of glucose removal from the circulation (glucose disappearance). In a normal individual under the fed state, insulin suppresses gluconeogenesis and glycogenolysis in the liver and enhances glucose disposal in the peripheral tissues; however, in a diabetic individual, hepatic glucose production is elevated and glucose appearance exceeds glucose disappearance in the circulation, causing postprandial hyperglycemia (24). To control blood glucose levels, insulin promotes glucose uptake into adipocytes and skeletal muscle cells through an activation of a cascade of signal transduction, which stimulates GLUT-4, an insulin-responsive glucose transporter protein, from intracellular sites (cytosol) to the cell membrane (25,26). In type 2 diabetic patients, impaired glucose transport in skeletal muscles has been demonstrated to be a major factor responsible for reduced glucose uptake in whole body (27,28). Over-expression of GLUT-4 in skeletal muscles has been shown to improve glucose homeostasis in several diabetic animal models and protect against the development of diabetes (28). GLUT-4 has been suggested as a therapeutic target for pharmacological intervention strategies to control diabetic hyperglycemia (26,28).
In addition, phosphoenolpyruvate gluconeogenesis and hepatic glucose production have been found to be increased in type 2 diabetic patients (29). The excess gluconeogenesis of the fasting state has also been demonstrated to be carried over to the insulinized state, causing to glucose overproduction in type 2 diabetic patients (30). PEPCK, a rate-limiting enzyme in gluconeogenesis, is negatively regulated by insulin and is highly resistant in hyperinsulinemic diabetic models (31,32). It has been mentioned that acquired or genetic defects in insulin or other signal transduction pathways may lead to increased PEPCK gene expression and gluconeogenesis (31). Gómez-Valadés et al. (33) demonstrated that hepatic PEPCK partial silencing with RNA interference significantly lowered hyperglycemia and improved glucose tolerance in diabetic mice. Moreover, GLUT-2 is known to transport glucose across the plasma membrane of liver (34). GLUT-2 in the liver of a type 2 diabetic animal model was found to be upregulated (35).
In the current study, we found that pterosin A significantly reversed the reduced GLUT-4 translocation to membrane in the skeletal muscles and the increased protein expressions of PEPCK and GLUT-2 in the livers of diabetic mice. The in vitro studies also showed that pterosin A significantly increased glucose uptake in cultured human skeletal muscle cells and effectively inhibited 8-bromo-cAMP/dexamethasone–enhanced PEPCK mRNA expression in cultured liver cells. These results indicate that the inhibition in liver gluconeogenesis and the enhancement in muscle glucose disposal are involved in the pterosin A-induced antidiabetic action.
The intracellular AMPK signaling cascade is a cellular energy status sensor. AMPK activity is switched on when the intracellular AMP-to-ATP ratio is elevated. Activation of AMPK is known to downregulate several biosynthetic pathways, such as fatty acid synthesis and gluconeogenesis in the liver, and to switch on several catabolic pathways for ATP generation such as glucose uptake (upregulation of GLUT-4) and glycolysis (36,37). Activation of AMPK triggers intracellular metabolic changes that would be beneficial in diabetic patients, such as increased glucose uptake in muscles and other tissues, decreased glucose production in the liver, and decreased synthesis and increased fatty acid oxidation (36,37). It has been shown that p38 MAPK mediates pH-responsive induction of PEPCK mRNA in a gluconeogenic and pH-responsive renal proximal tubule-like cell line (38). Inhibition of p38 signaling has also been demonstrated to suppress gluconeogenesis along with the expressions of genes of PEPCK and glucose-6-phosphatase in the liver (39). Berasi et al. (40) have demonstrated that AMPK activation inhibits gluconeogenesis through an early growth response 1–activated dual-specificity protein phosphatase 4–inhibited p38 MAPK pathway in the hepatocyte cell lines. In addition, Horike et al. (41) showed that activation of AMPK could trigger the inactivation of GSK3-β by phosphorylation (Ser-9), and further reduced cAMP-response element-binding protein (CREB) phosphorylation (Ser-129) and PEPCK gene expression in the liver (41).
GSK3 inhibition has also been found to improve oral glucose disposal by increasing liver glycogen synthesis in a type 2 diabetic rat model (42). A selective GSK3 inhibitor, L803-mts, has also been shown to suppress CREB-regulated PEPCK gene expression, increase the intracellular glycogen level in the liver, and upregulate GLUT-4 expression in the skeletal muscle of ob/ob diabetic mice (43).
However, AMPK-regulated ACC inhibition reduces malonyl CoA content and subsequently leads to reduced fatty acids synthesis and increased mitochondrial fatty acid oxidation in the liver (35,36). In the current study, we found that pterosin A significantly reversed the decreased phosphorylated AMPK and phosphorylated Akt in the muscles of STZ-induced and db/db diabetic mice. Pterosin A also effectively reversed the decreased AMPK, increased phospho-p38, and increased PEPCK expressions in the livers of db/db diabetic mice. In cultured human skeletal muscle cells, pterosin A markedly increased the phosphorylation of AMPK. In vitro study in liver cells also showed that pterosin A inhibits 8-bromo-cAMP/dexamethasone-enhanced PEPCK mRNA expression, triggers the phosphorylations of AMPK and GSK3, decreases the phosphorylation of glycogen synthase, and increases intracellular glycogen levels. Pterosin A suppressed lipogenic enzyme-ACC activity in the liver cells that may lead to decreased lipogenesis. These results suggest that an AMPK-related signaling pathway is involved in the antidiabetic activity by pterosin A.
Diabetes is known a metabolic disorder and is complicated by multiorgan deterioration. The increasing evidence has suggested that oxidative stress and inflammation may play major roles in diabetes complications (44). Obesity has been shown to be associated with a state of chronic low-level inflammation (45). It has been found that the production of reactive oxygen species (ROS) is elevated in obesity, which may further activate the inflammatory pathways (46). An association of early diabetic nephropathy with increased intrarenal NO generation has been suggested (47). NO has also been found to contribute to cytokine-induced pancreatic β-cell apoptosis through the pathways of Jun NH2-terminal kinase activation and Akt suppression (48). However, Liu et al. (49) have suggested that apoptosis and necrosis are both involved in the β-cell death induced by cytokines in which apoptosis is mostly NO-independent, whereas necrosis is NO-dependent. It has been indicated that antioxidants could decrease diabetes complications by protecting from oxidative stress (50). In the current study, we found that pterosin A is capable of decreasing the increased serum levels of blood urea nitrogen and creatinine (markers of renal function) and aspartate aminotransferase and alanine aminotransferase (markers of liver function) in STZ-induced diabetic mice, indicating that pterosin A possesses hepatorenal protective action during diabetes. Moreover, in vitro study in cultured β-cells showed that pterosin A effectively reversed STZ-reduced cell viability, STZ-increased NO production, and interleukin-1β–increased NO production. These results imply that pterosin A may protect pancreatic β-cells from NO-induced cell damage. However, whether pterosin A can decrease diabetes complications by protecting from oxidative stress needs to be clarified in the future.
In conclusion, pterosin A reverses the reduced GLUT-4 translocation from cytosol to membrane in skeletal muscle and the increased PEPCK expression in the liver of diabetic mice. An AMPK-regulated signaling pathway is involved in the activation of muscle GLUT-4 and inhibition of liver PEPCK expression by pterosin A. Moreover, pterosin A also increases GSK3 phosphorylation and decreases the GS phosphorylation that further enhances intracellular glycogen synthesis in liver cells. We also found that pterosin A effectively reversed islet hypertrophy in db/db mice; however, the mechanism needs to be clarified in the future. Taken together, the pterosin A-induced antidiabetic activity is associated with inhibited gluconeogenesis in the liver and enhanced glucose consumption in peripheral tissues. These findings also indicate that pterosin A may be a potential therapeutic option for diabetes.
ACKNOWLEDGMENTS
This study was supported by a grant from the National Science Council of Taiwan (NSC 99-2323-B-002-007).
No potential conflicts of interest relevant to this article were reported.
F.-L.H. prepared and provided the testing samples, analyzed the research data, and contributed to discussion. C.-F.H. and Y.-W.C. collected and analyzed the research data and contributed to discussion. Y.-P.Y., C.-T.W., B.-J.U., and R.-S.Y. prepared and analyzed the testing samples. S.-H.L. designed the experiments and wrote, reviewed, and edited the manuscript. F.-L.H. and S.-H.L. are the guarantors of this work, and, as such, had full access to all the data in the study and take responsibility for the integrity of data and the accuracy of data analysis.
REFERENCES
- 1.Unwin N, Whiting D, Guariguata L, Ghyoot G, Gan D, Eds. IDF Diabetes Atlas 5th Ed. Brussels, Belgium, International Diabetes Federation. 2011. Available from http://www.idf.org/diabetesatlas Accessed 11 April 2012.
- 2.Martinez-Hervas S, Romero P, Hevilla EB, et al. Classical cardiovascular risk factors according to fasting plasma glucose levels. Eur J Intern Med 2008;19:209–213 [DOI] [PubMed] [Google Scholar]
- 3.Lasker RD. The diabetes control and complications trial. Implications for policy and practice. N Engl J Med 1993;329:1035–1036 [DOI] [PubMed] [Google Scholar]
- 4.Krentz AJ, Bailey CJ. Oral antidiabetic agents: current role in type 2 diabetes mellitus. Drugs 2005;65:385–411 [DOI] [PubMed] [Google Scholar]
- 5.Cheng AY, Fantus IG. Oral antihyperglycemic therapy for type 2 diabetes mellitus. CMAJ 2005;172:213–226 [DOI] [PMC free article] [PubMed] [Google Scholar]
- 6.Mishra R, Shuaib M. Shravan, Mishra PS. A review on herbal antidiabetic drugs. J App Pharm Sci 2011;1:235–237 [Google Scholar]
- 7.Jarald E, Joshi SB, Jain DC. Diabetes and herbal medicines. Iran J Pharm Ther 2008;7:97–106 [Google Scholar]
- 8.Wais M, Nazish I, Samad A, et al. Herbal drugs for diabetic treatment: an updated review of patents. Recent Pat Antiinfect Drug Discov 2012;7:53–59 [DOI] [PubMed] [Google Scholar]
- 9.Ajikumaran Nair S, Shylesh BS, Gopakumar B, Subramoniam A. Anti-diabetes and hypoglycaemic properties of Hemionitis arifolia (Burm.) Moore in rats. J Ethnopharmacol 2006;106:192–197 [DOI] [PubMed] [Google Scholar]
- 10.Chen J, Chen X, Lei Y, et al. Vascular protective potential of the total flavanol glycosides from Abacopteris penangiana via modulating nuclear transcription factor-κB signaling pathway and oxidative stress. J Ethnopharmacol 2011;136:217–223 [DOI] [PubMed] [Google Scholar]
- 11.Haider S, Nazreen S, Alam MM, Gupta A, Hamid H, Alam MS. Anti-inflammatory and anti-nociceptive activities of ethanolic extract and its various fractions from Adiantum capillus veneris Linn. J Ethnopharmacol 2011;138:741–747 [DOI] [PubMed] [Google Scholar]
- 12.Lei YF, Chen JL, Wei H, Xiong CM, Zhang YH, Ruan JL. Hypolipidemic and anti-inflammatory properties of Abacopterin A from Abacopteris penangiana in high-fat diet-induced hyperlipidemia mice. Food Chem Toxicol 2011;49:3206–3210 [DOI] [PubMed] [Google Scholar]
- 13.Sheridan H, Frankish N, Farrell R. Smooth muscle relaxant activity of pterosin Z and related compounds. Planta Med 1999;65:271–272 [DOI] [PubMed] [Google Scholar]
- 14.Takahashi M, Fuchino H, Sekita S, Satake M. In vitro leishmanicidal activity of some scarce natural products. Phytother Res 2004;18:573–578 [DOI] [PubMed] [Google Scholar]
- 15.Ouyang DW, Ni X, Xu HY, Chen J, Yang PM, Kong DY. Pterosins from Pteris multifida. Planta Med 2010;76:1896–1900 [DOI] [PubMed] [Google Scholar]
- 16.Huang CF, Chen YW, Yang CY, et al. Extract of lotus leaf (Nelumbo nucifera) and its active constituent catechin with insulin secretagogue activity. J Agric Food Chem 2011;59:1087–1094 [DOI] [PubMed] [Google Scholar]
- 17.Yen YP, Tsai KS, Chen YW, Huang CF, Yang RS, Liu SH. Arsenic inhibits myogenic differentiation and muscle regeneration. Environ Health Perspect 2010;118:949–956 [DOI] [PMC free article] [PubMed] [Google Scholar]
- 18.Chen YW, Huang CF, Tsai KS, et al. The role of phosphoinositide 3-kinase/Akt signaling in low-dose mercury-induced mouse pancreatic β-cell dysfunction in vitro and in vivo. Diabetes 2006;55:1614–1624 [DOI] [PubMed] [Google Scholar]
- 19.Sasaki K, Cripe TP, Koch SR, et al. Multihormonal regulation of phosphoenolpyruvate carboxykinase gene transcription. The dominant role of insulin. J Biol Chem 1984;259:15242–15251 [PubMed] [Google Scholar]
- 20.Lu TH, Hsieh SY, Yen CC, et al. Involvement of oxidative stress-mediated ERK1/2 and p38 activation regulated mitochondria-dependent apoptotic signals in methylmercury-induced neuronal cell injury. Toxicol Lett 2011;204:71–80 [DOI] [PubMed] [Google Scholar]
- 21.Ryu HS, Park SY, Ma D, Zhang J, Lee W. The induction of microRNA targeting IRS-1 is involved in the development of insulin resistance under conditions of mitochondrial dysfunction in hepatocytes. PLoS ONE 2011;6:e17343. [DOI] [PMC free article] [PubMed] [Google Scholar]
- 22.Swanston-Flatt SK, Day C, Bailey CJ, Flatt PR. Traditional plant treatments for diabetes. Studies in normal and streptozotocin diabetic mice. Diabetologia 1990;33:462–464 [DOI] [PubMed] [Google Scholar]
- 23.Lazar MA. How obesity causes diabetes: not a tall tale. Science 2005;307:373–375 [DOI] [PubMed] [Google Scholar]
- 24.Aronoff SL, Berkowitz K, Shreiner B, Want L. Glucose metabolism and regulation: beyond insulin and glucagon. Diabetes Spectr 2004;17:183–190 [Google Scholar]
- 25.Klip A. The many ways to regulate glucose transporter 4. Appl Physiol Nutr Metab 2009;34:481–487 [DOI] [PubMed] [Google Scholar]
- 26.Morgan BJ, Chai SY, Albiston AL. GLUT4 associated proteins as therapeutic targets for diabetes. Recent Pat Endocr Metab Immune Drug Discov 2011;5:25–32 [DOI] [PubMed] [Google Scholar]
- 27.Zierath JR, He L, Gumà A, Odegoard Wahlström E, Klip A, Wallberg-Henriksson H. Insulin action on glucose transport and plasma membrane GLUT4 content in skeletal muscle from patients with NIDDM. Diabetologia 1996;39:1180–1189 [DOI] [PubMed] [Google Scholar]
- 28.Wallberg-Henriksson H, Zierath JR. GLUT4: a key player regulating glucose homeostasis? Insights from transgenic and knockout mice (review). Mol Membr Biol 2001;18:205–211 [DOI] [PubMed] [Google Scholar]
- 29.Consoli A, Nurjhan N, Capani F, Gerich J. Predominant role of gluconeogenesis in increased hepatic glucose production in NIDDM. Diabetes 1989;38:550–557 [DOI] [PubMed] [Google Scholar]
- 30.Gastaldelli A, Toschi E, Pettiti M, et al. Effect of physiological hyperinsulinemia on gluconeogenesis in nondiabetic subjects and in type 2 diabetic patients. Diabetes 2001;50:1807–1812 [DOI] [PubMed] [Google Scholar]
- 31.Friedman JE, Sun Y, Ishizuka T, et al. Phosphoenolpyruvate carboxykinase (GTP) gene transcription and hyperglycemia are regulated by glucocorticoids in genetically obese db/db transgenic mice. J Biol Chem 1997;272:31475–31481 [DOI] [PubMed] [Google Scholar]
- 32.Quinn PG, Yeagley D. Insulin regulation of PEPCK gene expression: a model for rapid and reversible modulation. Curr Drug Targets Immune Endocr Metabol Disord 2005;5:423–437 [DOI] [PubMed] [Google Scholar]
- 33.Gómez-Valadés AG, Vidal-Alabró A, Molas M, et al. Overcoming diabetes-induced hyperglycemia through inhibition of hepatic phosphoenolpyruvate carboxykinase (GTP) with RNAi. Mol Ther 2006;13:401–410 [DOI] [PubMed] [Google Scholar]
- 34.Burcelin R, Dolci W, Thorens B. Glucose sensing by the hepatoportal sensor is GLUT2-dependent: in vivo analysis in GLUT2-null mice. Diabetes 2000;49:1643–1648 [DOI] [PubMed] [Google Scholar]
- 35.Slieker LJ, Sundell KL, Heath WF, et al. Glucose transporter levels in tissues of spontaneously diabetic Zucker fa/fa rat (ZDF/drt) and viable yellow mouse (Avy/a). Diabetes 1992;41:187–193 [DOI] [PubMed] [Google Scholar]
- 36.Hardie DG. Minireview: the AMP-activated protein kinase cascade: the key sensor of cellular energy status. Endocrinology 2003;144:5179–5183 [DOI] [PubMed] [Google Scholar]
- 37.Hardie DG. The AMP-activated protein kinase pathway—new players upstream and downstream. J Cell Sci 2004;117:5479–5487 [DOI] [PubMed] [Google Scholar]
- 38.Feifel E, Obexer P, Andratsch M, et al. p38 MAPK mediates acid-induced transcription of PEPCK in LLC-PK(1)-FBPase(+) cells. Am J Physiol Renal Physiol 2002;283:F678–F688 [DOI] [PubMed] [Google Scholar]
- 39.Cao W, Collins QF, Becker TC, et al. p38 Mitogen-activated protein kinase plays a stimulatory role in hepatic gluconeogenesis. J Biol Chem 2005;280:42731–42737 [DOI] [PubMed] [Google Scholar]
- 40.Berasi SP, Huard C, Li D, et al. Inhibition of gluconeogenesis through transcriptional activation of EGR1 and DUSP4 by AMP-activated kinase. J Biol Chem 2006;281:27167–27177 [DOI] [PubMed] [Google Scholar]
- 41.Horike N, Sakoda H, Kushiyama A, et al. AMP-activated protein kinase activation increases phosphorylation of glycogen synthase kinase 3β and thereby reduces cAMP-responsive element transcriptional activity and phosphoenolpyruvate carboxykinase C gene expression in the liver. J Biol Chem 2008;283:33902–33910 [DOI] [PMC free article] [PubMed] [Google Scholar]
- 42.Cline GW, Johnson K, Regittnig W, et al. Effects of a novel glycogen synthase kinase-3 inhibitor on insulin-stimulated glucose metabolism in Zucker diabetic fatty (fa/fa) rats. Diabetes 2002;51:2903–2910 [DOI] [PubMed] [Google Scholar]
- 43.Kaidanovich-Beilin O, Eldar-Finkelman H. Long-term treatment with novel glycogen synthase kinase-3 inhibitor improves glucose homeostasis in ob/ob mice: molecular characterization in liver and muscle. J Pharmacol Exp Ther 2006;316:17–24 [DOI] [PubMed] [Google Scholar]
- 44.Huerta MG, Nadler JL. Oxidative stress, inflammation, and diabetic complications. In Diabetes Mellitus: A Fundamental and Clinical Text. LeRoith D, Taylor SI, Olefsky JM, Eds. Philadelphia, Lippincott Williams & Wilkins, 2004, p. 1485–1501 [Google Scholar]
- 45.Wellen KE, Hotamisligil GS. Inflammation, stress, and diabetes. J Clin Invest 2005;115:1111–1119 [DOI] [PMC free article] [PubMed] [Google Scholar]
- 46.Furukawa S, Fujita T, Shimabukuro M, et al. Increased oxidative stress in obesity and its impact on metabolic syndrome. J Clin Invest 2004;114:1752–1761 [DOI] [PMC free article] [PubMed] [Google Scholar]
- 47.Prabhakar SS. Role of nitric oxide in diabetic nephropathy. Semin Nephrol 2004;24:333–344 [DOI] [PubMed] [Google Scholar]
- 48.Størling J, Binzer J, Andersson AK, et al. Nitric oxide contributes to cytokine-induced apoptosis in pancreatic beta cells via potentiation of JNK activity and inhibition of Akt. Diabetologia 2005;48:2039–2050 [DOI] [PubMed] [Google Scholar]
- 49.Liu D, Pavlovic D, Chen MC, Flodström M, Sandler S, Eizirik DL. Cytokines induce apoptosis in beta-cells isolated from mice lacking the inducible isoform of nitric oxide synthase (iNOS-/-). Diabetes 2000;49:1116–1122 [DOI] [PubMed] [Google Scholar]
- 50.Maxwell SR. Prospects for the use of antioxidant therapies. Drugs 1995;49:345–361 [DOI] [PubMed] [Google Scholar]


