

Abstract
Background
BRM (Brahma homologue) is well known for its critical role in tumor suppression and cancer development. Genetic variations in the promoter region of BRM have been suggested to be associated with loss of BRM expression and lung cancer risk. To the authors’ knowledge, no study on the role of BRM genetic polymorphisms in hepatocellular carcinoma (HCC) risk has been performed.
Methodology/Principal Findings
In two independent case-control studies containing 796 HCC cases and 806 cancer-free individuals, we genotyped two putative functional insertion/deletion (indel) polymorphisms [BRM-1321 (rs3832613) and BRM-741 (rs34480940)] within promoter region of BRM in Chinese populations using a PCR-based method. Real-time RT-PCR analysis was used to explore the genotype-phenotype correlation between these polymorphisms and BRM expression in both tissue samples and HCC cell lines. Logistic regression analysis showed that compared to BRM-1321del/del genotype, the ins/del and ins/ins variant genotypes had an increased HCC risk [adjusted odds ratio (OR) = 1.47, 95% confidence interval (CI) = 1.19–1.82; adjusted OR = 2.55, 95% CI = 1.75–3.72, respectively]. No significant association between BRM-741 and HCC incidence was observed. However, stratification analysis revealed a significant association between ins/ins genotype of BRM-741 and increased HCC susceptibility in smokers (adjusted OR = 2.07, 95% CI = 1.33–3.22). Quantitative PCR analyses demonstrated that the genotypes of BRM-1321 and the corresponding haplotypes were significantly correlated with BRM expression in vivo. Compared with ins/ins genotype, subjects carrying ins/del and del/del genotype had 2.30 and 4.99 fold higher BRM expression in HCC tissue samples, respectively. Similar trends were observed in western blot analysis at protein level.
Conclusions/Significance
Our findings suggest that BRM promoter polymorphism (BRM-1321) could regulate BRM expression and may serve as a potential marker for genetic susceptibility to HCC.
Introduction
Hepatocellular carcinoma (HCC) is the most common primary malignancy of liver and its mortality rate is the third highest among the most common cancers [1]. Over 80% of HCC cases are from the Asian and African continents, and more than 50% of cases are from mainland China [2]. Epidemiological and clinical studies have demonstrated that the major risk factors for HCC include alcoholism, hepatitis B virus (HBV) and hepatitis C (HCV), aflatoxin, liver cirrhosis [3], [4]. As the important carcinogen for HCC, HBV infection has become a significant public health problem in China [5]. Accumulated evidences from molecular genetics indicate that individual’s genetic and epigenetic factors are involved in their susceptibility to HCC [3]. Recent genome wide association studies (GWAS) have also identified several new susceptibility loci for HCC [6], which is helpful to predict individual and population risk and clarify pathophysiologic mechanisms relevant to HCC. However, to date, the molecular carcinogenic mechanism of HCC is still not fully elucidated.
The SWI/SNF (Switch/sucrose non-fermentable) complexes mediate chromatin remodeling processes in an ATP-dependent manner that is essential for gene expression, cell cycle control, differentiation, proliferation and DNA repair [7]. The mammalian complexes are comprised of a highly related family of multi-subunit complexes and play critical roles in tumor suppression [8]. Emerging evidence indicates that BRM (Brahma homologue), a key SWI/SNF complex subunit, is silenced in 15–20% of various solid tumors [9]. Recurrent mutations in subunits of the complex have been identified in many cancers including lung cancer and breast cancer, providing a novel link between chromatin remodeling and tumorgenesis [10], [11]. In addition, BRM has been found preferentially expressed in human liver [12]. Therefore, there is such possibility that the genetic polymorphisms in these subunit genes and their interactions with environmental factors may alter the susceptibility to HCC. However, there are no related studies concerning the association between BRM genetic variations and HCC incidence.
Recently, two insertion/deletion (indel) polymorphisms have newly identified in the promoter region (−1321 bp and −741 bp upstream of the BRM transcription start site, i.e. rs3832613 and rs34480940) of BRM and have been proved to be associated with loss of BRM expression and lung cancer risk [13]. Moreover, in-silico analysis has also revealed that these indels are located within the binding site of putative transcription factor (i.e. myocyte enhancer factor-2) [13]. Thus, we hypothesized that these novel indel variations in the promoter region of BRM were associated with altered BRM expression and HCC risk. In the current study, we conducted two independent case-control studies in Chinese populations to investigate the associations between these two indel polymorphisms and HCC risk. Consecutive functional assays were used to assess the possible functional significance of these polymorphisms.
Materials and Methods
Ethics Statement
This study was approved by the Ethical Committee of Soochow University. Written informed consent was obtained from each participant before investigation.
Study Populations
Our study included two independent case-control sets containing 796 newly diagnosed incident HCC cases and 806 cancer-free controls who were genetically unrelated ethnic Han Chinese. For the first case control set (panel I), 408 HCC patients were recruited from May 2007 to July 2010 at the affiliated hospitals of Soochow University. In the second case control set (panel II), 388 HCC patients were recruited from March 2005 to October 2010 at the affiliated hospital of Nanjing Medical University. None of these HCC patients had received any medical treatment. The diagnosis of the cases, the inclusion and exclusion criteria for the cases and controls, and the classification of smoking and drinking status were previously described [14]–[16]. Controls with frequency-matched age (±5 years) and sex were cancer-free individuals selected from a community nutritional survey that was conducted in the same regions during the same period as recruitment of HCC patients. Genomic DNA was extracted from the peripheral blood of cases and controls. Tumor stages were determined according to a modified American Joint Committee on Cancer (AJCC) and international union against cancer (UICC) standard. Each subject was interviewed in-person using a structured questionnaire to obtain information on demographic data and related risk factors, including smoking and drinking status. All participants were negative for antibodies to hepatitis C virus, hepatitis D virus or HIV.
For functional assay, additional 72 tumor tissues and adjacent non-tumor tissues from patients with a diagnosis of HCC were collected according to the availability of frozen stored tissue from HCC resections from June 2004 to May 2006 at Department of General Surgery, the First Affiliated Hospital of Soochow University. All cases had histological confirmation of their tumor diagnosis and none of these patients had received any preoperative chemotherapy or radiotherapy. After surgical resection, the fresh tissues were immediately stored at −80°C until the DNA/RNA/protein extraction for the current study.
DNA Extraction and Genotyping
Genomic DNA of blood samples, tissues and hepatoma cell lines were isolated using genomic DNA purification kit (Qiagen). DNA fragments containing rs34480940 and rs3832613 were amplified with two pairs of genotyping primers (BRM-741-F: 5′-TTGTGCCCGCCTCCCTTTTC-3′, BRM-741-R: 5′-GGCTCCGAGTGGCACCAAAG-3′, BRM-1321-F: 5′-GGGAAGAATCCTCAACCAGATAGTC-3′, BRM-1321-R: 5′-GTTTTATGAAGTGTGAAAGAATGTTAGG-3′), respectively. The PCR products were analyzed by 7% non-denaturing polyacrylamide gel electrophoresis and visualized by silver staining [17]. The genotypes were determined by the numbers and the length of the band(s) in the gels. To validate the genotyping method, we also analyzed 50 randomly selected DNA samples by direct sequencing. The coincidence rate of these two methods was 100%, suggesting that the PCR-based method was reliable. Approximately 10% of the samples were randomly selected and examined in duplicates by independent researchers, and the reproducibility was 100%.
Real-time RT-PCR Analysis
The Hep3B, Huh-7, sk-Hep-1 and SMMC-7721 hepatoma cell lines were obtained directly from Shanghai Cell Bank of Chinese Academy of Sciences and cultured in Dulbecco’s Modified Eagle’s Medium supplemented with 10% fetal bovine serum (FBS) and 1% penicillin-streptomycin at 37°C in a humidified 5% CO2 incubator. The cell lines were characterized at the bank using short tandem repeat (STR)-based fingerprinting analysis except SMMC-7721. All cell lines were used within three months of thawing fresh vials. Total RNA was isolated from tissue specimens and cell lines using RNA isolation kit of Qiagen and then converted to cDNA using random primers and Superscript II (Invitrogen). A SYBR® Green gene expression assay was performed using Roche LightCycler® 480 to quantify relative BRM expression in these samples. GAPDH was chosen as the internal control. Primer sequences used for BRM and GAPDH were as follow: BRM-F: 5′-GATTGTAGAAGACATCCATTGTGG-3′, BRM-R: 5′-GACATATAACCTTGGCTGTGTTGA-3′, GAPDH-F: 5′-CTCTCTGCTCCTCCTGTTCGAC-3′, GAPDH-R: 5′-TGAGCGATGTGGCTCGGCT-3′. Negative controls consisted of distilled H2O. The expression levels of BRM were normalized with GAPDH using a 2−ΔΔCT method. In all cases, the relative lower BRM expression group was used as calibrator (fold change = 1). A melting curve analysis was performed for the PCR products to evaluate primer specificity.
Western Blot
To further investigate the correlation between BRM-1321 genotype and BRM protein level, 3 randomly selected HCC tumor tissues and adjacent non-tumor tissues with different genotypes or haplotypes were analyzed by western blot. Approximately 40 µg of protein extract from tissues samples were separated on 8% polyacrylamide gel. Proteins were transferred to a PVDF membrane (GE Healthcare) and probed with primary antibodies against BRM (1∶500, Santa Cruz Biotechnology) and GAPDH (1∶1000, Santa Cruz Biotechnology). The primary antibodies were detected by horseradish peroxidase (HRP)-conjugated secondary antibodies (1∶1000, Santa Cruz Biotechnology). Films were exposed in dark room using an enhanced chemiluminescence system (ECL, Cell Signaling Technologies).
Statistical Analysis
The Hardy-Weinberg equilibrium was analyzed using χ2 test. Unconditional logistic regression was used to assess the associations between the indel polymorphisms and HCC risk, adjusted by sex, age, smoking, drinking and HBV infection status. In the stratification analysis, we assessed the main effect of the indel polymorphisms in each subgroup and the possible interaction between polymorphisms and selected variables on cancer risk. A multiplicative interaction was suggested when OR11> OR10 × OR01, in which OR11 is the OR when both factors were present, OR01 is the OR when only factor 1 was present and OR10 is the OR when only factor 2 was present to evaluate the possible gene-environment interactions on HCC risk. The P values of test for the multiplicative interaction between the two indel polymorphisms and selected variables on cancer risk were calculated using unconditional logistic regression model. Due to relative small sample size, former smoker and current smoker, light drinker and heavy drinker were integrated into one group in stratification analysis, respectively. Haplotype frequencies as well as linkage disequilibrium (LD) were estimated from genotype data using the SHESIS program with default parameters [18]. The normalized expression values of BRM in HCC tumor tissue and adjacent non-tumor tissue samples were compared using the paired t test. The normalized expression levels of BRM among different genotype or haplotype groups were compared using one way ANOVA. These statistical analyses were implemented in Statistic Analysis System software (version 8.0, SAS Institute). P<0.05 was used as the criterion of statistical significance, and all statistical tests were two sided.
Results
The Associations of BRM Indel Polymorphisms with HCC Susceptibility
The demographic characteristics of the 796 HCC patients and 806 controls from two independent case-control sets were summarized in Table 1. There were no statistically significant differences in terms of the frequency distribution of sex, age, smoking and drinking status, suggesting that the frequency matching was adequate. Approximately 71.4% of the cases and 13.4% of the controls were HBsAg-positive, in accordance with the fact that HBV infection was a major risk factor for HCC. Example output from sequencing and genotyping assays of two polymorphisms were shown in Figure 1. The observed genotype frequencies for the two indel polymorphisms were consistent with those expected from the Hardy-Weinberg equilibrium in both cases and controls (all P values >0.05).
Table 1. Demographic characteristics among HCC cases and controls.
| Overall | Panel I | Panel II | |||||||
| Characteristics | Case (n = 796) | Control (n = 806) | P | Case (n = 408) | Control (n = 408) | P | Case (n = 388) | Control (n = 398) | P |
| Age(mean±SD) | 51.9±11.8 | 51.5±11.7 | 0.38a | 53.0±12.5 | 52.1±11.9 | 0.30a | 49.2±10.7 | 50.5±11.5 | 0.42a |
| Gender, N (%) | |||||||||
| Male | 529(66.5) | 535(66.4) | 0.97b | 274(67.2) | 272(66.7) | 0.88b | 255(65.7) | 263(66.1) | 0.92b |
| Female | 267(33.5) | 271(33.6) | 134(32.8) | 136(33.3) | 133(34.3) | 135(33.9) | |||
| Smoking Status | |||||||||
| Nonsmokers | 462(58.0) | 455(56.5) | 0.81b | 241(59.1) | 237(58.1) | 0.95b | 221(57.0) | 218(54.8) | 0.80b |
| Former Smokers | 170(21.4) | 180(22.3) | 85(20.8) | 86(21.1) | 85(21.9) | 94(23.6) | |||
| Current smoker | 164(20.6) | 171(21.2) | 82(20.1) | 85(20.8) | 82(21.1) | 86(21.6) | |||
| Drinking status | |||||||||
| Nondrinker | 412(51.8) | 429(53.2) | 0.84b | 211(51.7) | 214(52.5) | 0.97b | 201(51.8) | 215(54.0) | 0.80b |
| Light Drinker | 291(36.6) | 285(35.4) | 152(37.3) | 151(37.0) | 139(35.8) | 134(33.7) | |||
| Heavy Drinker | 93(11.7) | 92(11.4) | 45(11.0) | 43(10.5) | 48(12.4) | 49(12.3) | |||
| Tumor stages | |||||||||
| Ia+Ib | 552(69.3) | 289(70.8) | 263(67.8) | ||||||
| IIa+IIb | 173(21.7) | 86(21.1) | 87(22.4) | ||||||
| IIIa+IIIb | 71(8.9) | 33(8.1) | 38(9.8) | ||||||
| HBsAg, N (%) | |||||||||
| Positive | 568(71.4) | 108(13.4) | <0.0001b | 294(72.1) | 61(15.0) | <0.0001b | 274(70.6) | 47(11.8) | <0.0001b |
| Negative | 228(28.6) | 698(86.6) | 114(27.9) | 347(85.0) | 114(29.4) | 351(88.2) | |||
Two-sided two-sample t-test between cases and controls.
χ2 test for differences between cases and controls.
Figure 1. Example sequencing and genotyping output for the two BRM Indel polymorphisms.

The upper and middle panels showed the sequence of deletion and insertion allele, respectively. The underlined base-pairs indicate the inserted sequences. The lower panel displays an example of the genotyping assay results. For rs34480940 (Figure 1A), lane 5 and 9, del/del genotype; lane 2, 4 and 6, ins/del genotype; lane 1, negative control; remaining lanes, ins/ins genotype. For rs3832613 (Figure 1B), lane 3 and 9, ins/ins genotype; lane 3 and 9, del/del genotype; lane 5, negative control; remaining lanes, ins/del genotype.
Genotype frequencies and odds ratio (OR) and 95% confidence interval (CI) for cases and controls are presented in Table 2. Under co-dominant model, compared with the del/del wild genotype, subjects with the heterozygous ins/del or homozygous ins/ins variants of BRM-1321 had a significantly increased risk of HCC in a dose dependent manner (adjusted OR = 1.47, 95% CI = 1.19–1.82; adjusted OR = 2.55, 95% CI = 1.75–3.72, respectively). Similar trends were observed in both panels. Each additional copy of the insertion allele was associated with a 55% increased risk in pooled analysis (OR = 1.55, 95% CI = 1.33–1.81, P<0.0001). However, logistic regression analysis revealed that there was no significant association between BRM-741 and HCC in both panels. Only a borderline significant association was observed in the pooled analysis for ins/ins genotype (P = 0.05).
Table 2. Associations between BRM promoter Indel genotypes and HCC risk.
| Variations | Population | Genotype | Cases | % | Control | % | OR (95% CI)a | P |
| BRM-1321 | Panel I | del/del | 170 | 41.7 | 220 | 53.9 | 1.00(reference) | |
| ins/del | 182 | 44.6 | 160 | 39.2 | 1.47(1.09–2.00) | 0.009 | ||
| ins/ins | 56 | 13.7 | 28 | 6.9 | 2.58(1.53–4.36) | 0.0001 | ||
| P trend | <0.0001 | |||||||
| Panel II | del/del | 163 | 42.0 | 215 | 54.0 | 1.00(reference) | ||
| ins/del | 177 | 45.6 | 158 | 39.7 | 1.47(1.08–2.00) | 0.01 | ||
| ins/ins | 48 | 12.4 | 25 | 6.3 | 2.52(1.45–4.41) | 0.0004 | ||
| P trend | 0.0001 | |||||||
| Overall | del/del | 333 | 41.8 | 435 | 54.0 | 1.00(reference) | ||
| ins/del | 359 | 45.1 | 318 | 39.5 | 1.47(1.19–1.82) | 0.0002 | ||
| ins/ins | 104 | 13.1 | 53 | 6.6 | 2.55(1.75–3.72) | <0.0001 | ||
| P trend | <0.0001 | |||||||
| BRM-741 | ||||||||
| Panel I | del/del | 83 | 20.3 | 94 | 23.0 | 1.00(reference) | ||
| ins/del | 188 | 46.1 | 194 | 47.5 | 1.09(0.75–1.58) | 0.61 | ||
| ins/ins | 137 | 33.6 | 120 | 29.4 | 1.28(0.85–1.91) | 0.19 | ||
| P trend | 0.18 | |||||||
| Panel II | del/del | 75 | 19.3 | 90 | 22.6 | 1.00(reference) | ||
| ins/del | 184 | 47.4 | 192 | 48.2 | 1.16(0.79–1.70) | 0.46 | ||
| ins/ins | 129 | 33.2 | 116 | 29.1 | 1.35(0.89–2.04) | 0.15 | ||
| P trend | 0.15 | |||||||
| Overall | del/del | 158 | 19.8 | 184 | 22.8 | 1.00(reference) | ||
| ins/del | 372 | 46.7 | 386 | 47.9 | 1.12(0.86–1.46) | 0.38 | ||
| ins/ins | 266 | 33.4 | 236 | 29.3 | 1.31(0.98–1.74) | 0.05 | ||
| P trend | 0.05 |
adjusted for sex, age, smoking status, drinking status and HBV infection.
Furthermore, we performed stratified analyses by smoking status, drinking status and HBV infection for BRM-741 and BRM-1321 indel polymorphisms. Because of low number of HBsAg-positive subjects in control group and HBsAg-negative subjects in case group, we analyzed the pooled data from two case control sets. As shown in Table 3, Table 4 and Table 5, these common confounders did not seem to affect the positive association between BRM-1321 and risk of HCC (all P interaction values >0.05). Intriguingly, we observed a significant association between ins/ins genotype of BRM-741 and HCC incidence in smokers subgroup (Table 3) (P interaction = 0.02). No significant association was observed in non-smoker subgroup. Other parameters did not contribute to the association between BRM-741 and HCC risk (Table 3, Table 4 and Table 5).
Table 3. Stratification analysis based on smoking status in two populations.
| Variations | Population | Genotype | Smokers | Nonsmokers | P interaction | ||||
| Case, % | Control, % | OR(95% CI)a | Case, % | Control, % | OR(95% CI)a | ||||
| BRM-1321 | Panel I | del/del | 70(41.9) | 90(52.6) | 1.00(Reference) | 100(41.5) | 130(54.8) | 1.00(Reference) | 0.69 |
| ins/del | 73(43.7) | 66(38.6) | 1.49(0.91–2.42) | 109(45.2) | 94(39.7) | 1.48(0.99–2.20) | |||
| ins/ins | 24(14.4) | 15(8.8) | 2.30(1.05–5.10) | 32(13.3) | 13(5.5) | 3.10(1.47–6.62) | |||
| P trend | 0.03 | 0.0004 | |||||||
| Panel II | del/del | 70(41.9) | 99(55.0) | 1.00(Reference) | 93(42.1) | 116(53.2) | 1.00(Reference) | 0.87 | |
| ins/del | 74(44.3) | 70(38.9) | 1.50(0.93–2.41) | 103(46.6) | 88(40.4) | 1.46(0.97–2.22) | |||
| ins/ins | 23(13.8) | 11(6.1) | 2.67(1.14–6.36) | 25(11.3) | 14(6.4) | 2.90(1.28–6.65) | |||
| P trend | 0.003 | 0.009 | |||||||
| Overall | del/del | 140(41.9) | 189(53.8) | 1.00(Reference) | 193(41.8) | 246(54.1) | 1.00(Reference) | 0.97 | |
| ins/del | 147(44.0) | 136(38.7) | 1.49(1.07–2.09) | 212(45.9) | 182(40.0) | 1.47(1.11–1.96) | |||
| ins/ins | 47(14.1) | 26(7.4) | 2.38(1.35–4.18) | 57(12.3) | 27(5.9) | 3.01(1.75–5.19) | |||
| P trend | 0.0003 | <0.0001 | |||||||
| BRM-741 | Panel I | del/del | 30(18.0) | 44(25.7) | 1.00(Reference) | 53(22.0) | 50(21.1) | 1.00(Reference) | 0.13 |
| ins/del | 71(42.5) | 79(46.2) | 1.34(0.73–2.44) | 117(48.5) | 115(48.5) | 0.97(0.59–1.58) | |||
| ins/ins | 66(39.5) | 48(28.1) | 2.06(1.09–3.91) | 71(29.5) | 72(30.4) | 0.92(0.53–1.57) | |||
| P trend | 0.02 | 0.78 | |||||||
| Panel II | del/del | 30(18.0) | 47(26.1) | 1.00(Reference) | 45(20.4) | 43(19.7) | 1.00(Reference) | 0.16 | |
| ins/del | 75(44.9) | 85(47.2) | 1.36(0.76–2.47) | 109(49.3) | 107(49.1) | 0.98(0.58–1.66) | |||
| ins/ins | 62(37.1) | 48(26.7) | 2.07(1.09–3.92) | 67(30.3) | 68(31.2) | 0.96(0.54–1.70) | |||
| P trend | 0.02 | 0.82 | |||||||
| Overall | del/del | 60(18.0) | 91(25.9) | 1.00(Reference) | 98(21.2) | 93(20.4) | 1.00(Reference) | 0.02 | |
| ins/del | 146(43.7) | 164(46.7) | 1.35(0.89–2.04) | 226(48.9) | 222(48.8) | 0.97(0.68–1.39) | |||
| ins/ins | 128(38.3) | 96(27.4) | 2.07(1.33–3.22) | 138(29.9) | 140(30.8) | 0.94(0.64–1.38) | |||
| P trend | 0.0007 | 0.72 | |||||||
adjusted by age, sex, drinking status and HBV infection status. Smokers included former smokers and current smokers.
Table 4. Stratification analysis based on drinking status in two populations.
| Variations | Population | Genotype | Drinkers | Nondrinkers | P interaction | ||||
| Case, % | Control, % | OR(95% CI)a | Case, % | Control, % | OR(95% CI)a | ||||
| BRM-1321 | Panel I | del/del | 80(40.6) | 105(54.1) | 1.00(Reference) | 90(42.7) | 115(53.7) | 1.00(Reference) | 0.96 |
| ins/del | 87(44.2) | 74(38.1) | 1.53(0.98–2.39) | 95(45.0) | 86(40.2) | 1.40(0.92–2.13) | |||
| ins/ins | 30(15.2) | 15(7.7) | 2.51(1.20–5.30) | 26(12.3) | 13(6.1) | 2.44(1.12–5.36) | |||
| P trend | 0.002 | 0.006 | |||||||
| Panel II | del/del | 78(41.7) | 100(54.6) | 1.00(Reference) | 85(42.3) | 115(53.5) | 1.00(Reference) | 0.94 | |
| ins/del | 85(45.5) | 72(39.3) | 1.50(0.95–2.36) | 92(45.8) | 86(40.0) | 1.43(0.94–2.20) | |||
| ins/ins | 24(12.8) | 11(6.0) | 2.77(1.21–6.45) | 24(11.9) | 14(6.5) | 2.30(1.06–5.01) | |||
| P trend | 0.004 | 0.009 | |||||||
| Overall | del/del | 158(41.1) | 205(54.4) | 1.00(Reference) | 175(42.5) | 230(53.6) | 1.00(Reference) | 0.93 | |
| ins/del | 172(44.8) | 146(38.7) | 1.51(1.11–2.07) | 187(45.4) | 172(40.1) | 1.42(1.05–1.90) | |||
| ins/ins | 54(14.1) | 26(6.9) | 2.62(1.52–4.52) | 50(12.1) | 27(6.3) | 2.36(1.38–4.06) | |||
| P trend | <0.0001 | 0.0002 | |||||||
| BRM-741 | Panel I | del/del | 39(19.8) | 45(23.2) | 1.00(Reference) | 44(20.9) | 49(22.9) | 1.00(Reference) | 0.97 |
| ins/del | 90(45.7) | 91(46.9) | 1.12(0.64–1.94) | 98(46.4) | 103(48.1) | 1.07(0.63–1.80) | |||
| ins/ins | 68(34.5) | 58(29.9) | 1.30(0.72–2.36) | 69(32.7) | 62(29.0) | 1.22(0.69–2.16) | |||
| P trend | 0.27 | 0.41 | |||||||
| Panel II | del/del | 38(20.3) | 40(21.9) | 1.00(Reference) | 37(18.4) | 50(23.3) | 1.00(Reference) | 0.82 | |
| ins/del | 85(45.5) | 88(48.1) | 1.03(0.58–1.82) | 99(49.3) | 104(48.4) | 1.30(0.76–2.23) | |||
| ins/ins | 64(34.2) | 55(30.1) | 1.21(0.65–2.23) | 65(32.3) | 61(28.4) | 1.42(0.79–2.56) | |||
| P trend | 0.45 | 0.21 | |||||||
| Overall | del/del | 77(20.1) | 85(22.5) | 1.00(Reference) | 81(19.7) | 99(23.1) | 1.00(Reference) | 0.96 | |
| ins/del | 175(45.6) | 179(47.5) | 1.07(0.73–1.58) | 197(47.8) | 207(48.3) | 1.17(0.81–1.70) | |||
| ins/ins | 132(34.4) | 113(30.0) | 1.26(0.83–1.91) | 134(32.5) | 123(28.7) | 1.31(0.88–1.96) | |||
| P trend | 0.19 | 0.14 | |||||||
adjusted by age, sex, smoking status and HBV infection status. Drinkers included light drinkers and heavy drinkers.
Table 5. Stratification analysis based on HBV infection status.
| Variations | Genotype | HBV Positive | HBV Negative | P interaction | ||||
| Case, % | Control, % | OR(95% CI)a | Case, % | Control, % | OR(95% CI)a | |||
| BRM-1321 | del/del | 232(40.8) | 60(55.6) | 1.00(Reference) | 101(44.3) | 375(53.7) | 1.00(Reference) | 0.75 |
| ins/del | 254(44.7) | 39(36.1) | 1.69 (1.06–2.69) | 105(46.1) | 279(40.0) | 1.40(1.01–1.94) | ||
| ins/ins | 82(14.4) | 9(8.3) | 2.37(1.08–5.37) | 22(9.6) | 44(6.3) | 1.86(1.02–3.35) | ||
| P trend | 0.004 | 0.007 | ||||||
| BRM-741 | del/del | 112(19.7) | 23(21.3) | 1.00(Reference) | 46(20.2) | 161(23.1) | 1.00(Reference) | 0.96 |
| ins/del | 258(45.4) | 49(45.4) | 1.10(0.62–1.96) | 114(50.0) | 337(48.3) | 1.17(0.78–1.77) | ||
| ins/ins | 198(34.9) | 36(33.3) | 1.16(0.63–2.14) | 68(29.8) | 200(28.7) | 1.19(0.76–1.87) | ||
| P trend | 0.68 | 0.46 | ||||||
adjusted by age, sex, smoking status and drinking status.
Association between BRM Haplotypes and HCC Risk
Linkage disequilibrium (LD) analyses revealed that BRM-741 and BRM-1321 polymorphisms were in a moderate LD (D′ = 0.68). Four inferred haplotypes were observed in the current samples. Results from the haplotype analysis were showed in Table 6. Consistent with results of the genotype analysis, the BRM haplotype containing both insertion risk allele of two polymorphisms (−1321 ins/−741 ins) was significantly associated with an enhanced risk of HCC, compared with the most common haplotype “−1321 del/−741 del ” (OR = 1.59, 95% CI = 1.33–1.90, P<0.0001).
Table 6. Association between BRM promoter haplotypes and risk of HCCa.
| Population | Haplotype | Cases | n (%) | Controls | n (%) | OR (95% CI) | P |
| Panel I | −1321 del/−741 del | 320 | 39.3 | 340 | 41.7 | 1.00 (reference) | |
| −1321 ins/−741 ins | 260 | 31.9 | 174 | 21.4 | 1.59(1.23–2.04) | 0.0002 | |
| −1321 del/−741 ins | 202 | 24.7 | 260 | 31.8 | 0.83(0.65–1.06) | 0.12 | |
| −1321 ins/−741 del | 34 | 4.1 | 42 | 5.1 | 0.86(0.52–1.42) | 0.54 | |
| Panel II | −1321 del/−741 del | 302 | 38.9 | 330 | 41.4 | 1.00 (reference) | |
| −1321 ins/−741 ins | 241 | 31.1 | 166 | 20.8 | 1.59(1.22–2.06) | 0.0003 | |
| −1321 del/−741 ins | 201 | 25.9 | 258 | 32.5 | 0.85(0.66–1.09) | 0.19 | |
| −1321 ins/−741 del | 32 | 4.1 | 42 | 5.3 | 0.83(0.50–1.39) | 0.46 | |
| Overall | −1321 del/−741 del | 622 | 39.1 | 670 | 41.6 | 1.00 (reference) | |
| −1321 ins/−741 ins | 501 | 31.5 | 340 | 21.1 | 1.59(1.33–1.90) | <0.0001 | |
| −1321 del/−741 ins | 403 | 25.3 | 518 | 32.1 | 0.84(0.70–1.00) | 0.041 | |
| −1321 ins/−741 del | 66 | 4.1 | 84 | 5.2 | 0.85(0.59–1.21) | 0.34 |
Haplotype frequencies in cases and controls were compared using logistic regression.
The Genotype-Phenotype Correlations between BRM Indel Polymorphisms and BRM Expression
To further explore the effect of BRM-1321 on the expression of BRM, we used three different genotypic HCC tissue samples as well as their adjacent non-tumor tissues to examine BRM expression. First, results of real-time PCR demonstrated that the expression level of BRM in adjacent non-tumor tissues was 2.75-fold higher than that of HCC tumor tissues (Figure 2A). Second, when we classified the tissue samples into three groups (ins/ins, ins/del and del/del) based on BRM-1321 genotype, significant differences were observed concerning BRM expression in both HCC tumor tissue and non-tumor tissues. Compared with ins/ins genotype, subjects carrying ins/del and del/del genotype had 2.30 and 4.99 fold higher BRM expression in HCC tissue samples, respectively. Similar trends were observed in adjacent non-tumor tissue samples (Figure 2B). Third, we further compared BRM expression levels of different haplotype groups according to the availability of appropriate genotype combinations of the indel polymorphisms. As shown in Figure 2C, compared with −1321 ins/ins-741 ins/ins haplotype, the BRM mRNA expression levels of −1321 del/del-741 del/del and −1321 del/del-741 ins/ins haplotypes were significantly increased from 2.65 to 9.43 fold. To validate our findings in HCC tissues, we further examined the genotype-phenotype correlations in four common hepatoma cell lines (Huh-7, Hep3B, sk-Hep-1 and SMMC-7721). Compared with sk-Hep-1 cell lines carrying −1321 del/del-741 del/del haplotype, the BRM mRNA expression levels of Huh-7, Hep3B and SMMC-7721 (−1321 del/del-741 ins/ins haplotype) were significantly increased (Figure 2D). Western blotting showed that BRM protein level of del/del and ins/del genotype carriers was higher than that with ins/ins genotypes (Figure 3A). Similarly, BRM protein expression of subject harboring −1321 del/del-741 ins/ins and −1321 del/del-741 del/del haplotype was higher than that with −1321 ins/ins-741 ins/ins haplotype (Figure 3B). Together, these data demonstrated that the genotypes of BRM-1321 and the corresponding haplotypes were significantly correlated with BRM expression in vivo, at both mRNA and protein levels.
Figure 2. BRM expression in HCC tumor tissues vs. non-tumor tissues and its correlations between BRM-1321 indel polymorphism as well as corresponding haplotypes.

(A) Relative BRM expression in HCC tumor tissues vs. non-tumor tissues (n = 72); (B) Relative BRM expression in three genotypic groups of BRM-1321 (−1321 ins/ins, n = 10, −1321 ins/del, n = 32, −1321 del/del, n = 30); (C) Relative BRM expression in different haplotype groups (haplotype: −1321 ins/ins-741 ins/ins, n = 6, haplotype: −1321 del/del-741 del/del, n = 11, haplotype: −1321 del/del-741 ins/ins, n = 4); (D) Relative BRM expression in hepatoma cell lines with different haplotypes. Data represented as mean ± SEM. *indicates P<0.01, **indicates P<0.001 compared within the same group (HCC tissue or non HCC tissue).
Figure 3. Western blot analysis of BRM expression in HCC tissue and adjacent non-tumor tissues.
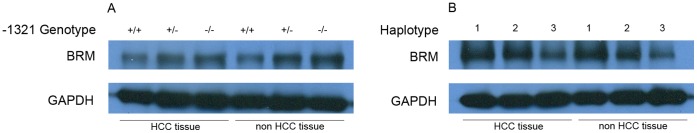
(A) BRM expression for different BRM-1321 genotypes. (B) BRM expression for different haplotypes. Haplotype #1: −1321 del/del-741 ins/ins, Haplotype #2: −1321 del/del-741 del/del, Haplotype #3: −1321 ins/ins-741 ins/ins.
Discussion
To our knowledge, this is the first epidemiological study to assess the association between genetic variants of BRM gene and HCC risk. By analyzing two indel polymorphisms within the promoter region of BRM in two independent case control studies, we find that the genotypes of the BRM-1321 (rs3832613), not BRM-741 (rs34480940), can influence HCC incidence in Chinese populations. However, our findings suggest a significant interaction between BRM-741 and smoking behavior in HCC tumorgenesis. Functional assays reveal a significant genotype-phenotype correlation that the risk genotypes of BRM-1321 conferred lower BRM expression in vivo. These findings suggest that BRM promoter polymorphisms could regulate BRM expression and may serve as potential markers for genetic susceptibility to HCC.
BRM is absent or expressed at low levels in subsets of several types of tumor such as lung cancer and prostate cancer, pinpointing a central role for BRM loss in cancer development [9], [19]–[20]. Furthermore, BRM absence correlates with advanced stages of disease progression and poor prognosis [21], [22]. Similarly, inactivation of BRM can lead to an increased number of lung tumors in a mouse model [23]. Multiple lines of evidence have indicated that BRM may be regulated at both transcriptional and post- transcriptional levels [13], [24]. Our findings support the notion that the genetic variations within promoter region of BRM may be key functional elements in regulating expression of BRM. For example, BRM-1321 (rs3832613) may interrupt the bindings of specific transcription factors (i.e. myocyte enhancer factor-2) through which altering the BRM promoter activity, resulting in its misexpression. Numerous direct interactions have been identified between the SWI/SNF complex and well-known tumor-suppressor genes and oncogenes, such as RB and BRCA1 [25], [26]. Therefore, it is plausible that altered BRM expression may abrogate growth control by impairing RB-mediated cell cycle arrest. Meanwhile, BRM can promote the transcription of specific genes such as E-cadherin and CD44 by controlling recruitment and activation of methyltransferases or demethylases to their promoter sequences [27]. To this end, aberrant BRM expression conferred by promoter polymorphisms may also contribute to increased or repressed methylation of its target genes during tumor progression.
As a baseline, we first used real-time PCR to see if and how the BRM mRNA levels differed in HCC tumor tissues and adjacent non-tumor tissues. Consistent with previous findings [28], our results reveal that BRM expression in adjacent non-tumor tissues is significantly higher than that of HCC tumor tissues (Figure 2A). In deed, BRM has been also found to be differentially expressed between well-differentiated HCC and moderately-to-poorly differentiated HCC [29]. Moreover, we have shown that the ins/ins genotype of BRM-1321 is significantly associated with BRM expression in both HCC tumor tissues and adjacent non-tumor tissues, indicating this genotype-phenotype correlation is a ubiquitous phenomenon in human tissue.
It is worthy of note that we only observe a moderate LD (D′ = 0.68) of the two indels in the current study, which is different from that of previous results (D' = 0.83) [13]. Since LD may be influenced by population specific factors such as genetic drift or genomic region specific factors such as recombination rate [30], this discrepancy may due to population specific characteristic of these two indels. However, regulation of BRM may be mediated by multiple factors through different molecular mechanisms. For example, a miR-199a-dependent regulation of BRM has been suggested a potential feedback loop through EGR1 [31]. Thus, further studies will still be needed to investigate how BRM loss occurs and which major pathways affected by its loss, leading to the occurrence of HCC.
Tobacco smoking is one of the main known etiological factors of some cancers. Long-term tobacco smoking has been shown to contribute to carcinogenesis [32]. Smoking can significantly increase nuclear hypoxia-inducible factor (HIF)-1α expression, and SWI/SNF complex is required for HIF-1α mRNA [33]. The interaction between BRM-741 and smoking behavior in our study might be caused by alterations in catalytic efficiency between tobacco constituents and the polymorphic BRM gene. These findings provide a possible molecular explanation for the synergistic effect of smoking and genetic background on HCC development. However, details of the mechanism need to be verified by further well-designed experiments.
Finally, our case samples were only collected in two local comprehensive hospitals. Thus, we may not exclude any potential selection bias during sampling process. However, our case series can at least represent part of Chinese HCC patients. We should note that the current sample size is relative small especially for assessing three-way interactions. Therefore, further replication studies in ethnically different groups are necessary to fully establish the role of BRM polymorphisms in HCC and their relationships with other environmental factors implicated in HCC susceptibility.
In summary, our molecular epidemiological findings demonstrated a significant association of BRM-1321 with an increased risk of developing HCC in Chinese populations. Functional studies also provided new insights into the mechanisms that may explain the essential roles of BRM in modifying HCC susceptibility. Although these results confirmed BRM as a candidate gene for HCC in Chinese populations, the underlying molecular mechanism should be addressed clearly in future studies.
Acknowledgments
We gratefully acknowledge the participation of patients with HCC and cancer-free individuals.
Funding Statement
This study is supported by grants from National Natural Science Foundation of China (No. 81171893, No. 81201574, No. 31000630 and No. 11101300), Natural Science Foundation of Jiangsu Province (No. BK2011290) and Natural Science Foundation for Colleges and Universities of Jiangsu Province (09KJB180007). The funders had no role in study design, data collection and analysis, decision to publish, or preparation of the manuscript.
References
- 1. Yang JD, Roberts LR (2010) Hepatocellular carcinoma: A global view. Nat Rev Gastroenterol Hepatol 7: 448–458. [DOI] [PMC free article] [PubMed] [Google Scholar]
- 2. McClune AC, Tong MJ (2010) Chronic hepatitis B and hepatocellular carcinoma. Clin Liver Dis 14: 461–476. [DOI] [PubMed] [Google Scholar]
- 3. Chen CJ, Chen DS (2002) Interaction of hepatitis B virus, chemical carcinogen, and genetic susceptibility: multistage hepatocarcinogenesis with multifactorial etiology. Hepatology 36: 1046–1049. [DOI] [PubMed] [Google Scholar]
- 4. Whittaker S, Marais R, Zhu AX (2010) The role of signaling pathways in the development and treatment of hepatocellular carcinoma. Oncogene 29: 4989–5005. [DOI] [PubMed] [Google Scholar]
- 5. Liang X, Bi S, Yang W, Wang L, Cui G, et al. (2009) Epidemiological serosurvey of hepatitis B in China–declining HBV prevalence due to hepatitis B vaccination. Vaccine 27: 6550–6557. [DOI] [PubMed] [Google Scholar]
- 6. Casper M, Grünhage F, Lammert F (2011) Cancer risk in chronic hepatitis B: Do genome-wide association studies hit the mark? Hepatology 53: 1390–1392. [DOI] [PubMed] [Google Scholar]
- 7. Wilson BG, Roberts CW (2011) SWI/SNF nucleosome remodellers and cancer. Nat Rev Cancer 11: 481–492. [DOI] [PubMed] [Google Scholar]
- 8. Reisman D, Glaros S, Thompson EA (2009) The SWI/SNF complex and cancer. Oncogene 28: 1653–1668. [DOI] [PubMed] [Google Scholar]
- 9. Roberts CW, Orkin SH (2004) The SWI/SNF complex–chromatin and cancer. Nat Rev Cancer 4: 133–142. [DOI] [PubMed] [Google Scholar]
- 10. Xia W, Nagase S, Montia AG, Kalachikov SM, Keniry M, et al. (2008) BAF180 is a critical regulator of p21 induction and a tumor suppressor mutated in breast cancer. Cancer Res 68: 1667–1674. [DOI] [PMC free article] [PubMed] [Google Scholar]
- 11. Medina PP, Romero OA, Kohno T, Montuenga LM, Pio R, et al. (2008) Frequent BRG1/SMARCA4-inactivating mutations in human lung cancer cell lines. Hum Mutat 29: 617–622. [DOI] [PubMed] [Google Scholar]
- 12. Reisman DN, Sciarrotta J, Bouldin TW, Weissman BE, Funkhouser WK (2005) The expression of the SWI/SNF ATPase subunits BRG1 and BRM in normal human tissues. Appl Immunohistochem Mol Morphol 13: 66–74. [DOI] [PubMed] [Google Scholar]
- 13. Liu G, Gramling S, Munoz D, Weissman BE, Funkhouser WK, et al. (2011) Two novel BRM insertion promoter sequence variants are associated with loss of BRM expression and lung cancer risk. Oncogene 30: 3295–3304. [DOI] [PMC free article] [PubMed] [Google Scholar]
- 14. Gao Y, He Y, Ding J, Wu K, Hu B, et al. (2009) An insertion/deletion polymorphism at miRNA-122-binding site in the interleukin-1alpha 3′ untranslated region confers risk for hepatocellular carcinoma. Carcinogenesis 30: 2064–2069. [DOI] [PubMed] [Google Scholar]
- 15. Chen S, He Y, Ding J, Jiang Y, Jia S, et al. (2010) An insertion/deletion polymorphism in the 3′ untranslated region of beta-transducin repeat-containing protein (betaTrCP) is associated with susceptibility for hepatocellular carcinoma in Chinese. Biochem Biophys Res Commun 391: 552–556. [DOI] [PubMed] [Google Scholar]
- 16. Yu Q, Zhou CX, Chen NS, Zheng SD, Shen LM, et al. (2012) A polymorphism within ErbB4 is associated with risk for hepatocellular carcinoma in Chinese population. World J Gastroenterol 18: 383–387. [DOI] [PMC free article] [PubMed] [Google Scholar]
- 17. Allen RC, Graves G, Budowle B (1989) Polymerase chain reaction amplification products separated on rehydratable polyacrylamide gels and stained with silver. Biotechniques 7: 736–744. [PubMed] [Google Scholar]
- 18. Shi YY, He L (2005) SHEsis, a powerful software platform for analyses of linkage disequilibrium, haplotype construction, and genetic association at polymorphism loci. Cell Res 15: 97–98. [DOI] [PubMed] [Google Scholar]
- 19. Shen H, Powers N, Saini N, Comstock CE, Sharma A, et al. (2008) The SWI/SNF ATPase Brm is a gatekeeper of proliferative control in prostate cancer. Cancer Res 68: 10154–10162. [DOI] [PMC free article] [PubMed] [Google Scholar]
- 20. Shain AH, Giacomini CP, Matsukuma K, Karikari CA, Bashyam MD, et al. (2012) Convergent structural alterations define SWItch/Sucrose NonFermentable (SWI/SNF) chromatin remodeler as a central tumor suppressive complex in pancreatic cancer. Proc Natl Acad Sci U S A 109: E252–259. [DOI] [PMC free article] [PubMed] [Google Scholar]
- 21. Reisman DN, Sciarrotta J, Wang W, Funkhouser WK, Weissman BE, et al. (2003) Loss of BRG1/BRM in human lung cancer cell lines and primary lung cancers: correlation with poor prognosis. Cancer Res 63: 560–566. [PubMed] [Google Scholar]
- 22. Fukuoka J, Fujii T, Shih JH, Dracheva T, Meerzaman D, et al. (2004) Chromatin remodeling factors and BRM/BRG1 expression as prognostic indicators in non-small cell lung cancer. Clin Cancer Res 10: 4314–4324. [DOI] [PubMed] [Google Scholar]
- 23. Glaros S, Cirrincione GM, Muchardt C, Kleer CG, Michael CW, et al. (2007) The reversible epigenetic silencing of BRM: implications for clinical targeted therapy. Oncogene 26: 7058–7066. [DOI] [PubMed] [Google Scholar]
- 24. Yamamichi N, Yamamichi-Nishina M, Mizutani T, Watanabe H, Minoguchi S, et al. (2005) The Brm gene suppressed at the post-transcriptional level in various human cell lines is inducible by transient HDAC inhibitor treatment, which exhibits antioncogenic potential. Oncogene 24: 5471–5481. [DOI] [PubMed] [Google Scholar]
- 25. Reisman DN, Strobeck MW, Betz BL, Sciariotta J, Funkhouser W Jr, et al. (2002) Concomitant down-regulation of BRM and BRG1 in human tumor cell lines: differential effects on RB-mediated growth arrest vs CD44 expression. Oncogene 21: 1196–1207. [DOI] [PubMed] [Google Scholar]
- 26. Bochar DA, Wang L, Beniya H, Kinev A, Xue Y, et al. (2000) BRCA1 is associated with a human SWI/SNF-related complex: linking chromatin remodeling to breast cancer. Cell 102: 257–265. [DOI] [PubMed] [Google Scholar]
- 27. Banine F, Bartlett C, Gunawardena R, Muchardt C, Yaniv M, et al. (2005) SWI/SNF chromatin-remodeling factors induce changes in DNA methylation to promote transcriptional activation. Cancer Res 65: 3542–3547. [DOI] [PubMed] [Google Scholar]
- 28. Boyault S, Rickman DS, de Reyniès A, Balabaud C, Rebouissou S, et al. (2007) Transcriptome classification of HCC is related to gene alterations and to new therapeutic targets. Hepatology 45: 42–52. [DOI] [PubMed] [Google Scholar]
- 29. Okabe H, Satoh S, Kato T, Kitahara O, Yanagawa R, et al. (2001) Genome-wide analysis of gene expression in human hepatocellular carcinomas using cDNA microarray: identification of genes involved in viral carcinogenesis and tumor progression. Cancer Res 61: 2129–2137. [PubMed] [Google Scholar]
- 30. Shifman S, Kuypers J, Kokoris M, Yakir B, Darvasi A, et al. (2003) Linkage disequilibrium patterns of the human genome across populations. Hum Mol Genet 12: 771–776. [DOI] [PubMed] [Google Scholar]
- 31. Sakurai K, Furukawa C, Haraguchi T, Inada K, Shiogama K, et al. (2011) MicroRNAs miR-199a-5p and -3p target the Brm subunit of SWI/SNF to generate a double-negative feedback loop in a variety of human cancers. Cancer Res 71: 1680–1689. [DOI] [PubMed] [Google Scholar]
- 32. Momi N, Kaur S, Ponnusamy MP, Kumar S, Wittel UA, et al. (2012) Interplay between smoking-induced genotoxicity and altered signaling in pancreatic carcinogenesis. Carcinogenesis 33: 1617–1628. [DOI] [PMC free article] [PubMed] [Google Scholar]
- 33. Kenneth NS, Mudie S, van Uden P, Rocha S (2009) SWI/SNF regulates the cellular response to hypoxia. J Biol Chem 284: 4123–4131. [DOI] [PubMed] [Google Scholar]