

Abstract
Background
Leymus chinensis (Trin.) Tzvel. is a high saline-alkaline tolerant forage grass genus of the tribe Gramineae family, which also plays an important role in protection of natural environment. To date, little is known about the saline-alkaline tolerance of L. chinensis on the molecular level. To better understand the molecular mechanism of saline-alkaline tolerance in L. chinensis, 454 pyrosequencing was used for the transcriptome study.
Results
We used Roche-454 massive parallel pyrosequencing technology to sequence two different cDNA libraries that were built from the two samples of control and under saline-alkaline treatment (optimal stress concentration-Hoagland solution with 100 mM NaCl and 200 mM NaHCO3). A total of 363,734 reads in control group and 526,267 reads in treatment group with an average length of 489 bp and 493 bp were obtained, respectively. The reads were assembled into 104,105 unigenes with MIRA sequence assemable software, among which, 73,665 unigenes were in control group, 88,016 unigenes in treatment group and 57,576 unigenes in both groups. According to the comparative expression analysis between the two groups with the threshold of “log2 Ratio ≥1”, there were 36,497 up-regulated unegenes and 18,218 down-regulated unigenes predicted to be the differentially expressed genes. After gene annotation and pathway enrichment analysis, most of them were involved in stress and tolerant function, signal transduction, energy production and conversion, and inorganic ion transport. Furthermore, 16 of these differentially expressed genes were selected for real-time PCR validation, and they were successfully confirmed with the results of 454 pyrosequencing.
Conclusions
This work is the first time to study the transcriptome of L. chinensis under saline-alkaline treatment based on the 454-FLX massively parallel DNA sequencing platform. It also deepened studies on molecular mechanisms of saline-alkaline in L. chinensis, and constituted a database for future studies.
Introduction
Leymus chinensis (Trin.) Tzvel., a perennial rhizome grass of the tribe Gramineae family with an allotetraploid species(2n = 4x = 28), naturally grew on alkaline-sodic soils in northern China [1], [2]. It's also an economically and ecologically important grass plant that contains many extremely valuable stress resistance genes [3]. Because of its high drought and saline–alkaline tolerance [4], [5], [6], L. chinensis plays an important role in the establishment of artificial grassland and in the protection of environment, which has received considerable attention in recent decades [7], [8]. Despite such advances, the genome of L. chinensis hasn't been published, little is known about its reference of genetic information on-line, and few studies have been reported on saline-alkaline of L. chinensis on molecular level. Therefore, the studies on molecular mechanisms of saline-alkaline in L. chinensis have far-reaching significance.
These years, a lot of studies have been reported on abiotic stresses of plants. The saline-alkaline stress is one of the main abiotic stresses, which is more seriously harmful than any single salt and alkaline stress on plants. Maybe salinity and alkalinity have a cooperative effect when they simultaneously stress on plants, which also had been demonstrated in L. chinensis and other species [9], [10], [11]. The mechanisms of abiotic stresses on plants are complex and diverse, even involve multiple complex physiological and metabolic pathways, which mostly include synthesis of extrusion and compartmentalization of sodium ions, response to abiotic stress, pathogen defense and adjustment of ion homeostasis [12], [13]. These mechanisms involve the expression of a cluster of genes and interaction among their gene products rather than individual genes, and the gene expression affected by many internal and external factors [14]. Therefore, the more comprehensive understanding of abiotic stress tolerance mechanisms need to be based on the gene expression level.
Over the past decades, the significant progress has been made in genome-wide gene expression profiling (GEP) by the development and application of differential display [15], as well as the large scale analysis of differential gene expression technology, such as cDNA libraries cloning technology [16], [17], [18], SAGE [19], Microarray technology [20], [21], and others. However, each of the above techniques has its disadvantages, such as high false positive rates, low level expression abundance, time-consuming and intensive labor [22]. As the first next-generation technology to reach the market, the development of the 454 Life Sciences (454; Branford, CT, USA; now Roche, Basel) sequencing platform (the 454 Sequencer) provides a compelling case study for the establishment of a new disruptive technology [23]. Moreover, 454 the 454-FLX massively parallel DNA sequencing platform is an effective next generation sequencing technology to better understand the transcriptome of unknown genome plant [24]. Meanwhile, massively parallel DNA sequencing platforms have become available which reduce the cost of DNA sequencing by over two orders of magnitude, making global transcriptome analysis inexpensive, and widespread [25]. Furthermore, a lot of studies on the comparative high throughput sequencing of plant transcriptome in many model and non model species, such us maize, grapevine, eucalyptus, olive genotype and cucumber flower have been reported [26], [27], [28], [29].
To gain a global view of the molecular mechanisms of saline-alkaline in L. chinensis, a transcriptome study on the two samples of control and saline-alkaline treatment (Hoagland solution with 100 mM NaCl and 200 mM NaHCO3) was performed to make a comparative gene expression analyses. Basing on barley, rice and wheat which closely relate to L. chinensis as references, we present a bioinformatic exploration, functional annotation, comparative analysis and real-time PCR validation of subset transcripts identified from significantly different expression of L. chinensis.
Results
Assay of Pro, SOD and MDA
To explore the optimal saline-alkaline stress concentration which can be considered as the particular condition for more expression of transcripts, about one month old seedlings of L. chinensis were challenged to the stress treatments of various concentrations of NaCl and NaHCO3 (see Materials and Methods ). The results showed that the plants grew normally under normal condition and the treatments of 100 mM NaCl+150 mM NaHCO3 and 50 mM NaCl+200 mM NaHCO3 during the whole period (Figure 1). The seedlings under the treatment of 100 mM NaCl and 200 mM NaHCO3 grew normally before the third day, and were slightly affected but could survive on the fourth day. While the treatment of 50 mM NaCl and 250 mM NaHCO3 seriously damaged the plants, and even caused the plants death after the second day. Furthmore, the proline (PRO) contents, superoxide dismutase (SOD) activities, and malondialdehyde (MDA) contents of all the collected samples were measured and showed in Figure 2. The results showed that PRO contents, SOD activities, and MDA contents reached the peak in one day, while dismounted rapidly afterwards at the stress concentration of 50 mM NaCl+250 mM NaHCO3, which indicated the physiological status of these plants were seriously damaged under this saline-alkaline stress condition. However, PRO contents, SOD activities, and MDA contents reached the peak in two days and kept the regular changing later at the stress concentration of 50 mM NaCl+200 mM NaHCO3 and 100 mM NaCl+200 mM NaHCO3. Moreover, the level of the PRO contents, SOD activities, and MDA contents under the treatment of 100 mM NaCl+200 mM NaHCO3 were higher than that of the treatment of 50 mM NaCl+200 mM NaHCO3 on each time point. Interestingly, PRO contents, SOD activities, and MDA contents haven't reached the peak until 4 days after stress treatments of 100 mM NaCl+150 mM NaHCO3 and under the normal condition, which indicated this saline-alkaline stress condition did not deeply induce the change of the plant's physiological status. These results, together with the plant growth status indicated that the optimal saline-alkaline stress condition was 100 mM NaCl+200 mM NaHCO3 for the second day, which was finally taken as the treatment group for the following experiments, sequencing and qRT-PCR.
Figure 1. Photos, the growth status of L. chinensis under different NaCl/NaHCO3 treatment at different time.

Abscissa indicates the different treatment time, ordinate indicates the different NaCl/NaHCO3 treatment.
Figure 2. Polygram, the physiological activities changes of L. chinensis under different NaCl/NaHCO3 treatment at different time.

Abscissa indicates the treatment time, ordinate indicates the physiological activities, and different color indicates different NaCl/NaHCO3 treatment. Data were obtained from three independent experiments and are means ± SE.
Sequencing output and assembly
A total of 363,734 and 526,266 raw reads were generated in control and treatment samples by 454 sequencing, respectively (Table 1), and the raw reads data were submitted on the public database (Submission ID:SRA053207/Raw reads of Leymus chinensis transcriptomes). After filtering out low quality reads, short reads, contamination sequences and vector sequences, 362,664 and 525,198 clean reads were remained in control and treatment samples with average length of 489 bp and 493 bp for assembling. The two samples reads were totally assembled into 104,105 unigenes with an average length of 630 bp using MIRA program [30], and the longest one was 4,597 bp. The length distribution of assembled unigenes was presented in Figure 3. Among all the assembled unigenes, 73,665 unigenes were in control group, among them, 16,089 unigenes were unique for control group. 88,016 unigenes were in treatment group and concluding 36,440 unigenes unique for treatment group. 57,576 unigenes were shared by both groups (Figure 4).
Table 1. Sequencing, assembly and data statistics.
| Control | Treated | |
| Raw reads | 363734 | 526266 |
| Low quality | 936 | 900 |
| Short reads (<50 bp) | 3 | 1 |
| Contamination sequences | 119 | 136 |
| Vector sequences | 12 | 31 |
| Clean reads | 362664 | 525198 |
| Average length | 489 | 493 |
Figure 3. Histogram, the length distribution of assembled unigenes.

The longest unigene is 4597 bp. The average length of unigenes is 630 bp.
Figure 4. Venn diagram, the gene expression statistics of the two samples.

(TIFF) The part of 16089 unigenes, 30440 unigenes and 57576 unigenes denotes the control group specific genes, the treated group specific genes, and the overlapped genes, respectively.
Comparison analysis between control and treatment samples
Comparative gene expression analysis between the two groups was used for estimating the gene expression levels in response to saline-alkaline stress. The transcripts with different expression levels were shown in Figure 5: the blue dots defined as “no difference in expression” represented the unigenes which differed by less than two fold between the two libraries, with the threshold of “log2 Ratio ≥1”, there were 36,497 up-regulated unigenes (red dots) and 18,218 down-regulated unigenes (green dots) predicted to be the significantly differentially expressed genes (DEG) (Table S1 and Table S2).
Figure 5. Scatter plot, the different expressed genes of the two samples.

The blue dots that differed by less than two fold between the two libraries, defined “no difference in expression”, the red dots (50514) and green dots (26222) represented the up-regulated and down-regulated expressed genes.
Functional annotation and classification
The gene functional annotation were carried out and the results shown that 12.904% of unigenes were involved in modification, protein turnover, chapernes, 10.089% involved in translation, ribosomal structure and biogenesis, 11.562% involved in energy production and conversion. Other functional annotation results were shown in Figure 6. Furthermore, gene annotation based on the DEG was carried out. Multiple functional up- and down-regulated unigenes associated with the stress functions (Table S1 and Table S2). After stress functional filtering, we surprising found that the specific expressed more than 10 fold genes in control or treatment group were predicted to be closely related with the plant stress functions (Table 2).
Figure 6. Paragraph, COG annotation and categorization of all unigenes.

The unigenes were classified into different functional groups based on COG annotation.
Table 2. The specific expressed more than 10 fold genes related with the plant stress functions.
| GeneID | Gene_length | log2 (treatment/control) | annotation |
| Up-regulated genes | |||
| Stress and tolerant function | |||
| GW_rep_c56407 | 768 | 13.425 | salt stress-responsive protein [Triticum aestivum] |
| GW_rep_c55028 | 796 | 13.136 | salt stress-responsive protein [Triticum aestivum] |
| GW_rep_c73217 | 676 | 12.773 | salt stress-responsive protein [Triticum aestivum] |
| GW_rep_c57492 | 501 | 12.773 | salt tolerant protein [Triticum aestivum] |
| GW_rep_c62560 | 524 | 12.551 | salt tolerance protein [Zea mays] |
| GW_rep_c70666 | 667 | 12.551 | salt stress-responsive protein [Triticum aestivum] |
| GW_rep_c82806 | 505 | 12.288 | salt stress-responsive protein [Triticum aestivum] |
| GW_rep_c64764 | 635 | 12.288 | salt stress-responsive protein [Triticum aestivum] |
| GW_rep_c74743 | 654 | 12.288 | salt stress-responsive protein [Triticum aestivum] |
| GW_rep_c81453 | 319 | 12.288 | salt stress-responsive protein [Triticum aestivum] |
| GW_rep_c59592 | 652 | 12.288 | salt tolerance protein [Zea mays] |
| GW_rep_c74655 | 608 | 11.966 | salt tolerant protein [Triticum aestivum] |
| GW_rep_c61447 | 642 | 11.966 | salt tolerant protein [Triticum aestivum] |
| GW_rep_c83484 | 693 | 11.966 | salt stress-responsive protein [Triticum aestivum] |
| GW_rep_c79794 | 417 | 11.551 | salt stress-responsive protein [Triticum aestivum] |
| GW_rep_c82013 | 424 | 11.551 | salt tolerant protein [Triticum aestivum] |
| GW_rep_c76556 | 438 | 11.551 | salt stress-responsive protein [Triticum aestivum] |
| GW_rep_c88621 | 483 | 11.551 | salt stress-responsive protein [Triticum aestivum] |
| GW_rep_c95199 | 519 | 11.551 | salt tolerant protein [Triticum aestivum] |
| GW_rep_c66826 | 540 | 11.551 | salt stress-responsive protein [Triticum aestivum] |
| GW_rep_c69291 | 590 | 11.551 | salt tolerance protein [Zea mays] |
| GW_rep_c76526 | 723 | 11.551 | salt tolerant protein [Triticum aestivum] |
| GW_rep_c61548 | 467 | 11.551 | salt tolerant protein [Triticum aestivum] |
| GW_rep_c88723 | 561 | 11.551 | salt tolerant protein [Triticum aestivum] |
| GW_rep_c91963 | 645 | 11.551 | salt tolerant protein [Triticum aestivum] |
| GW_rep_c65200 | 843 | 11.551 | salt tolerant protein [Triticum aestivum] |
| GW_rep_c62212 | 461 | 10.966 | salt tolerant protein [Triticum aestivum] |
| GW_rep_c75697 | 274 | 10.966 | salt tolerant protein [Triticum aestivum] |
| GW_rep_c72654 | 484 | 10.966 | stress responsive protein [Triticum aestivum] |
| GW_rep_c75671 | 494 | 10.966 | stress responsive protein [Triticum aestivum] |
| GW_rep_c96330 | 547 | 10.966 | stress responsive protein [Triticum aestivum] |
| GW_rep_c87965 | 568 | 10.966 | stress responsive protein [Zea mays] |
| GW_rep_c80875 | 583 | 10.966 | stress-associated protein 8 [Oryza sativa Indica Group] |
| GW_rep_c89184 | 651 | 10.966 | stress responsive protein [Triticum aestivum] |
| GW_rep_c84166 | 663 | 10.966 | stress-associated protein 8 [Oryza sativa Indica Group] |
| GW_rep_c25561 | 471 | 10.966 | stress-associated protein 8 [Oryza sativa Indica Group] |
| GW_rep_c75533 | 619 | 10.966 | stress-associated protein 8 [Oryza sativa Indica Group] |
| GW_rep_c78874 | 631 | 10.966 | stress-associated protein 8 [Oryza sativa Indica Group] |
| GW_rep_c66865 | 849 | 10.966 | stress-associated protein 8 [Oryza sativa Indica Group] |
| GW_rep_c38686 | 518 | 10.966 | stress responsive protein [Triticum aestivum] |
| GW_rep_c81211 | 692 | 10.966 | stress responsive protein [Triticum aestivum] |
| GW_rep_c81415 | 338 | 10.966 | universal stress protein 9303 [Hordeum vulgare subsp. vulgare] |
| GW_rep_c80789 | 356 | 10.966 | universal stress protein 9308 [Hordeum vulgare subsp. vulgare] |
| GW_rep_c85023 | 393 | 10.966 | universal stress protein 23267 [Hordeum vulgare subsp. vulgare] |
| Energy production and conversion | |||
| GW_rep_c61665 | 537 | 12.773 | ATP-citrate synthase, putative, expressed [Oryza sativa] |
| GW_rep_c64849 | 453 | 12.773 | vacuolar ATP synthase subunit B [Zea mays] |
| GW_rep_c56023 | 903 | 12.551 | ATP synthase beta subunit [Triticum aestivum] |
| GW_rep_c42513 | 417 | 12.551 | ATP-citrate lyase B-1 [Arabidopsis lyrata subsp. lyrata] |
| GW_rep_c55569 | 401 | 12.551 | vacuolar ATPase subunit G [Triticum aestivum] |
| GW_rep_c78632 | 466 | 11.966 | vacuolar ATPase subunit G [Triticum aestivum] |
| GW_rep_c54695 | 591 | 11.966 | vacuolar ATPase subunit F [Triticum aestivum] |
| GW_rep_c80539 | 399 | 11.966 | vacuolar ATP synthetase subunit C [Aegilops tauschii] |
| GW_rep_c73093 | 514 | 11.551 | ATP synthase beta subunit [Triticum aestivum] |
| GW_rep_c94788 | 765 | 11.551 | ATP synthase subunit [Triticum aestivum] |
| GW_rep_c83052 | 744 | 11.551 | vacuolar proton-ATPase subunit A [Triticum aestivum] |
| GW_rep_c76178 | 596 | 11.551 | vacuolar ATPase subunit B1 [Triticum aestivum] |
| GW_rep_c54835 | 465 | 11.551 | vacuolar proton ATPase subunit E [Triticum aestivum] |
| GW_rep_c59622 | 448 | 10.966 | ATP synthase beta subunit [Triticum aestivum] |
| GW_rep_c89208 | 520 | 10.966 | ATP synthase beta subunit [Triticum aestivum] |
| GW_rep_c80723 | 347 | 10.966 | ATP synthase subunit [Triticum aestivum] |
| GW_rep_c82850 | 369 | 10.966 | ATP synthase subunit [Triticum aestivum] |
| GW_rep_c78584 | 581 | 10.966 | ATP synthase subunit [Triticum aestivum] |
| GW_rep_c95119 | 668 | 10.966 | ATP synthase subunit [Triticum aestivum] |
| GW_rep_c75443 | 407 | 10.966 | vacuolar ATPase subunit G [Triticum aestivum] |
| GW_rep_c88783 | 443 | 10.966 | vacuolar H+-ATPase 16 kDa subunit c [Iris lactea var. chinensis] |
| GW_rep_c62927 | 530 | 10.966 | vacuolar H+-ATPase 16 kDa subunit c [Iris lactea var. chinensis] |
| GW_rep_c48839 | 374 | 10.966 | vacuolar proton-ATPase subunit A [Triticum aestivum] |
| GW_rep_c32981 | 353 | 10.966 | vacuolar ATPase subunit F [Triticum aestivum] |
| GW_rep_c78047 | 382 | 10.966 | vacuolar proton-inorganic pyrophosphatase [Hordeum vulgare] |
| GW_rep_c67872 | 411 | 10.966 | vacuolar proton-inorganic pyrophosphatase [Hordeum vulgare] |
| GW_rep_c78888 | 593 | 10.966 | vacuolar ATP synthetase subunit C [Aegilops tauschii] |
| GW_rep_c64609 | 642 | 10.966 | vacuolar proton-ATPase subunit A [Triticum aestivum] |
| GW_rep_c87876 | 351 | 10.966 | vacuolar ATPase subunit B1 [Triticum aestivum] |
| Signal transduction mechanisms | |||
| GW_rep_c54463 | 845 | 14.214 | calmodulin [Musa acuminata AAA Group] |
| GW_rep_c15343 | 673 | 11.966 | calcium-dependent protein kinase [Triticum aestivum] |
| GW_rep_c89203 | 707 | 11.966 | calmodulin-2 [Arabidopsis lyrata subsp. lyrata] |
| GW_rep_c61074 | 358 | 11.965 | caltractin [Zea mays] |
| GW_rep_c23437 | 416 | 11.552 | calcium-dependent protein kinase [Triticum aestivum] |
| GW_rep_c16881 | 433 | 11.551 | caltractin [Zea mays] |
| GW_rep_c71382 | 556 | 11.551 | calmodulin [Zea mays] |
| GW_rep_c70027 | 757 | 11.551 | calmodulin-2 [Capsicum annuum] |
| GW_rep_c86210 | 382 | 10.966 | calmodulin [Zea mays] |
| GW_rep_c55725 | 385 | 10.966 | calmodulin [Zea mays] |
| GW_rep_c67900 | 414 | 10.966 | calcium-dependent protein kinase [Triticum aestivum] |
| GW_rep_c86394 | 534 | 10.966 | calmodulin2 [Zea mays] |
| GW_rep_c89734 | 556 | 10.966 | calmodulin [Zea mays] |
| GW_rep_c90699 | 587 | 10.966 | calmodulin2 [Zea mays] |
| Inorganic ion transport and metabolism | |||
| GW_rep_c76883 | 767 | 12.773 | transmembrane protein, putative, expressed [Oryza sativa] |
| GW_rep_c24417 | 397 | 12.288 | plasma membrane H+-ATPase [Hordeum vulgare subsp. vulgare] |
| GW_rep_c60967 | 450 | 12.288 | Ca2+/H+-exchanging protein [Hordeum vulgare subsp. vulgare] |
| GW_rep_c21310 | 629 | 11.966 | plasma membrane H+-ATPase [Triticum aestivum] |
| GW_rep_c83286 | 552 | 11.966 | Ca2+/H+-exchanging protein [Hordeum vulgare subsp. vulgare] |
| GW_rep_c96867 | 266 | 10.966 | Na+/H+ antiporter precursor [Triticum aestivum] |
| GW_rep_c72884 | 454 | 10.966 | vacuolar H+-pyrophosphatase [Triticum aestivum] |
| GW_rep_c69981 | 550 | 10.966 | vacuolar proton-inorganic pyrophosphatase [Hordeum vulgare] |
| GW_rep_c89160 | 565 | 10.966 | vacuolar proton-inorganic pyrophosphatase [Hordeum vulgare] |
| GW_rep_c61769 | 274 | 10.966 | Na+/H+ antiporter [Puccinellia tenuiflora] |
| Down-regulated genes | |||
| Death | |||
| GW_rep_c105843 | 567 | −10.966 | DEAD/DEAH box helicase family protein [Oryza brachyantha] |
| GW_rep_c108908 | 420 | −11.551 | dead box ATP-dependent RNA helicase[Ricinus communis] |
| GW_rep_c12825 | 231 | −12.551 | DEAD-box ATPase-RNA-helicase [Triticum aestivum] |
| Energy production and conversion | |||
| GW_rep_c107832 | 544 | −10.966 | peroxidase [Triticum aestivum] |
| GW_rep_c105379 | 480 | −10.966 | peroxidase 12 precursor [Zea mays] |
| GW_rep_c103913 | 491 | −10.966 | peroxidase 24 precursor [Zea mays] |
| GW_rep_c23688 | 441 | −11.551 | peroxidase 1 [Zea mays] |
| GW_rep_c101136 | 393 | −11.966 | peroxidase 4 [Triticum monococcum] |
| GW_rep_c101433 | 595 | −12.288 | peroxidase 16 precursor protein [Oryza sativa Indica Group] |
| Damage | |||
| GW_rep_c67383 | 672 | −10.966 | wound/stress protein [Zea mays] |
| GW_rep_c84500 | 667 | −11.551 | wound/stress protein [Zea mays] |
| GW_rep_c55754 | 771 | −12.965 | wound/stress protein [Zea mays] |
| GW_rep_c67080 | 731 | −13.287 | wound/stress protein [Zea mays] |
| Defence | |||
| GW_rep_c69512 | 506 | −10.966 | defender against death 1-like protein [Triticum aestivum] |
| GW_rep_c108309 | 651 | −12.773 | defender against death 1-like protein [Triticum aestivum] |
Pathway enrichment analysis of DEGs
Based on DEGs and annotation of KEGG, the biological pathways were evaluated by enrichment analysis of DEGs, a total of 120 pathways were up-regulated and 82 were down-regulated (Table S3, Table S4). With Q value<0.05 significantly enriched, the each first ten of up-regulated and down-regulated enriched pathways were reported in Table 3. Of which, calcium signaling pathway, oxidative phosphorylation, NHX antiporter were closely associated with stress function.
Table 3. The each first ten of up- and down-regulated enriched pathways.
| KEGG Pathway | Pathway ID | DEGs Tested | Pvalue | Qvalue |
| UP-regulated | ||||
| Calcium signaling pathway | ko04020 | 287 | 6.36E-11 | 9.29E-09 |
| Fatty acid biosynthesis | ko00071 | 238 | 2.05E-08 | 2.90E-06 |
| Oxidative phosphorylation | ko00190 | 268 | 3.98E-08 | 2.90E-06 |
| Flavonoid biosynthesis | ko00941 | 227 | 2.09E-07 | 2.00E-06 |
| Peroxisome | ko04146 | 213 | 7.26E-07 | 3.53E-05 |
| Cytokine-cytokine receptor interaction | ko04060 | 130 | 2.60E-06 | 3.53E-05 |
| ABC transporters | ko02010 | 129 | 1.07903E-05 | 1.22E-05 |
| Phenylpropanoid biosynthesis | ko00940 | 705 | 1.37E-05 | 4.46E-04 |
| NHX antiporter | ko04260 | 302 | 4.70E-06 | 6.11E-03 |
| RNA transport | ko03013 | 338 | 3.08E-02 | 6.04E-03 |
| Down-regulated | ||||
| Glyoxylate and dicarboxylate metabolism | ko00630 | 659 | 1.24E-16 | 3.51E-14 |
| Carbon fixation in photosynthetic organisms | ko00710 | 832 | 7.30E-15 | 1.03E-12 |
| Metabolic pathways | ko01100 | 4088 | 1.24E-06 | 8.76E-05 |
| Photosynthesis - antenna proteins | ko00196 | 827 | 0.000289561 | 1.17E-02 |
| Chloroalkane and chloroalkene degradation | ko00625 | 100 | 0.000362629 | 1.28E-02 |
| Carbohydrate digestion and absorption | ko04973 | 20 | 0.002161978 | 6.12E-02 |
| Plant hormone signal transduction | ko04075 | 113 | 0.0267472 | 7.74E-02 |
| Aldosterone-regulated sodium reabsorption | ko04960 | 29 | 0.006585828 | 3.55E-01 |
| Caprolactam degradation | ko00930 | 30 | 0.00856093 | 2.86E-01 |
| Tryptophan metabolism | ko00380 | 105 | 0.01302634 | 2.63E-01 |
Validation of differentially expressed genes by qPCR
Comparative expression analysis between the two groups, 16 unigenes were randomly selected from the differentially expressed genes and performed for further qRT-PCR validation. Among them, eight up-regulated unigenes (GW_rep_c1264, GW_rep_c59591, GW_rep_c1095, GW_rep_c1236, GW_rep_c34391, GW_rep_c26652, GW_rep_c162, GW_rep_c18525) were and eight down-regulated unigenes (GW_rep_c2047, GW_rep_c1723, GW_rep_c11679, GW_rep_c37136, GW_rep_c6561, GW_rep_c49894, GW_rep_c34820, GW_rep-c33890) were validated to correspond with the results of 454 sequencing (Figure 7, Text S1), the complete list of unigenes was listed in the Text S2, and the original RT figures were shown in the Text S3.
Figure 7. Histogram, Comparison of gene expression between qRT-PCR and 454 sequencing analysis.

The qRT-PCR are presented as the mean values of three repeats.
Discussion
The main aim of this study was to better understand the molecular mechanism of saline-alkaline tolerance and to obtain a number of key genes and complex pathways that play a critical role in response to saline-alkaline in L. chinensis. Therefore, we started an effective way of the high throughput sequencing and comparative transcriptome analysis based on 454 sequencing platform under optimal saline-alkaline stress concentration (100 mM NaCl and 200 mM NaHCO3).
Large scale comparative transcriptome analysis based on next generation sequencing technology have effective way to study the initial molecular changes and complex pathways [26], [28]. Our study also mainly focused on comparative transcriptional level analysis of the differentially expressed unigenes between the two samples, which was also used for estimating gene expression levels in response to saline-alkaline stress. Among the 104,105 unigenes obtained, 73,665 unigenes were in control group, 88,016 unigenes were in treatment group and 57,576 unigenes were in both groups (Figure 4). The transcripts with different expression levels between the two samples were shown in Figure 5, With the threshold of “log2 Ratio ≥1”, the red dots (36497) and green dots (18218) represented the significantly differentially expressed genes(DEG), the proportion of up-regulated genes was higher than that of down-regulated genes.
Based on the annotation of these differentially expressed genes (Table S1 and Table S2), there were multiple functional up- and down-regulated unigenes predicted to be closely related with the plant stress functions. Those included stress and tolerant function (salt stress-responsive protein, salt tolerant protein, sodium/hydrogen exchanger, stress-associated protein, and universal stress protein), signal transduction (calmodulin, calcium-dependent protein kinase, caltractin), energy production and conversion (ATP-citrate synthase, vacuolar ATP synthase subunit B, ATP synthase beta subunit, ATP-citrate lyase, vacuolar ATPase subunit, vacuolar proton-ATPase subunit and vacuolar H+-ATPase), and inorganic ion transport (transmembrane protein, plasma membrane H+-ATPase, Ca2+/H+-exchanging protein, vacuolar H+-pyrophosphatase, vacuolar proton-inorganic pyrophosphatase, Na+/H+ antiporter). Other down-regulated unigenes were associated with Death (DEAD/DEAH box helicase family protein, DEAD-box ATPase-RNA-helicase), Energy production and conversion (peroxidase, oxidative stress), Damage (wound/stress protein), Defence (defender against death).
Pathway functional enrichment analyses were carried out, which revealed the most significantly affected pathways during the treatment process. Fortunately, calcium signaling, oxidative phosphorylation and NHX antiporter up-regulated pathways appeared in the first ten enriched pathways (Table 3); more detailed information of pathways was shown in Table S3 and Table S4. The plasma membrane is one of the main sites common to different stresses [31]. Calcium serves as a versatile messenger in many adaptation and developmental processes in plants [32]. Calcium binding proteins serve as sensor molecules to detect and transmit cellular calcium signals [33]. In higher plants, the main mechanism for Na+ extrusion is powered by the operation of the plasma membrane H+-ATPase and Ca2+-ATPase [34]. They use the energy of ATP hydrolysis generated from oxidative phosphorylation pathway to pump H+ and Na+ into the cell. This proton motive force generated by the H+-ATPase and Ca2+-ATPase operate Na+/H+ antiporter (NHX) and Na+/Ca2+ antiporter (NCX) of plasma membrane. It has been reported that the NCX removes a single calcium ion in exchange for the import of three sodium ions [35]. The operation of plasma membrane Na+/H+ antiporter has been obtained in different plant species [36], and Na+/H+ antiporter activity has been reported on the plasma membrane of tobacco, and wheat [37], [38], [39].
Due to the sensitivity of 454 pyrosequencing has been documented to be more sensitive for estimation of gene expression than traditional Sanger sequences [14], 454 pyrosequencing has the advantages of lower error rate, higher sequencing capacity and long read lengths (600 bp in average), which might be the best choice for the unknown genome plants [24]. However, it's relatively difficult and expensive may cause 454 pyrosequencing not widely accessible, in the longer term, the principles established by 454 sequencing might reduce cost further [40], [41]. In our study, in order to confirm the steady-state transcript level, 16 unigenes of the differentially expressed genes were selected for validation by Real-time RT-PCR. Although the results in gene expression didn't match perfectly to the results detected by 454 pyrosequencing method, the up- and down-regulated trends were closely similar (Figure 7). Furthermore, according to the description of these 16 validated genes, some of them were associated with plant stress functions, such as Energy production and conversion, Ca2+-binding protein, and defense mechanisms. Moreover, more genes will be validated in the future study.
Conclusion
This is the first report of comprehensive transcriptome analysis and identification of differentially expressed genes of L. chinensis under saline-alkali stress based on the 454-FLX massively parallel DNA sequencing platform. The study showed that the responses to saline-alkali stress more serious than any single salt and alkali stress in L. chinensis, which had complex and diverse mechanisms, even involved multiple complex physiological and metabolic pathways. It will enrich our knowledge of the stress tolerance of L. chinensis at the molecular level and provide new insight to better understand the saline-alkali stress tolerance in other plants. All the data in our study will be of considerable archive for future studies.
Materials and Methods
Plants culture and treatment
Seeds of L. chinensis (Jisheng No. 4 Chinese Wildtye) with high saline-alkaline and drought resistance were obtained from Jilin Province Jisheng Wildrye Excellent Seed Station. After germinating in the dark for 72 h at 30°C, the well germinated seeds were evenly transferred into the hydroponic pots that contained Hoagland's nutrient solution in a artificial climate chamber with 15 h light (200 µEm-2s-1, 25°C) and 9 h dark (23°C), and with the relative humidity controlled at 75%. The nutrient solution was changed every 2 d. When seedlings of L. chinensis were about one month old, they were transferred into solutions supplemented with various concentrations of NaCl and NaHCO3 (100 mM NaCl+150 mM NaHCO3, 50 mM NaCl+200 mM NaHCO3, 100 mM NaCl+200 mM NaHCO3, 50 mM NaCl+250 mM NaHCO3) for 0 d, 1 d, 2 d, 3 d and 4 d. The control plants received no NaCl and Na2CO3 supplementation. The control and each treatment were biologically and temporally repeated in three independent and parallel experiments. The whole plants of the control and NaCl and NaHCO3 treatment were collected and then stored at −80°C until further use.
Physiological Index measurement
UV-Vis spectrophotometers (Shimadzu, UV-2450) were used to measure the physiological indexes (SOD, PRO and MDA) [42], [43], [44], [45] of the stored samples with physiological assay kit (Nanjing Jiancheng Bioengineering Institute, Nanjing, China), respectively. All the processes were biologically and temporally repeated in three independent and parallel experiments.
Total RNA extraction and cDNA synthesis
Total RNAs were extracted from the whole plants of the control and NaCl and NaHCO3 treatment using Trizol (Invitrogen) following the manufacturer's protocol. The quality of two total RNAs was checked using the NanoDrop Spectrometer (ND-1000 Spectrophotometer, Peqlab). The mRNAs were isolated from total RNAs using the PolyATtract® mRNA Isolation Systems kit (Promega, company) and condensed using Reasy RNA cleaning kit (QIAGEN, Germany), their concentration and purity were determined using the Agilent 2100 Bioanalyzer (RNA Nano Chip, Agilent). Using RNA Fragment reagent kit (Illumina, company) and Reasy RNA cleaning kit (QIAGEN, Germany) to fragment and retrieve the mRNA that has been condensed for 1 min. Then using random primer and MMLV to synthesize the first chain, and using DNA Polymerase I and RNase H to synthesize the second chain. Finally using Reasy RNA cleaning kit (QIAGEN, Germany) to retrieve cDNA, and using the Agilent 2100 Bioanalyzer to check the quality of cDNA. All procedures were applied according to the manufacturer's protocol.
454 sequencing and assembly
After linking with proprietary adapters sequentially, using GS-FLX platform with GS FLX Titanium kit to sequence approximately 10 ug cDNA from each of the two samples at sequencing company, a half-plate sequencing run was performed for each sample. The raw 454 sequence files in SFF format were base called using the Pyrobayes base Caller (Quinlan AR, 2008). Using Seqclean program (http://compbio.dfci.harvard.edu/tgi/software), LUCY program [46] and TagDust to clean the raw reads, including low quality reads, adaptor reads, short reads (<50 bp), polluted reads, hairpin structure reads and mosaic reads, all reads were assembled into unigenes using MIRA program [47]. Then all unigenes were used for all subsequent analysis.
Comparison analysis between control and treatment samples
For the comparative expression analysis between the two samples, the number of clean reads in each sample was normalized to Tags (reads) Per Million (TPM) to normalized gene expression level. Significance of differential gene expression was determined using the R statistic and the resulting raw p values were corrected for multiple tests using the False Discovery Rate (FDR).Genes were deemed to be significantly differentially expressed with the threshold of “FDR<0.001” and “log2 Ratio ≥1”and an estimated absolute log2-fold change >1 in sequence counts across the two samples. Finally, pathway functional enrichment analysis was carried out from the differentially expressed genes. Pathway enrichment analysis based on Hypergeometric distribution was used to identify the significantly enriched functional classification or metabolic pathways in DEGs. The formula is:
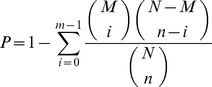 |
N is the total number of genes with KEGG functional annotations, and n is the number of DEGs in N. M is number of the gene with specific KEGG annotations, and m is the number of DEGs in M.
Functional annotation and statistical classification
Functional annotation and classification of the unigenes was to predict possible highest similarity functions of unigenes and to do functional classification statistics using the following databases: NR protein database (NCBI), the gene ontology (GO), the Kyoto Encyclopedia of Genes and Genomes (KEGG) and the Clusters of Orthologous Groups database (COG; http://www.ncbi.nlm.nih.gov/COG/). Among them, all the unigenes were classified into different functional groups based on COG database and pathways were carried out by KEGG database.
Quantitative real-time PCR (qRT-PCR) analysis
In order to verify the sequencing results, 16 of differentially expressed unigenes were randomly selected to confirm using quantitative real-time PCR. Primers specific for ubiquitin conjugating enzyme(UBC) (Forward: 5′-CGG AAA GGA TTG ACA GAT TGA-3′; Reverse: CTC AAT CTC GTG TGG CTG AA) were used for the normalization of reactions, which was used as an internal control [48]. Using the Premier 5.0 and Oligo 6 program to design primers with the length of 100 bp products or so, real-time PCR were performed using the SYBR PremixExTaqTM protocol (TaKaRa) on an Applied Biosystems 7500 Real-Time PCR System (Applied Biosystems, Foster City, CA, USA). All processes were performed in triplicate, and the average cycle thresholds (Ct) were used to determine fold-change. The relative quantification of gene expression was reported as a relative quantity (RQ) to the control value. The statistical package GraphPad Prism (GraphPad Software, Inc.) was calculated as 2− (ΔCt of treatment -ΔCt of control), which was used to analyze the data from all experiments [49].
Supporting Information
The gene annotation of up-regulated genes.
(XLS)
The gene annotation of down-regulated genes.
(XLS)
The up-regulated enrichment pathways.
(XLS)
The down-regulated enrichment pathways.
(XLS)
Real-time PCR confirmation of differential expressed genes.
(DOC)
The sequence list of confirmed unigenes.
(DOC)
The original RT figures of 16 validated genes.
(DOC)
Funding Statement
This work was supported by grants from the Program for New Century Excellent Talents in University (grant number NCET-08-0693), the Special Program for Research of Transgenic Plants (2011ZX08010-002), the National Natural Science Foundation of China (grant number 30971804), the State Key Laboratory of Crop Biology at Shandong Agricultural University, China (grant number 2010KF02), the Program for Young Scientific and Technological Talents and Outstanding Innovation Team (grant number 20111815) and the National High Technology Research and Development Program of China (863 Program) (grant number 2010AA1000691008). The funders had no role in study design, data collection and analysis, decision to publish, or preparation of the manuscript.
References
- 1. Xia GM, Chen HM (1996) Plant regeneration from intergeneric somatic hybridization between Triticum aestivum L. and Leymus chinensis (Trin.)Tzvel. Plant Science 120: 197–203. [Google Scholar]
- 2. Jin H, Plaha P, Park JY, Hong CP, Lee IS, et al. (2006) Comparative EST profiles of leaf and root of Leymus chinensis, a xerophilous grass adapted to high pH sodic soil. Plant Science 170: 1081–1086. [Google Scholar]
- 3. Wang KP (1984) The study of the species differentiations of Leymus chinensis wildrge. Grassland of China 6: 32–36. [Google Scholar]
- 4. Yin LJ, Shi DC, Wang P (1993) Growth adaptability and salt tolerance osmoregulation of Aneurolepidium chinense grown on saline grassland. Acta Botanica Sinica 35: 619–625. [Google Scholar]
- 5. Xiao X, Wang Y, Jiang S, Ojima DS, Bonham CD, et al. (1995) Interannual variation in the climate and above-groud biomass of Leymus chinensis steppe and Stipa grandis steppe in the Xilin river basin, Inner Mongolia. China Journal of Arid Environment 31: 283–299. [Google Scholar]
- 6. Bai Y, Han X, Wu J, Chen Z, Li L (2004) Ecosystem stability and compensatory eVects in the Inner Mongolia grassland. Nature 431: 181–184. [DOI] [PubMed] [Google Scholar]
- 7. Chen M, Li ZH, Pu SJ (1988) The observation and research on reproductive characteristics of Aneurolepidium chinensis . Res Grassl Ecosyst 2: 193–208. [Google Scholar]
- 8. Clayton WD, Renboize SA (1999) Genera Graminum grasses of the world. Kew Bull Additional Ser 13 Royal Botanic Gardens Kew. [Google Scholar]
- 9. Shi DC, Yin LJ (1992) Strain responses in Na2CO3 stressed Leymus chinensis seedlings and their mathematical analysis. Acta Bot Sin 34: 386–393 (in Chinese with an English abstract). [Google Scholar]
- 10. Shi DC, Yin LJ (1993) Difference between salt (NaCl) and alkaline (Na2CO3) stresses on Puccinellia tenuiflora (Griseb.) Scribn. et Merr. plants. Acta Bot Sin 35: 144–149 (in Chinese with an English abstract). [Google Scholar]
- 11. Yan H, Zhao W, Yin SJ, Shi DC, Zhou DW, et al. (2006) Different physiological responses of Aneurolepidum chinense to NaCl and Na2CO3. Acta Pratacult Sin 15: 19–55 (in Chinese with an English abstract). [Google Scholar]
- 12. Sanders D, Pelloux J, Brownlee C, Harper JF (2002) Calcium at the crossroads of signaling. Plant Cell 14 Suppl.: S401–S417. [DOI] [PMC free article] [PubMed] [Google Scholar]
- 13. Kim MC, Chung WS, Yun D, Cho MJ (2009) Calcium and calmodulin-mediated regulation of gene expression in plants. Molecular Plant 2 1: 13–21. [DOI] [PMC free article] [PubMed] [Google Scholar]
- 14. Wicker T, Schlagenhauf E, Graner A, Close TJ, Keller B, et al. (2006) 454 sequencing put to the test using the complex genome of barley. BMC Genomics 7: 275. [DOI] [PMC free article] [PubMed] [Google Scholar]
- 15. Liang P, Pardee AB (1992) Differential Display of eukaryotic messenger RNA by means of the polymerase chain reaction. Science 257: 967–971. [DOI] [PubMed] [Google Scholar]
- 16. Adams MD, Kerlavage AR, Fleischmann RD, Fuldner RA, Bult CJ, et al. (1995) Initial assessment of human gene diversity and expression patterns based upon 83 million nucleotides of cDNA sequence. Nature 377 6547 Suppl: 3–174. [PubMed] [Google Scholar]
- 17. Boguski MS, Tolstoshew CM, Bassett DE Jr (1994) Gene discovery in dbEST. Science 265 5181: 1993–1994. [DOI] [PubMed] [Google Scholar]
- 18. Asmann YW, Klee EW, Thompson EA, Perez EA, Middha S, et al. (2009) 3′tag digital gene expression profiling of human brain and universal reference RNA using Illumina Genome Analyzer. Translational Medicine 10 531: 1471–2164. [DOI] [PMC free article] [PubMed] [Google Scholar]
- 19. Velculescu VE, Zhang L, Vogelstein B, Kinzler KW (1995) Serial analysis of gene expression. Science 270 5235: 484–487. [DOI] [PubMed] [Google Scholar]
- 20. Shendure J, Ji H (2008) Next-generation DNA sequencing. Nat Biotechnol 26: 1135–1145. [DOI] [PubMed] [Google Scholar]
- 21. Lockhart DJ, Dong H, Byrne MC, Follettie MT, Gallo MV, et al. (1996) Expression monitoring by hybridization to high-density oligonucleotide arrays. Nat Biotechnol 14 13: 1675–1680. [DOI] [PubMed] [Google Scholar]
- 22. Debouck C (1995) Differential display or differential dismay? Curr Opin Biotechnol 6: 597–600. [Google Scholar]
- 23.Christensen CM (1997) The innovator's dilemma: when new technologies cause great firms to fail. Boston: Harvard Business School Press.
- 24. Rothberg JM, Leamon JH (2008) The development and impact of 454 sequencing. Nat Biotechnol 26: 1117–1124. [DOI] [PubMed] [Google Scholar]
- 25. Shendure J, Ji H (2008) Next-generation DNA sequencing. Nat Biotechnol 26: 1135–1145. [DOI] [PubMed] [Google Scholar]
- 26. Alagna F, D'Agostino N, Torchia L, Servili M, Rao R, et al. (2009) Comparative 454 pyrosequencing of transcripts from two olive genotypes during fruit development. BMC Genomics 10 1: 547. [DOI] [PMC free article] [PubMed] [Google Scholar]
- 27. Eveland AL, McCarty DR, Koch KE (2008) Transcript Profiling by 3-Untranslated Region Sequencing Resolves Expression of Gene Families. Plant Physiology 146: 32–44. [DOI] [PMC free article] [PubMed] [Google Scholar]
- 28. Guo S, Zheng Y, Joung JG, Liu S, Zhang Z, et al. (2010) Transcriptome sequencing and comparative analysis of cucumber flowers with different sex types. BMC Genomics 11: 384. [DOI] [PMC free article] [PubMed] [Google Scholar]
- 29. Zhang Z, Wang Y, Wang S, Liu J, Warren W, et al. (2011) Transcriptome Analysis of Female and Male Xiphophorus maculatus Jp 163 A. PLoS One 6 4: e18379. [DOI] [PMC free article] [PubMed] [Google Scholar]
- 30. Chevreux B, Pfisterer T, Drescher B, Driesel AJ, Müller WE, et al. (2004) Using the miraEST assembler for reliable and automated mRNA transcript assembly and SNP detection in sequenced ESTs. Genome Res 14: 1147–1159. [DOI] [PMC free article] [PubMed] [Google Scholar]
- 31.Leopold AC, Willing RP (1983) Evidence of toxicity effects of salt on membranes. In: Staples RC, Toenniessen GH (eds) Plant improvement for irrigated crop production under increasing saline conditions. New York: Wiley. pp 678–685.
- 32. Allen GJ, Chu SP, Harrington CL, Schumacher K, Hoffmann T, et al. (2001) A defined range of guard cell calcium oscillation parameters encodes stomatal movements. Nature 411: 1053–1057. [DOI] [PubMed] [Google Scholar]
- 33. Ikura M, Osawa M, Ames JB (2002) The role of calcium binding proteins in the control of transcription: Structure to function. Bioessays 24: 625–636. [DOI] [PubMed] [Google Scholar]
- 34. Sussman MR (1994) Molecular Analysis of Proteins in the Plant Plasma Membrane Plant Physiol. Plant Mol Biol 45: 211–234. [Google Scholar]
- 35. Yu SP (1997) Choi DW (1997) “Na+–Ca2+ exchange currents in cortical neurons: concomitant forward and reverse operation and effect of glutamate”. European Journal of Neuroscience 9 6: 1273–81. [DOI] [PubMed] [Google Scholar]
- 36. Wheeler GL, Brownlee C (2008) Ca2+ signalling in plants and green algae-changing channels. Trends in Plant Science 13: 506–514. [DOI] [PubMed] [Google Scholar]
- 37. Watad AE, Pesci PA, Reinhold L, Lerner HR (1986) Proton fluxes as a response to external salinity in wild type and NaCl-adapted Nicotiana cell lines. Plant Physiol 81: 454–489. [DOI] [PMC free article] [PubMed] [Google Scholar]
- 38. Mennen H, Jacoby B, Marschner HJ (1990) Is sodium proton antiport ubiquitous in plant cells? Plant Physiol 137: 180–183. [Google Scholar]
- 39. Allen GJ, Jones RGW, Leigh RA (1995) Sodium transport measured in plasma membrane vesicles isolated from wheat genotypes with differing K+/Na+ discrimination traits. Plant Cell Environ 18: 105–115. [Google Scholar]
- 40. Shendure J, Ji H (2008) Next-generation DNA sequencing. Nature Biotechnology 26 10: 1135–1145. [DOI] [PubMed] [Google Scholar]
- 41. Reeder J, Knight R (2010) Rapidly denoising pyrosequencing amplicon reads by exploiting rank-abundance distributions. Nat Methods 7: 668–9. [DOI] [PMC free article] [PubMed] [Google Scholar]
- 42. Cakmak I, Horst WJ (1991) Effect of aluminium on lipid peroxidation, superoxide dismutase, catalase and peroxidase activities in root tips of soybean (Glycine max). Plant Physiol 83: 463–468. [Google Scholar]
- 43. Feibo Wu, Guoping Zhang, Dominy P (2003) Four barley genotypes respond differently to cadmium: lipid peroxidation and activities of antioxidant capacity. Environ Exp Bot 50 1: 67–78. [Google Scholar]
- 44. Valentina M, Micha V, Micha G, Moshe T (2000) Activities of SOD and the ascorbate-glutathione cycle enzymes in subcellular compartments in leaves and roots of the cultivated tomato and its wild salt-tolerant relative Lycopersicon pennellii . Plant Physiol 123 1: 65–77. [Google Scholar]
- 45. Delauney AJ, Verma DPS (1993) Proline biosynthesis and osmoregulation in plants. Plant J 4: 215–223. [Google Scholar]
- 46. Chou HH, Holmes MH (2001) DNA sequence quality trimming and vector removal. Bioinformatics 17: 1093–1104. [DOI] [PubMed] [Google Scholar]
- 47. Chevreux B, Pfisterer T, Drescher B, Driesel AJ, Müller WE, et al. (2004) Using the miraEST assembler for reliable and automated mRNA transcript assembly and SNP detection in sequenced ESTs. Genome Res 14: 1147–1159. [DOI] [PMC free article] [PubMed] [Google Scholar]
- 48. Hong SY, Seo PJ, Yang MS, Xiang F, Park CM (2008) Exploring valid reference genes for gene exp ression studies in Brachypodium distachyon by real-time PCR. BMC Plant Biol 8: 112–122. [DOI] [PMC free article] [PubMed] [Google Scholar]
- 49. Livak KJ, Schmittgen TD (2001) Analysis of Relative Gene Expression Data Using Real-Time Quantitative PCR and the 2(-Delta Delta C(T)) Method. Methods 25 4: 402–408. [DOI] [PubMed] [Google Scholar]
Associated Data
This section collects any data citations, data availability statements, or supplementary materials included in this article.
Supplementary Materials
The gene annotation of up-regulated genes.
(XLS)
The gene annotation of down-regulated genes.
(XLS)
The up-regulated enrichment pathways.
(XLS)
The down-regulated enrichment pathways.
(XLS)
Real-time PCR confirmation of differential expressed genes.
(DOC)
The sequence list of confirmed unigenes.
(DOC)
The original RT figures of 16 validated genes.
(DOC)