Abstract
Reversed-phase liquid chromatography is the most commonly used separation method for shotgun proteomics. Nanoflow chromatography has emerged as the preferred chromatography method for its increased sensitivity and separation. Despite its common use, there are a wide range of parameters and conditions used across research groups. These parameters have an effect on the quality of the chromatographic separation, which is critical to maximizing the number of peptide identifications and minimizing ion suppression. Here we examined the relationship between column lengths, gradient lengths, peptide identifications and peptide peak capacity. We found that while longer column and gradients lengths generally increase peptide identifications, the degree of improvement is dependent on both parameters and is diminished at longer column and gradients. Peak capacity, in comparison, showed a more linear increase with column and gradient lengths. We discuss the discrepancy between these two results and some of the considerations that should be taken into account when deciding on the chromatographic conditions for a proteomics experiment.
Keywords: Shotgun proteomics, nanoflow liquid chromatography, peak capacity
Introduction
The development of shotgun proteomics technologies has enabled the rapid analysis of complex protein samples. Typical problems addressed by shotgun proteomics include protein identification, comparison of protein abundance between two different states (e.g. disease vs. control) and the identification of post-translational modifications [1–3]. A shotgun proteomics experiment consists of three main steps: 1) sample preparation (e.g. protein denaturation, digestion, cleanup; 2) chromatographic separation and mass spectrometric analysis; and 3) bioinformatics analysis. Each step of this method contributes to the quality of data that can be obtained from the experiment, and therefore obtaining best possible results requires each step to be optimized.
Online peptide separation in shotgun proteomics is commonly performed by reversed-phase chromatography. RP-HPLC offers several advantages for peptide separation, including high peak capacity, solvent compositions compatible with ESI, and mitigated ion suppression due to the concurrent elution of peptides with similar degrees of hydrophobicity. Electrospray ionization is the ideal ionization technique for LC-MS due to the easy coupling of the electrospray emitter to the column [4,5]. In a complex protein digest with thousands of peptides at any given point in the gradient, it is possible for there to be many simultaneously eluting peptides. Developments in mass spectrometer technologies have increased the speed and sensitivity of mass spectrometers used in shotgun proteomics improving the ability to sample more ions eluting from the column at any given time [6]. Despite this, a majority of peptides are still not interrogated in a data-dependent analysis. An approach to increasing the identification of peptides is to improve the chromatographic separation of peptides prior to mass spectrometric analysis.
There have been ongoing efforts to study the effects of chromatographic parameters such as the stationary phase, column and gradient lengths on LC-MS/MS performance [7–9]. These parameters are interdependent on each other and have a wide range of possibilities. For example, stationary phase materials can consist of packed particles or a monolithic structure and can vary in their diameter or pore size; all of which may affect chromatographic performance [10–12]. Zhou et al. [13] and Köcher et al. [14] have demonstrated the potential performance increases when using very long gradients of up to ten hours. We are specifically interested in the performance characteristics of LC systems configured for nanoflow chromatography. Nanoflow chromatography has become the preferred LC method due to superior separation and sensitivity [15]. In this study we assess the two chromatographic parameters: column length and gradient length in ranges that are typically used for high throughput shotgun proteomics. Our results suggest while a longer column by itself may improve chromatographic performance, performance improves substantially when paired with a sufficiently long gradient length.
Methods
Sample Preparation
The aqueous soluble fraction of a Caenorhabditis elegans wildtype strain N2 lysate and bovine serum albumin (Thermo Fisher Scientific, Rockford, IL) were digested separately with trypsin as described [16]. Aliquots containing 0.5 μg/μl C. elegans digest and 10 fmol/μl BSA digest in 2% acetonitrile and 0.1% formic acid were prepared and stored at −20 °C. An aliquot was thawed and used for every set of LC-MS/MS runs for a given capillary column length.
LC-MS/MS
The nanoflow HPLC used was a Waters nanoAcquity (Milford, MA). Sample was loaded directly onto column with a 2μl full loop injection at a flow rate of 500 nl/min (0% acetonitrile, 0.1% formic acid). After 5 minutes of loading, a linear gradient was applied at 250 nl/min from 0% acetonitrile, 0.1% formic acid to 32% acetonitrile, 0.1% formic acid for 30, 60 or 90 minutes. A wash step was done for 10 minutes at 80% acetonitrile, 0.1% formic acid, followed by a re-equilibration step for 20 minutes at 0% acetonitrile, 0.1% formic acid.
The capillary columns used were Picofrit columns (New Objective, Woburn, MA), packed with Phenomenex Jupiter Proteo C-12 (90 Å, 4 μm) resin to lengths of 10, 20, 40 and 60 cm (75 μm inner diameter and 360 μm outer diameter). The diameter of the emitter tip of the column was measured to be 10.1, 9.9, 10 and 9.9 μm, respectively.
The mass spectrometer used was a Thermo Scientific LTQ-FT Ultra. Full scan MS spectra were acquired from m/z 400 – 1,400 at a resolving power of 100,000. Target ion counts of 1,000,000 ions were acquired with a maximum injection time of 500 ms. Five data-dependent MS/MS spectra were acquired of the five most abundant ion species in the preceding MS scan in the LTQ at unit resolution, with 2,000 target ions and a 100 ms maximum injection time. Dynamic exclusion was set with a repeat count of 1 and a 30 s exclusion window.
Peptide Database Search
Precursor monoisotopic mass and charge state were assigned to the MS/MS spectra using the computer program Bullseye [17]. MS/MS spectra were searched using the SEQUEST [18] algorithm (version 27) against a protein database containing C. elegans proteins (www.wormbase.org, Release WS160, 2/11/06) and the Bovine Serum Albumin protein sequence. A static modification of 57.021464 on cysteine was used to account for carbamidomethyl modifications. The precursor mass tolerance was set to 10 ppm and enzyme specificity was set to semi-tryptic. A false discovery rate (FDR) threshold of 1% was used for peptide spectrum matches and was determined using the Percolator algorithm [19]. Decoy databases were generated by reversing the protein sequences from the target database.
Peptide Peak Capacity
Peptide peak capacity, p, was calculated by dividing the length of the linear portion of the gradient, tg, by the average full width at half maximum (FWHM), w, for all peptides identified in a run (Equation 1).
| (Eq. 1) |
The FWHM of a peptide was measured using a software tool developed in house and written in Java. Briefly, for every unique peptide identified, an extracted ion chromatogram was generated with a 10 ppm window around the M+0, M+1 and M+2 isotope peaks for 30 MS scans before and after the peptide’s MS/MS scan. The extracted ion chromatogram was fit to a Gaussian function and the FWHM calculated from the function. The quality of the Gaussian fit was assessed by a Pearson’s correlation and peptides with a correlation less than 0.9 were removed from the peak capacity calculation.
Results and Discussion
LC-MS/MS
The data used for our characterization of LC-MS/MS performance were collected from the analysis of a trypsin digestion of C. elegans lysate, spiked with bovine serum albumin, as described in Methods. A sampling of the types of chromatography performed in the proteomics field was collected through a literature search for “shotgun proteomics” in the years 2010 and 2011, and 52 publications were randomly selected. In these publications a wide range of chromatographic conditions were found to have been used. For instance, column lengths were found to vary from 7 cm to 35 cm (Supplementary Figure 1). Based on our literature search of chromatographic conditions typically used, we selected column lengths of 10, 20, 40 and 60 cm; and linear gradient lengths of 30, 60 and 90 minutes to encompass this range of parameters and to test the effects of column lengths longer than what is typically used.
To reduce the effects of systematic error, the order of sample analyses were randomized. All runs for a given column length were run sequentially and the order of the columns was randomized. For each column, three sets of samples were run. Each set consisted of three runs, one of each gradient length, in a random order. In total, 36 sample analyses were performed.
Peptide Identifications
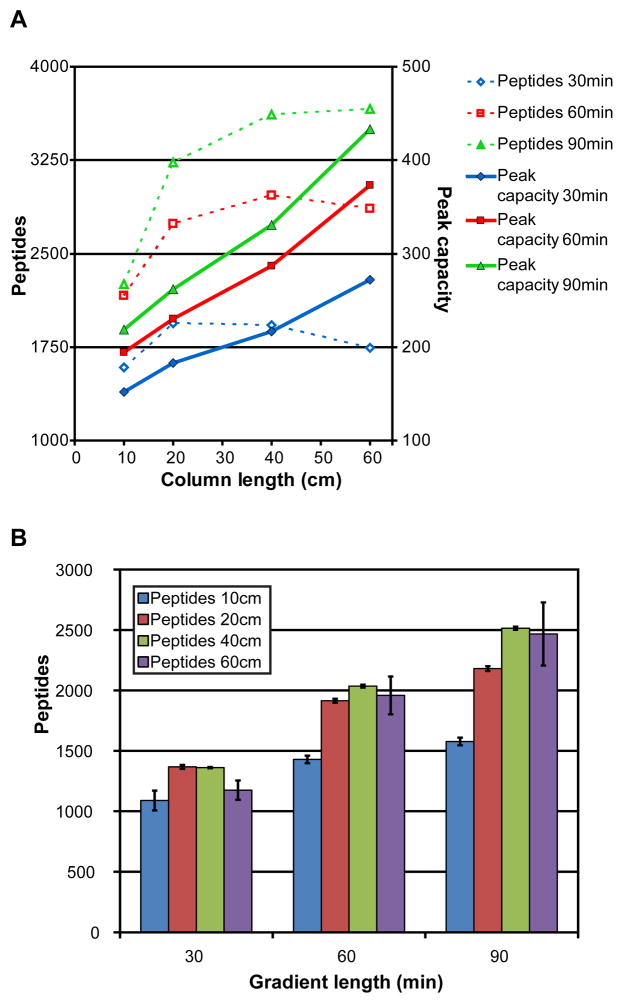
One of the metrics commonly used to evaluate LC-MS/MS performance is the number of peptides identified through database searching. A database search of the collected MS/MS spectra, using the SEQUEST algorithm, showed a general increase in peptide identifications as column and gradient lengths were increased (Figure 1, Supplementary Table 1). The increase in peptides IDs was most pronounced from 10 to 20 cm column lengths. From 40 to 60 cm, little to no increase in peptide identifications was observed.
Figure 1.
A)Peptide identifications and peak capacity measurements are plotted for the analyses done in this study. Each combination of column and gradient lengths was run in triplicate. The total number of peptides identified by database search and the average calculated peak capacity are shown. B) The average number of peptide identifications from the analyses are plotted in bar plot form. The standard deviation of the number of peptide identifications is indicated by the error bars.
With respect to gradient lengths, peptide identifications increased as the length of the linear gradient increased. The smallest degree of improvement was observed for 10 cm columns from 60 minutes to 90 minute gradient lengths, while the greatest increases in peptide IDs with increasing gradients were from the longer column lengths; indicating that the degree of improvement obtained by increasing gradient length is dependent on the length of the column (Figure 1B).
Peak Capacity
Chromatographic performance of gradient elution liquid chromatography has been traditionally measured by peak capacity, which has been defined as the maximum number of peaks that can be separated over a chromatographic column [20]. We have calculated the peak capacity from our datasets to assess the relationship between peak capacity and peptide identifications and its usefulness in evaluating LC-MS/MS performance.
Methods for calculating peak capacity from LC-MS/MS data normally involve manual measurement of peak widths from a small sample of peptides. We observed initially through manual peak measurements that in a single LC-MS/MS analysis, peptides can have a wide range of peak widths. Therefore, determining peak capacity by manual peak measurement of a few select peptides may not provide representative peak capacity values for the complex mixture. To obtain a comprehensive measurement of peptide peak widths, we used in-house developed software that extracts the elution profile of every peptide identified and determines its width by fitting the peak shape to a Gaussian function, an ideal chromatographic peak shape (see Methods). After discarding extracted ion chromatograms that did not pass a scoring threshold for fitting to the Gaussian function, we were able to obtain, for each set of analyses on a column, peak width measurements for an average of 91% of the unique peptides identified by database search.
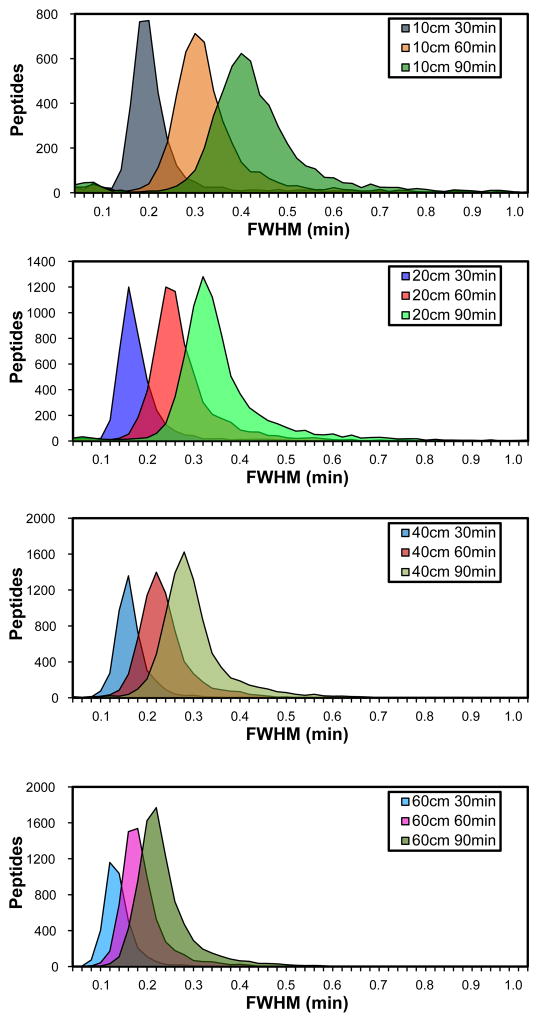
A histogram of the peak widths measured illustrates the dramatic range of peak widths across column and gradient lengths and within a given column and gradient combination (Figure 2, Supplementary Table 2). The starting and ending mobile phase conditions for the linear portion of the gradient were kept constant, and as expected, peak widths increased as gradient lengths increased. Also observed was that as column lengths increased for a given gradient length, peak widths decreased. The analysis with the greatest average peak width of 0.412 minutes (24.7 seconds) was the 10 cm column with a 90 minute. The analysis with the smallest average peak width was the 60 cm column and 30 minute gradient analysis with an average peak width of 0.110 minutes (6.6 seconds).
Figure 2.
A histogram of the measured peptide peak widths (FWHM) for the LC-MS/MS analyses. Peptide peak widths were measured using in-house developed software as described in Methods. The peak width values from the replicates were combined.
From the measured peak width, a peak capacity value was calculated for each analysis and compared to the peptide identification results (Figure 1A, Supplementary Table 3). Unlike the peptide identification results, we observed a linear increase in peak capacity with respect to column length.
Signal suppression
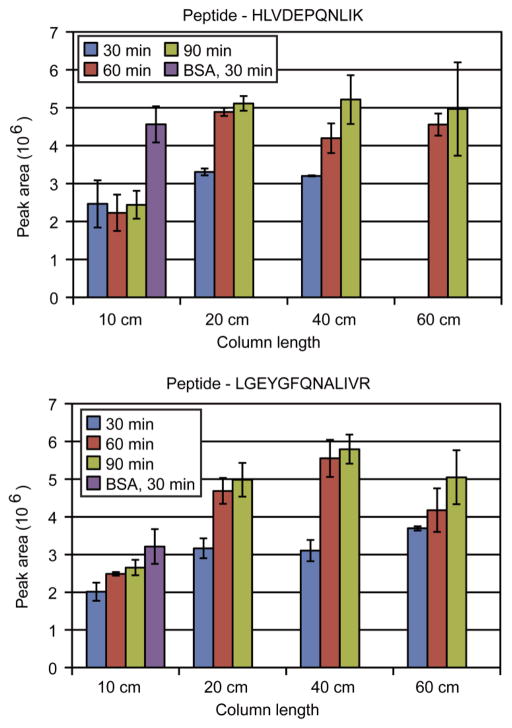
ESI-LC-MS/MS has been known to be subject to ion suppression effects [21,22]. The effects of ion suppression are more prevalent in complex samples where there is an increase in analytes competing for charge or access to the surface of the electrospray droplet [23]. To assess the effects of the changing chromatography parameters on peptide abundance measurements, trypsin digested bovine serum albumin was added to the C. elegans lysate sample. With each injection, 20 fmol of the BSA digest was injected. The integrated peak areas of two peptides from BSA that were found in the majority of analyses were measured (Figure 3).
Figure 3.
The integrated peak areas for two peptides from bovine serum albumin that was added to the C. elegans lysate is shown for each gradient and column length condition. The peak areas were averaged from the available replicates and the standard deviation shown with error bars. The peptide, HLVDEPQNLIK, was not identified by database search in the 60 cm / 30 min analyses.
For the two peptides monitored there was a general trend of increasing measured peptide abundance (i.e., less ion suppression) with increasing column and gradient lengths. Similar to the peptide identification results, the most noticeable increase is from the 30 to 60 minute gradient times, and from the 10 to 20 cm column lengths. We did not observe any significant difference in the peptide abundance between the 20, 40 and 60 cm columns. For comparison against a sample with reduced suppression effects, 20 fmol of BSA digest was loaded, without C. elegans lysate, onto a 10 cm column and separated over a 30 minute gradient. The average intensity was significantly higher than the corresponding sample analyses that included the C. elegans lysate and this difference is indicative of the degree of ion suppression that was present as a result of the complex peptide background.
Conclusions
In this study we set out to examine the effects of the column and gradient length parameters on chromatography performance, specifically in the nanoLC-MS/MS analysis of a complex peptide sample. In our results, while there is an overall increase in peptide identifications as chromatography improved, the rate of improvement decreased as each parameter increased. This rate of improvement of peptide identifications is in contrast to our peak capacity calculations, which showed an expected linear increase with respect to column lengths.
Plotting peptide identifications versus peak capacity showed a positive correlation between the two. For data acquired within a given column, the correlation was strong with r2 values greater than 0.92 in all the column datasets (Supplementary Figure 2). Amongst the whole dataset, the correlation was less strong with an r2 value of 0.59. We hypothesize that the discrepancy between peak capacity and peptide identifications can be explained by the process of MS/MS spectra acquisition and its relationship to peptide elution. MS/MS spectra were acquired in this analysis at approximately 5 spectra per second (data not shown). If peak widths decrease, as was observed when column lengths are increased, there is a reduced amount of time where eluting peptides are available to be sampled. This reduced sampling opportunity results in fewer peptide identifications despite an improvement in peptide separation.
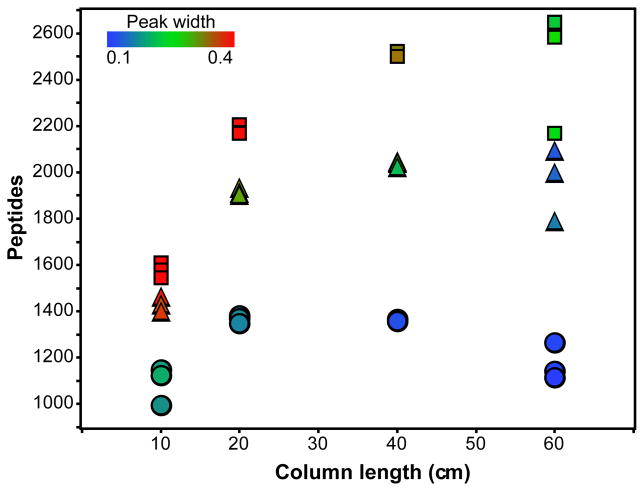
Increasing gradient lengths affected peptide identifications primarily by increasing the sampling time of the entire analysis. Because the rate of spectrum acquisition is near constant, the total number of spectra acquired is directly proportional to the gradient length. Increasing gradient lengths from 30 to 60 or 90 minutes doubles and triples the total number of MS/MS spectra. While a smaller proportion of all spectra will be identified in the longer gradients, the increase in the number of spectra acquired over the same mobile phase composition increases the chance of sampling unique peptides. Longer gradients do result in some peak broadening, however peaks do not broaden proportionally to the increase in gradient length so there is still an improvement in separation power as indicated by the increasing peak capacity values. Peptide peak widths, which are indicative of peptide sampling opportunity, can be plotted against the number of peptide identifications and the column length illustrating the relationship between these three values (Figure 4).
Figure 4.
A scatterplot of the number of peptide identifications with respect to column length. Square, triangle and circle data points are analyses with 90, 60 and 30 minute gradients, respectively. The color of each data point indicates the average peak width for the analyses.
Two factors that were not adjusted in this study, but would likely have an impact on the relationship between chromatographic and proteomics performance are 1) mass spectrometry instrumentation and method, and 2) sample complexity. A mass spectrometer with a faster scan cycle would be able to take advantage of better chromatographic separation by improved sampling of an analysis with a low MS/MS sampling opportunity. The analysis performed here was a discovery-based, shotgun proteomics analysis in a data dependent acquisition mode. Data dependent acquisition isolates and fragments a narrow mass range sequentially and is biased towards more abundant ions. Other analysis types such as a targeted analysis by selected reaction monitoring or data independent acquisition, where a specified mass range is continually monitored, would not be affected as by chromatographic conditions as dramatically as a data dependent analysis.
In this study, we used a complex peptide mixture from C. elegans lysate because this type of sample that would benefit most from good chromatographic separation. A simpler peptide mixture would have fewer simultaneously eluting peptides, resulting in a greater sampling opportunity for each peptide and would be affected less by the quality of the peptide separation.
Our results show that shotgun proteomics experiments will typically benefit from the use of longer column and gradient lengths, but the benefits of column length are only obtained when there is a sufficiently long gradient length (Figure 1B). Increasing gradient length, however, has a proportional effect on limiting sample throughput. For example, increasing a gradient length to several hours would increase peptide identifications but would dramatically reduce sample throughput. Additionally, the increase in peptide identifications may be minimal. Our measurements of peptide abundance showed some of the additional advantages of improved chromatographic separation. In some conditions the integrated peak areas for the BSA peptides increased by more than two fold compared to the short column and gradient analyses (Figure 3). The improvement of peak areas would be important in analyses when performing quantitative or differential peptide measurements.
Supplementary Material
Acknowledgments
This work was supported by The Yeast Resource Center (NIH P41GM103533) and the NIH (R01DK069386).
References
- 1.Swanson SK, Washburn MP. The continuing evolution of shotgun proteomics. Drug Discov Today. 2005;10:719–25. doi: 10.1016/S1359-6446(05)03450-1. [DOI] [PubMed] [Google Scholar]
- 2.Becker CH, Bern M. Recent developments in quantitative proteomics. Mutat Res. 2011;722:171–82. doi: 10.1016/j.mrgentox.2010.06.016. [DOI] [PMC free article] [PubMed] [Google Scholar]
- 3.Cantin GT, Yates JR. Strategies for shotgun identification of post-translational modifications by mass spectrometry. J Chromatogr A. 2004;1053:7–14. doi: 10.1016/j.chroma.2004.06.046. [DOI] [PubMed] [Google Scholar]
- 4.Emmett MR, Caprioli RM. Micro-electrospray mass spectrometry: Ultra-high-sensitivity analysis of peptides and proteins. J Am Soc Mass Spectrom. 1994;5:605–613. doi: 10.1016/1044-0305(94)85001-1. [DOI] [PubMed] [Google Scholar]
- 5.Gatlin CL, Kleemann GR, Hays LG, Link AJ, Yates JR. Protein identification at the low femtomole level from silver-stained gels using a new fritless electrospray interface for liquid chromatography-microspray and nanospray mass spectrometry. Anal Biochem. 1998;263:93–101. doi: 10.1006/abio.1998.2809. [DOI] [PubMed] [Google Scholar]
- 6.Olsen JV, Schwartz JC, Griep-Raming J, Nielsen ML, Damoc E, Denisov E, Lange O, et al. A dual pressure linear ion trap Orbitrap instrument with very high sequencing speed. Mol Cell Proteomics. 2009;8:2759–69. doi: 10.1074/mcp.M900375-MCP200. [DOI] [PMC free article] [PubMed] [Google Scholar]
- 7.Xu P, Duong DM, Peng J. Systematical optimization of reverse-phase chromatography for shotgun proteomics. J Proteome Res. 2009;8:3944–50. doi: 10.1021/pr900251d. [DOI] [PMC free article] [PubMed] [Google Scholar]
- 8.Köcher T, Swart R, Mechtler K. Ultra-high-pressure RPLC hyphenated to an LTQ-Orbitrap Velos reveals a linear relation between peak capacity and number of identified peptides. Anal Chem. 2011;83:2699–704. doi: 10.1021/ac103243t. [DOI] [PubMed] [Google Scholar]
- 9.Eeltink S, Dolman S, Swart R, Ursem M, Schoenmakers PJ. Optimizing the peak capacity per unit time in one-dimensional and off-line two-dimensional liquid chromatography for the separation of complex peptide samples. J Chromatogr A. 2009;1216:7368–74. doi: 10.1016/j.chroma.2009.02.075. [DOI] [PubMed] [Google Scholar]
- 10.Fairchild JN, Walworth MJ, Horváth K, Guiochon G. Correlation between peak capacity and protein sequence coverage in proteomics analysis by liquid chromatography-mass spectrometry/mass spectrometry. J Chromatogr A. 2010;1217:4779–83. doi: 10.1016/j.chroma.2010.05.015. [DOI] [PubMed] [Google Scholar]
- 11.Liu H, Finch JW, Lavallee MJ, Collamati RA, Benevides CC, Gebler JC. Effects of column length, particle size, gradient length and flow rate on peak capacity of nano-scale liquid chromatography for peptide separations. J Chromatogr A. 2007;1147:30–6. doi: 10.1016/j.chroma.2007.02.016. [DOI] [PubMed] [Google Scholar]
- 12.Horie K, Sato Y, Kimura T, Nakamura T, Ishihama Y, Oda Y, Ikegami T, et al. Estimation and optimization of the peak capacity of one-dimensional gradient high performance liquid chromatography using a long monolithic silica capillary column. J Chromatogr A. 2012;1228:283–91. doi: 10.1016/j.chroma.2011.12.088. [DOI] [PubMed] [Google Scholar]
- 13.Zhou F, Lu Y, Ficarro SB, Webber JT, Marto JA. Nanoflow Low Pressure High Peak Capacity Single Dimension LC-MS/MS Platform for High-Throughput, In-Depth Analysis of Mammalian Proteomes. Anal Chem. 2012;84:5133–9. doi: 10.1021/ac2031404. [DOI] [PMC free article] [PubMed] [Google Scholar]
- 14.Köcher T, Pichler P, Swart R, Mechtler K. Analysis of protein mixtures from whole-cell extracts by single-run nanoLC-MS/MS using ultralong gradients. Nat Protoc. 2012;7:882–90. doi: 10.1038/nprot.2012.036. [DOI] [PubMed] [Google Scholar]
- 15.Kennedy RT, Jorgenson JW. Preparation and evaluation of packed capillary liquid chromatography columns with inner diameters from 20 to 50 micrometers. Anal Chem. 1989;61:1128–1135. [Google Scholar]
- 16.Hoopmann MR, Merrihew GE, von Haller PD, MacCoss MJ. Post analysis data acquisition for the iterative MS/MS sampling of proteomics mixtures. J Proteome Res. 2009;8:1870–5. doi: 10.1021/pr800828p. [DOI] [PMC free article] [PubMed] [Google Scholar]
- 17.Hsieh EJ, Hoopmann MR, MacLean B, MacCoss MJ. Comparison of database search strategies for high precursor mass accuracy MS/MS data. J Proteome Res. 2010;9:1138–43. doi: 10.1021/pr900816a. [DOI] [PMC free article] [PubMed] [Google Scholar]
- 18.Eng JK, McCormack AL, Yates JR. An approach to correlate tandem mass spectral data of peptides with amino acid sequences in a protein database. J Am Soc Mass Spectrom. 1994;5:976–989. doi: 10.1016/1044-0305(94)80016-2. [DOI] [PubMed] [Google Scholar]
- 19.Käll L, Canterbury JD, Weston J, Noble WS, MacCoss MJ. Semi-supervised learning for peptide identification from shotgun proteomics datasets. Nat Methods. 2007;4:923–5. doi: 10.1038/nmeth1113. [DOI] [PubMed] [Google Scholar]
- 20.Giddings JC. Maximum number of components resolvable by gel filtration and other elution chromatographic methods. Anal Chem. 1967;39:1027–1028. [Google Scholar]
- 21.Buhrman DL, Price PI, Rudewicz PJ. Quantitation of SR 27417 in human plasma using electrospray liquid chromatography-tandem mass spectrometry: A study of ion suppression. J Am Soc Mass Spectrom. 1996;7:1099–1105. doi: 10.1016/S1044-0305(96)00072-4. [DOI] [PubMed] [Google Scholar]
- 22.Annesley TM. Ion suppression in mass spectrometry. Clin Chem. 2003;49:1041–4. doi: 10.1373/49.7.1041. [DOI] [PubMed] [Google Scholar]
- 23.Cech NB, Enke CG. Practical implications of some recent studies in electrospray ionization fundamentals. Mass Spectrom Rev. 2001;20:362–87. doi: 10.1002/mas.10008. [DOI] [PubMed] [Google Scholar]
Associated Data
This section collects any data citations, data availability statements, or supplementary materials included in this article.


