

Background: Transcriptional regulation plays an essential role in the development of cardiac hypertrophy.
Results: Pol II and H3K9-acetyl chromatin immunoprecipitation reveal unique transcriptional patterns in the heart.
Conclusion: Both de novo recruitment and promoter-pausing of pol II play critical roles in regulating specialized and housekeeping genes, respectively.
Significance: Understanding transcriptional regulation helps in deciphering the mechanisms underlying hypertrophy.
Keywords: Chromatin Immunoprecipitation (ChiP), Gene Transcription, Histone Modification, RNA Polymerase II, Transcription Regulation
Abstract
Cardiac hypertrophy is characterized by a generalized increase in gene expression that is commensurate with the increase in myocyte size and mass, on which is superimposed more robust changes in the expression of specialized genes. Both transcriptional and posttranscriptional mechanisms play fundamental roles in these processes; however, genome-wide characterization of the transcriptional changes has not been investigated. Our goal was to identify the extent and modes, RNA polymerase II (pol II) pausing versus recruitment, of transcriptional regulation underlying cardiac hypertrophy. We used anti-pol II and anti-histone H3K9-acetyl (H3K9ac) chromatin immunoprecipitation-deep sequencing to determine the extent of pol II recruitment and pausing, and the underlying epigenetic modifications, respectively, during cardiac growth. The data uniquely reveal two mutually exclusive modes of transcriptional regulation. One involves an incremental increase (30–50%) in the elongational activity of preassembled, promoter-paused, pol II, and encompasses ∼25% of expressed genes that are essential/housekeeping genes (e.g. RNA synthesis and splicing). Another involves a more robust activation via de novo pol II recruitment, encompassing ∼5% of specialized genes (e.g. contractile and extracellular matrix). Moreover, the latter subset has relatively shorter 3′-UTRs with fewer predicted targeting miRNA, whereas most miRNA targets fall in the former category, underscoring the significance of posttranscriptional regulation by miRNA. The results, for the first time, demonstrate that promoter-paused pol II plays a role in incrementally increasing housekeeping genes, proportionate to the increase in heart size. Additionally, the data distinguish between the roles of posttranscriptional versus transcriptional regulation of specific genes.
Introduction
The regulation of gene expression is fundamental to organogenesis and pathogenesis, including cardiac hypertrophy. During hypertrophy there are two distinct transcriptional events that occur, a generalized increase in total RNA synthesis that underlies the 30–50% increase in cell volume (1–3), on which is superimposed a more dramatic change in the expression of specific genes, such as atrial natriuretic factor (ANF) and α-skeletal actin (αSkAc) (4, 5). The latter mode of transcription has been studied in more detail with regard to its regulation by specific transcription factors and enhancers (6, 7). However, the mechanisms involved in the generalized increase in total cellular protein commensurate with the increase in cell size remain poorly characterized.
The changes in gene expression during cardiac development or disease have been commonly assessed by cDNA microarrays, or more recently by deep sequencing, which measure the relative changes in mRNA levels in the heart (8–10). Although the methods used do not distinguish between transcriptional and posttranscriptional mechanisms that underlie the changes in mRNA levels, the preconceived assumption is that they are predominantly transcriptional in nature. However, after the discovery of miRNA2 and the extent to which they posttranscriptionally regulate gene expression (11), the challenging question now is: to what extent does transcriptional versus posttranscriptional regulation contribute to the changes in gene expression in the heart?, which is in part what we have attempted to address in this study.
The central dogma that has dominated until recently suggests that transcription of most genes is mainly initiated by the recruitment of RNA polymerase II (pol II) and the preinitiation complex to the transcription start site (TSS), whereas the preassembly of paused pol II is reserved for only select genes (12). With the advent of chromatin immunoprecipitation (ChIP) and ChIP-Sequencing (Seq) and quantitative in situ hybridization technologies, we are starting to realize that promoter-proximal pol II pausing is more widespread than was previously thought, as identified in the Drosophila genome (13–15). However, until now we did not know whether this phenomenon is involved in gene regulation in any mammalian organ during development or disease. In this study our ChIP-Seq data revealed unprecedented details of transcriptional regulation during cardiac hypertrophy.
EXPERIMENTAL PROCEDURES
Animals
The work was done in accordance with US National Institutes of Health Guidelines for the Care and Use of Laboratory Animals (No. 85-23). All animal protocols were approved by the Institutional Animal Care and Use Committee at the New Jersey Medical School.
Transverse Aortic Constriction
Twelve-week-old C57BL/6 mice were anesthetized intraperitoneally with a mixture of ketamine (65 mg/kg), xylazine (13 mg/kg), and acepromazine (2 mg/kg). The adequacy of the anesthetic was confirmed by the loss of tongue retraction reflex. The transverse thoracic aorta between the innominate artery and the left common carotid artery was dissected free, and a 7-0 braided polyester suture was tied around the aorta against a 28-gauge needle with the aid of an operating microscope. The needle was removed, the chest closed, and the mice were extubated and allowed to recover in a Thermocare unit (temperature 88 °F or 31 °C; humidity 30–50%; oxygen 1–2 ml/min, low flow range). Postoperative buprenorphine (0.01–0.05 mg/kg) was administered subcutaneously every 12 h, as needed. The sham operation involved the same procedure, except the aorta was not constricted.
ChIP-Seq of Sham, TAC-induced Hypertrophy, and Neonatal Hearts
The hearts were isolated from 12–13-week-old C57BL/6 mice 4 days after transverse aortic constriction (TAC, n = 3) or a sham operation (n = 2), or from normal mice (n = 1), and from two litters of 1-day-old C57BL/6 neonate pubs. The hearts from the TAC, sham/normal, and neonatal hearts were pooled and subjected to RNA pol II and H3K9ac ChIP-Seq (Genpathway, now a part of ActiveMotif, Inc). Immunoprecipitation was performed using anti-RNA pol II CTD (Abcam; ab5095) and anti-H3K9ac (ActiveMotif; 39918), followed by high throughput Illumina sequencing using Illumina Genome Analyzer 2. Sequencing of input DNA taken before immunoprecipitation served as control for normalization and eliminating background noise.
ChIP-Seq Analysis
The following analysis was performed by ActiveMotif Inc.
Sequence Analysis
36 nucleotides of the sequencing reads (tags, >10 million) with no more than 2 mismatches were aligned to the genome using ELAND algorithm.
Determination of Fragment Density
Tags were extended (110–200 bp) at their 3′ end in silico. The genome was divided into 32-nucleotide bins, and the density of the fragments (extended tags) in each bin was determined. The results of this are stored in a binary analysis results file.
Peak Finding (Intervals)
Intervals are defined genomic regions that represent the fragment density peaks. It must have three consecutive bins with fragment densities greater than the threshold (usually 10–20).
Active Regions
For the purpose of comparison between samples, regions with overlapping intervals are grouped into active regions.
Annotation
The locations and proximities to gene annotations of intervals and active regions were defined and compiled in Excel spreadsheets, which include average and peak fragment densities.
Quantitative Polymerase Chain Reaction (qPCR)
Total RNA was reversed transcribed to cDNA using a High Capacity cDNA Reverse Transcription Kit (Applied Biosciences) according to the manufacturer's protocol. Quantitative PCR was performed using TaqMan gene expression assays (primer/probe sets) on Applied Biosystems 7500 Real-Time PCR system for the following genes: 18S (Mm03928990_g1), GAPDH (Mm99999915_g1), Nppa (Mm01255747_g1), Ankrd1 (Mm00496512_m1), Vdac1 (Mm00834272_m1), Pnn (Mm00447098_m1), and Calm1 (Mm01336281_g1).
Western Blotting
Ten-μg protein samples were subjected to electrophoresis on 4–15% SDS-PAGE (Criterion gels; Bio-Rad). The antibodies used for Western blot analysis included anti-ANKRD1 (Santa Cruz), anti-CDK9 (Santa Cruz), anti-myosin, slow (Sigma), anti-TFIIB (Millipore), anti-GAPDH (Chemicon), anti-Vdac1 (Genscript), anti-GFP (BD Biosciences), anti-luciferase (Novus Biologicals), anti-BNIP3 (Genscript), and anti-Nelf-A (Santa Cruz Biotechnology). The signal was detected and quantified by the Odyssey Imaging System (LI-COR).
Statistics
Calculation of significance between two groups was performed using an unpaired, two-tailed Student's t test (Excel software). p < 0.05 was considered significant.
RESULTS
Anti-Pol II and Anti-H3K9ac ChIP-Seq Reveal Widespread Promoter-Proximal Pausing of Pol II in the Quiescent Adult Heart and Its Incremental Release during Active Growth
To determine which genes are regulated by changes in the transcription levels, as well as, to understand how the expression of essential/housekeeping genes parallels the increase in myocyte size and mass during hypertrophy, we applied anti-pol II and anti-H3K9ac ChIP-Seq to the mouse heart undergoing either postnatal or pressure-induced hypertrophy. This approach measures the genome-wide levels of pol II associated with genes as a direct reflection of their transcriptional activity. In parallel, hyperacetylation of H3K9 is associated with promoter activation (16, 17). This approach also reveals the level of promoter pausing of pol II and its release under different conditions. As previously noted, the expression of paused genes is not completely halted, but proceeds at a relatively low level (18). One predicted function of pausing is that it may fine tune the expression of a gene; however, until now the functional relevance of pausing during development or disease has not been identified.
Specifically, we applied anti-pol II and anti-H3K9ac ChIP-Seq to 1-day-old neonatal, 12-week adult, and pressure overload-induced mice hearts. The results show that 51, 31, and 42% of NCBI (National Center for Biotechnology Information) mouse gene promoters in the adult, neonatal, and TAC hearts, respectively, have RNA pol II intervals (three consecutive 32-nucleotide bins with fragment densities greater than threshold) (Fig. 1a). However, 68, 64, and 68% of the promoters in the same tissues, respectively, had H3K9ac modifications (Fig. 1a). This reveals that H3K9ac is associated with active/paused as well as inactive (lacking pol II) promoters (e.g. klf5 and Fzd3, supplemental Fig. 1S). In contrast, all promoters that were occupied by pol II were H3K9-acetylated.
FIGURE 1.

RNA pol II and H3K9ac ChIP-Seq reveal widespread promoter-proximal pausing of pol II in the adult heart. A pool of 10 2-day neonatal; 1 × 12-week adult and 2 sham-operated; and 3 × 4-day TAC mice hearts were fixed, DNA-extracted, and subjected to either anti-pol II or anti-H3K9ac immunoprecipitation followed by deep sequencing, and the results were analyzed as described under “Experimental Procedures.” a, percentage of NCBI genes in the adult neonatal and TAC mouse hearts with pol II or H3K9ac intervals (an interval is defined as chromatin region with three consecutive 32-nucleotide bins with fragment densities greater than threshold). b, heatmap of the log2 values of the average pol II or H3K9ac densities of the neonatal/adult (N/A) and the TAC/adult hearts (T/A) in the TSS (−300 to +300), the in-gene (+300 to end), and downstream (end to +5000) regions, as indicated. c and d, cumulative reads of pol II (c) or H3K9ac (d), graphed for probe trends at the TSS, in-gene, and downstream regions (SeqMonk software, Babraham Bioinformatics). e, boxplots of the average pol II densities in TSS of adult, neonatal, and TAC genes, in which the average adult TSS/in-gene density was >6.2 (average of all genes).
To view the pol II binding pattern relative to changes in H3K9 acetylation during neonatal or TAC-induced hypertrophic growth of the heart, we generated a heatmap of the log2 values of average pol II densities of neonatal/adult (N/A) and TAC/adult (T/A) at the TSS (−300 to +300), in-gene (+300 to 3′ boundary), and downstream (3′ boundary to +5000) and similarly for the H3K9ac densities at the TSS (−1000 to +1000) and the in-gene region. The data reveal that the majority of the expressed genes (∼80%) exhibit a reduction (log2 <0) in pol II density at the TSS in the growing hearts relative to the adult (Fig. 1b, lanes 1 and 6). Most of these genes are accompanied by none, or little, change in in-gene pol II (Fig. 1b, lanes 2 and 7). However, the decrease in promoter pol II, accompanied by none or little increase in in-gene pol II, is associated with an increase (log2 >0) in downstream pol II in 50% of those genes (Fig. 1b, lanes 3 and 8). The results indicated a generalized, synchronous, and incremental increase in promoter clearance of paused pol II with little or no de novo recruitment. This interpretation was validated by the commensurate incremental increase in promoter H3K9 acetylation (an indicator of promoter activation, lanes 4, 5, 9, and 10). On the other hand, 4 and 23% of genes in the TAC and neonatal hearts, respectively, exhibited reduced (log2 <0) TSS, in-gene, and downstream pol II that was associated with reduced promoter H3K9ac content, denoting lower transcriptional activity. A much smaller fraction of genes (∼5%) in either the neonatal or the TAC-induced heart exhibited a generalized increase in pol II and H3K9 content (Fig. 1b).
A graphical representation of the cumulative pol II density in the TSS, in-gene, or downstream regions confirms that the overall trend in pol II distribution across the genome reveals 60 and 50% reduction in TSS pol II in the neonatal and TAC hearts, respectively, relative to the adult heart, with little change in the in-gene pol II, accompanied by an equivalent increase in downstream accumulated pol II in both, reflecting the widespread release of promoter-proximal pol II pausing during cardiac growth (Fig. 1c). Consistently, H3K9ac modification is increased, confirming an increase in the activation status of these promoters (Fig. 1d). The incremental (10%) nature of this change reflects the incremental increase in transcription induced by this type of regulation. The boxplot in Fig. 1e shows the mean, minimum, maximum, first and third quartiles of the average pol II density at the TSS of paused genes (40%) in the adult heart (paused genes cutoff (pausing index): TSS/in-gene > 6.2, which is the average TSS/in-gene for all genes) compared with their neonatal and TAC counterparts. Notably, TAC-induced hypertrophy recapitulates postnatal cardiac growth.
Anti-Pol II and Anti-H3K9ac ChIP-Seq in the Neonatal, Adult, and TAC Hearts Reveal Four Distinct Transcriptional Patterns
According to the patterns of pol II binding and H3K9ac modification at the TSS (promoter-proximal), in-gene, and downstream regions that were observed in the neonatal and TAC hearts versus the adult heart, we could categorize transcriptional regulation during cardiac growth into four distinct groups. The upper graphs in Fig. 2 (Fig. 2, a, c, e, and g) show the log2 values of the average pol II (P) and the H3K9ac (A) densities of TAC/adult (T/A) and of neonatal/adult (N/A) in the promoter (Pr), in-gene (I), and downstream (D) regions. The lower graphs (Fig. 2, a, c, e, and g) represent the average pol II and H3K9ac densities in the same regions. Fig. 2, b, d, f, and h, shows Integrated Genome Browser (IGB) images of two representative genes from each of the transcriptional patterns described in each group (Fig. 2, b, d, f, and h). The most prevalent, as noted in Fig. 1, is a group of genes that exhibit lower TSS pol II during neonatal or TAC-induced growth versus adult (log2 PrP T/A or N/A <0) and a consistent, albeit modest (∼10%), increase in H3K9ac (log2 PrA T/A or N/A >0), which are associated with an incremental increase in the downstream pol II (log2 DP T/A or N/A >0, Fig. 2a). This characterizes genes that are exhibiting synchronous and incremental increases in promoter clearance of pol II (26.7 and 17.8% of the TAC and neonatal genes, respectively, Fig. 2i), and which fall mainly in the category of essential/housekeeping genes (e.g. aminoacyl-tRNA biosynthesis and ubiquitin-mediated proteolysis, Table 1 and supplemental Tables 1S and 2S and Figs. 2S and 3S). Notably, there were few differences between the neonatal and TAC-induced growth in this functional group of genes. Shown as examples for this group are the IGB images for pinin (Pnn) and voltage-dependent anion channel 1 (Vdac1, Fig. 2b).
FIGURE 2.

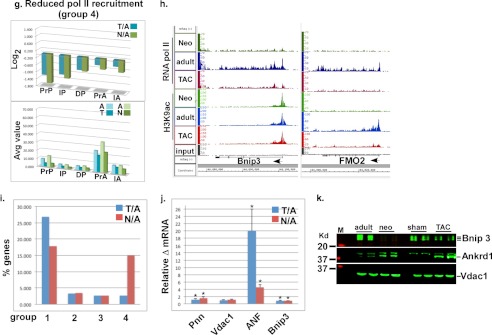
Pol II and H3K9ac ChIP-Seq in the neonatal, adult, and TAC hearts reveal four distinct transcriptional patterns. Pol II (P)- and H3K9ac (A)-positive genes were grouped into four categories, and the log2 values of TAC/adult (T/A) and neonatal/adult (N/A) of the pol II in promoter proximal (PrP, −300 to +300), the in-gene (IP, +300 to end), and the downstream (DP, end to +5000), and of the H3K9ac in promoter proximal (PrA, −1000 to +1000), the in-gene (IA, +1000 to end) region, were plotted. a, upper, plot of average log2 values of average pol II or H3K9ac densities of T/A or N/A in the different gene regions, of a group of genes with log2 of T/A or N/A average densities at the promoter region which is <0 for pol II and >0 for H3K9ac. a, lower, plot of the average densities for the same sample. b, d, f, and h, binary analysis results files of the data viewed in an Affimetrix IGB, which shows the fragments densities of pol II and H3K9ac (y axis) aligned in 32-nucleotide bins along the coordinates (x axis) for the individual genes listed. c, upper, plot of average log2 values of average pol II or H3K9ac densities of T/A or N/A in the different gene regions, of a group of genes with log2 of T/A or N/A average pol II densities which is <0 at the promoter region and >0.75 in the in-gene. c, lower, plot of the average densities for the same sample. e, upper, plot of average log2 values of average pol II or H3K9ac densities of T/A or N/A in the different gene regions, of a group of genes with log2 of T/A or N/A average pol II which is >0.75 in-gene. e, lower, plot of the average densities for the same sample. g, upper, plot of average log2 values of average pol II or H3K9ac densities of T/A or N/A in the different gene regions, of a group of genes with log2 of T/A or N/A average pol II which is less than −0.75 in-gene. g, lower, plot of the average densities for the same sample. i, bar graph showing the percentage of genes that are present in each of the four groups (a–d) listed above. j, mRNA extracted from 12-week-old adult, 2-day neonatal, sham, and 4-day TAC mice hearts and analyzed by qPCR. The fold change in the values for T/A and N/A were calculated and graphed. Error bars represent S.E. *, p < 0.05. k, protein extracted from the same samples as in i and analyzed by Western blotting. Each of the duplicates is an independent sample.
TABLE 1.
Genes that exhibited promoter-proximal pol II pausing in the adult versus neonatal heart (paused genes cutoff: average pol II density of TSS/in-gene >6.2) and those that exhibited a release of pol II pausing during TAC were analyzed for functional categories using DAVID v6.7
Only the top 20 functional categories are listed. The full list is published in supplementary Table 1S.
| Functional annotation of genes paused in the adult heart |
Functional annotation of genes exhibiting reduced pausing during TAC |
||||
|---|---|---|---|---|---|
| Functional pathway | No. of genes | p value | Functional pathway | No. of genes | p value |
| Aminoacyl-tRNA biosynthesis | 36 | 1.9E-18 | Aminoacyl-tRNA biosynthesis | 28 | 9.1E-13 |
| Splicesome | 61 | 1.1E-12 | Splicesome | 51 | 1.3E-11 |
| Nucleotide excision repair | 27 | 8.1E-9 | Ubiquitin-mediated proteolysis | 51 | 6.7E-10 |
| Pyrimidine metabolism | 43 | 1.2E-7 | Lysosome | 41 | 5.8E-7 |
| Ubiquitin-mediated proteolysis | 54 | 2.8E-7 | Nucleotide excision repair | 21 | 1.4E-6 |
| Lysosome | 49 | 3.1E-7 | Ribosome | 32 | 4.7E-6 |
| RNA degradation | 30 | 8.8E-7 | Proteasome | 20 | 3.1E-5 |
| Valine, leucine, and isoleucine degradation | 24 | 5.8E-6 | Endocytosis | 54 | 4.3E-5 |
| RNA polymerase | 17 | 9.5E-6 | RNA degradation | 23 | 4.6E-5 |
| Purine metabolism | 53 | 8.3E-5 | SNARE interactions in vesicular transport | 17 | 7.4E-5 |
| Glycosylphophatidylinositol anchor biosynthesis | 15 | 8.3E-5 | Cell cycle | 34 | 1.6E-3 |
| Endocytosis | 63 | 2.2E-4 | Pyrimidine metabolism | 27 | 2.3E-3 |
| Ribosome | 33 | 3.8E-4 | Huntington disease | 44 | 2.6E-3 |
| Proteasome | 21 | 3.9E-4 | Purine metabolism | 39 | 2.6E-3 |
| SNARE interactions in vesicular transport | 18 | 5.3E-4 | Basal transcription factors | 13 | 2.7E-3 |
| Fatty acid metabolism | 20 | 6.1E-4 | Oocyte meiosis | 30 | 4.3E-3 |
| Oocyte meiosis | 39 | 7.7E-4 | ErbB signaling pathway | 23 | 1.2E-2 |
| Cell cycle | 41 | 1.9E-3 | Fatty acid metabolism | 14 | 1.6E-2 |
| Huntington disease | 54 | 2.6E-3 | RNA polymerase | 10 | 1.7E-2 |
| Glycosaminoglycan degradation | 12 | 2.7E-3 | Homologous recombination | 10 | 1.7E-2 |
The second group of regulated genes also exhibits a reduction in TSS pol II during neonatal or TAC-induced growth versus adult (log2 PrP T/A or N/A <0) associated with an increase in the downstream pol II (log2 DP T/A or N/A >0) and H3K9ac (log2 PrA T/A or N/A >0) (Fig. 2c). Superimposed on these features, the group exhibits an increase in the in-gene pol II >1.6× (log2 IP T/A or N/A >0.75). This characterizes genes that are exhibiting an increase in pol II promoter clearance combined with de novo pol II recruitment (3.3 and 3.5% of the of the TAC and neonatal genes, respectively, Fig. 2i). Functional pathways representing this category include cancer signaling and fatty acid metabolism pathways (Database for Annotation, Visualization, and Integrated Discovery (DAVID), supplemental Tables 1S–4S and Fig. 4S–6S). Shown as examples for this group are the IGB images for T-box protein 20 (Tbx20) and WD repeat 1 (Wrd1) genes (Fig. 2d).
The third category of growth-regulated genes is characterized by a uniform increase in pol II throughout a gene (log2 PrP, IP, and DP T/A or N/A >0.75) accompanied by an increase in H3K9 acetylation (log2 PrA and IA T/A or N/A >0) in the TSS and in-gene (Fig. 2e). This group does not exhibit pol II pausing at the TSS and is, thus, strictly regulated by de novo recruitment of pol II (3.5% and 2.6% of TAC and neonatal genes, respectively, Fig. 2i). Functional pathways representing this category include cardiomyopathy and extracellular matrix proteins (Table 2 and supplemental Tables 5S and 6S and Figs. 7S–9S). Shown as examples for this group are the IGB images for ankyrin repeat domain 1 (Ankrd1), B-type natriuretic peptide (Nppb), and atrial natriuretic peptide (Nppa, Fig. 2f).
TABLE 2.
Genes that exhibited >1.6-fold higher pol II in the TAC and neonatal versus adult heart were analyzed for functional categories using DAVID v6.7
Only those with p < 0.05 are shown. The full list is published in supplemental Table 2S.
| Functional annotation of genes exhibiting de novo pol II recruitment during TAC (>2×) |
Functional annotation of genes exhibiting higher neonatal/adult pol II recruitment (>2×) |
||||
|---|---|---|---|---|---|
| Functional pathway | No. of genes | P value | Functional pathway | No. of genes | p value |
| Hypertrophic cardiomyopathy | 10 | 8.4E-6 | Dilated cardiomyopathy | 15 | 1.2E-13 |
| Dilated cardiomyopathy | 10 | 1.8E-5 | Hypertrophic cardiomyopathy | 13 | 1.8E-11 |
| Systemic lupus erythematosus | 10 | 4.4E-5 | Cardiac muscle contraction | 12 | 1.6E-10 |
| Focal adhesion | 12 | 3.9E-4 | Arrhythmogenic right ventricular cardiomyopathy | 7 | 8.7E-5 |
| Extracellular matrix-receptor interaction | 8 | 4.1E-4 | Calcium signaling pathway | 8 | 2.6E-3 |
| Chemokine signaling pathway | 11 | 7.8E-4 | Tight junction | 6 | 1.1E-2 |
| Arrhythmogenic right ventricular cardiomyopathy | 6 | 7.8E-3 | Vascular smooth muscle contraction | 5 | 3.1E-2 |
| Cardiac muscle contraction | 6 | 9.1E-3 | |||
| Hematopoietic cell lineage | 6 | 1.2E-2 | |||
| Natural killer cell-mediated cytotoxicity | 7 | 1.5E-2 | |||
| Regulation of actin cytoskeleton | 9 | 2.7E-2 | |||
| p53 signaling pathway | 5 | 2.7E-2 | |||
| FcϵRI signaling pathway | 5 | 4.6E-2 | |||
The functional pathways listed in Table 2 include two of the major differences known between postnatal hypertrophic growth and TAC-induced pathological hypertrophy. These include genes involved in extracellular matrix-receptor interaction, and chemokine signaling and systemic lupus erythematosis (an autoimmune disease) pathways that are involved in pathological hypertrophy, which contribute to the contractile dysfunction that eventually ensues in these hearts (8, 19, 20). Some of these genes, including collagen (col1a1, col1a2, and col3a1), cyclooxygenase 2 (PTGS2), and chemokine (C-C motif) ligand 12 (Ccl12), are shown in supplemental Fig. 13S. In addition to these functional categories, other differences include some sarcomeric and cytoskeletal genes, such as skeletal α-actin (Acta1, Fig. 13S) (21) and Xirp2 (22) (cardiomyopathy-associated protein 3, Fig. 2).
The fourth category of growth-regulated genes is characterized by a decrease in pol II throughout a gene (log2 PrP, IP, and DP T/A or N/A <0.75), accompanied by a decrease in H3K9 acetylation (log2 PrA and IA T/A or N/A <0) in the TSS and in-gene (Fig. 2g). This group is, thus, regulated by inhibition of pol II recruitment and includes 2.6 and 15% of TAC and neonatal genes, respectively (Fig. 2i). Functional pathways representing this category include drug and xenobiotics metabolism pathways (DAVID, supplemental Tables 7S and 8S and Figs. 10S–12S). Shown as examples for this group are the IGB images for flavo-containing monooxygenase (FMO) 1 and 2 and Bcl2/adenovirus E1B 19-kDa-interacting protein 3 (Bnip3, Fig. 2h). Quantitative PCR and Western blotting (Fig. 2, j and k) confirm that these four groups of RNA pol II-binding and H3K9ac modification result in either incremental increases (30–50%, group 1), robust increases (1.6–20-fold, groups 2 and 3), or decreases (40–90%, group 4) in gene expression.
We also noted other important regulatory features in the ChIP-Seq data. First, H3K9 acetylation is not restricted to promoters and enhancers as currently perceived and as observed in our data at TSSs that exhibit pol II pausing (Fig. 2b), but is also present in the in-gene region of genes regulated via de novo pol II recruitment (Fig. 2f). Second, although the extent of change in H3K9ac positively correlates with the extent of change in transcriptional activity, the absolute levels of H3K9ac do not correlate with the absolute levels of pol II bound at the promoter. For example, in Fig. 2b, promoter-bound pol II decreases while promoter H3K9ac increases, as the downstream pol II and mRNA increase, indicative of reduced pol II pausing versus reduced transcription. This contrasts with genes in Fig. 2h, where reduced promoter-bound pol II is accompanied by reduced H3K9ac and mRNA, reflecting reduced promoter activity. Third, we also observed that H3K9ac is highest at TSSs with paused pol II relative to promoters that are activated by de novo pol II recruitment (Fig. 2, b versus f). Fourth, the decrease in promoter-paused pol II was widespread and unidirectional during hypertrophic growth, as no genes exhibited an increase in pol II pausing. This suggested that this mode of transcriptional regulation is governed by a general factor and not regulated on a gene-by-gene basis.
Genes Regulated via de Novo Pol II Recruitment Are Less Likely to Be Targeted by miRNA
One of the issues we investigated is whether genes that are robustly regulated via increased de novo pol II recruitment and increased transcription have any additional requirement for regulation via miRNA. To address that we examined the 3′-UTR of the genes that exhibited a >2.5× increase in pol II recruitment during hypertrophy. Fig. 3 shows four of those genes (xirp2, Tnnt2, Tnnc1, and CSRP3) and their 3′-UTRs as depicted by TargetScan (23–25) after screening for conserved miRNA sites. As shown, the 3′-UTRs of these genes ranged from 0.19 to 0.7 kb with no predicted conserved miRNA target sites (Fig. 3). This feature also applies to the genes displayed in Fig. 2f (Ankrd1, Nppa, and Nppb); however, there were a few exceptions (Fig. 3b). This contrasted with most of the validated targets of miRNAs that have been identified in cardiac hypertrophy. PPP2CA (targeted by miR-133), Calm1 (targeted by miR-1), Sox6 (targeted by miR-499), and Dyrk1a (targeted by miR-199a) did not exhibit any de novo pol II recruitment but were regulated by a modest release of paused pol II (10–40%) and had 3′-UTRs that ranged from 3.5 to 6.3 kb (Fig. 4). We calculated the mean, minimum, maximum, and first and third quartiles of the 3′-UTR lengths for both groups of genes, which is displayed in a boxplot in Fig. 3b. In general, the data suggest that genes that are strongly induced at the transcriptional levels are not targeted by miRNA, whereas genes whose expression is only incrementally regulated by pol II pausing and release are also subject to posttranscriptional fine tuning by miRNA. In support, the former group has relatively short 3′-UTRs (mean, 766; first quartile, = 337; third quartile, 1667) compared with the much longer 3′-UTRs of miRNA targets (mean, 1558; first quartile, 1203; third quartile, 3653). The data also emphasize the significance of posttranscriptional regulation via miRNA.
FIGURE 3.

Genes that are regulated by de novo pol II recruitment have shorter 3′-UTR and are less likely to be targeted by miRNA. a, TargetScan-depicted 3′-UTRs of xirp2, Tnnt2, Tnnc1, and CSRP3 screened for highly conserved miRNA targets. The results of the anti-pol II and anti-H3K9ac ChIP-Seq for each of the genes are displayed by IGB where pol II and H3K9ac fragment density (y axis) is aligned in 32-nucleotide bins along the chromosome coordinate (x axis). b, boxplot of the mean, minimum, maximum, and first and third quartiles of the 3′-UTR lengths of validated miRNA targets in hypertrophy and genes that are regulated by de novo pol II recruitment (> 2.5-fold).
FIGURE 4.

miRNA targets have longer 3′-UTRs and are regulated predominantly by incremental release of promoter-paused pol II. TargetScan-depicted 3′-UTRs of PPP2CA, Calm1, Sox6, and Dyrk1a were screened for highly conserved miRNA targets. The results of the anti-pol II and anti-H3K9ac ChIP-Seq for each of the genes are displayed by IGB where pol II and H3K9ac fragment density (y axis) is aligned in 32-nucleotide bins along the chromosome coordinate (x axis).
Anti-Pol II and Anti-H3K9ac ChIP-Seq in the Neonatal, Adult, and TAC Hearts Identify Transcriptional Units of miRNA Genes
We and others have previously identified miRNA in the heart using either microarrays or sequencing approaches (11). Now, our ChIP-Seq analysis allows us to examine the transcriptional status of these miRNAs during cardiac growth. In addition, it allows us to delineate the transcriptional unit of some miRNA genes that remain undefined. The TSS is defined by the first pol II peak that lies 5′ to the annotated pre-miRNA sequence and is encompassed by a hyperacetylated H3K9 region (Fig. 5). The end of the gene is less well defined by an accumulation of pol II, spread over a 5–10-kb region contiguous to its 3′ end, as observed with almost all protein-coding genes. Fig. 5 shows the IGB images of some of the miRNAs that have been reported to be deregulated during cardiac hypertrophy. These include miR-23a, -24-2, 27a cluster, miR-21, and miR-199a-2, -214 cluster, which are up-regulated during cardiac hypertrophy, and miR-29a, -29b-1 and miR-26a, which are down-regulated during cardiac hypertrophy (26). As seen, the change in the transcription of these genes during hypertrophy is commensurate with changes of the mature miRNA levels previously reported (26), proving that they are transcriptionally regulated.
FIGURE 5.

ChIP-Seq reveals the transcriptional regulation of miRNA during cardiac hypertrophy. The results of the anti-pol II and anti-H3K9ac ChIP-Seq for miR-23a, -24-2, 27a cluster, miR-21, and miR-199a-2, -214 cluster, which are up-regulated, and miR-29a, -29b-1, and miR-26a, and miR-1-1 and -1-2, which are down-regulated during cardiac hypertrophy, are displayed by IGB, where pol II and H3K9ac fragment density (y axis) is aligned in 32-nucleotide bins along the chromosome coordinate (x axis). The purple bars on the IGB images demarcate the site of the mature miRNA sequence along the chromosome coordinate, and the longitudinal lines mark the nearest pol II peak upstream of the miRNA, which is embedded in a H3K9ac-rich region. b, mRNA was isolated from neonatal, adult, sham, or TAC heart and subjected to qPCR for pri-miR-1-1, pre-miR-1-1, and mature miR-1 (n = 3). The fold change in the values for neonatal/adult and TAC/sham were calculated and graphed. Error bars represent S.E. *, p < 0.05.
We and others have also reported lower levels of miR-1 in the neonatal versus adult hearts and its down-regulation during hypertrophy in both mouse and human disease models (27–31). We have also shown that the decrease in miR-1 occurs prior to the development of TAC-induced hypertrophy in a mouse model, suggesting that it may be posttranscriptionally regulated (27). Indeed, Rau et al. have recently described the posttranscriptional regulation of miR-1 by MBLN1 and LIN28 (32). Interestingly, we show here for the first time that the transcription levels of miR-1 are higher in the neonatal versus adult hearts and are slightly increased during hypertrophy, which is the inverse of what has been reported of the mature miR-1 levels (27–31), and which we further confirmed by qPCR using the same ChIP-Seq samples (Fig. 5b). This indicates that miR-1 is mainly regulated by a posttranscriptional mechanism during cardiac growth. This is also supportive of the idea that down-regulation of miR-1 is one of the earlier changes during hypertrophy that occurs prior to the triggering of modifications in the transcriptional machinery. Thus, the results uniquely reveal the transcriptional regulation of miRNA and help define their transcriptional units. However, it should be noted that assessment of the transcription of some intragenic miRNA was precluded by the high levels of transcription of the host gene (e.g. miR-208 within the myosin genes).
DISCUSSION
This study is the first to demonstrate the full spectrum of the genes regulated by transcription during cardiac hypertrophy. Most importantly, it reveals distinct modes of transcription that differentially regulate specialized and essential/housekeeping genes. In particular, we show here that promoter-proximal pausing of pol II plays a role in reducing the rate of transcription of ∼25% of expressed genes, which predominantly include essential/housekeeping genes, as postnatal growth of the heart transitions into the quiescent adult phenotype and, thence, its reversal upon induction of pressure overload hypertrophy. It should be noted that in this form of regulation the level of pol II associated with the TSS, in-gene, and downstream regions remains relatively constant, as pol II travels from one end to the other (Fig. 2, a and b). The decrease or increase in promoter pausing of pol II is paralleled by a reciprocal inverse change in the level of H3K9 acetylation, which is a hallmark of active promoters. This is an important independent indicator that proves that a decrease in pol II at the TSS is indeed a result of an equivalent increase in pol II promoter clearance and transcript elongation. This is further corroborated by the equivalent accumulation of pol II beyond the 3′ gene boundary.
RNA pol II ChIP-Seq has its limitations though; while it does measure the density of pol II that is bound to chromatin, it does not assess its activity. So as we observe the increase and decrease of accumulation of poll II at the TSS during cardiac growth and TAC-induced hypertrophy, we have no direct measurement of its transcript elongation activity. Accordingly, there are two plausible explanations for a reduction in promoter-paused pol II peaks. First, it may reflect a decrease in pol II recruitment, or second, it may be a result of enhanced pol II elongational activity and reduced pausing. Because of the incremental nature of the reduction in pausing and relatively long interval between the time points used in our experiments (1-day neonatal versus 12-week adult and 12-week adult versus 4-day TAC), the changes in in-gene pol II density that would result from an increase in elongational activity were not detectable. However, what was evident in all genes that exhibited pol II pausing at the TSS was a reduction in the paused peaks during growth, which was associated with an equivalent increase in pol II accumulation immediately downstream of the gene 3′ boundary. This supported the idea that a decrease in the paused peaks reflects a decrease in pausing versus recruitment of pol II. However, a more direct approach that quantifies transcriptionally active pol II is lacking in this study. We are currently attempting to utilize the global run-on sequencing (Gro-Seq) assay that has been developed by Core et al. (33), to quantify pol II activity and have a more complete assessment of the transcriptional changes that underlie cardiac growth.
In general, active promoters are associated with hyperacetylation of H3, as well as, hypermethylation of H3K4 (34). In particular, genome-wide analysis shows that H3K4me2 and me3, H3K9ac, and H3K79me2, increase in parallel with pol II that is recruited to genes, which are induced during differentiation of erythroid progenitors (16). Likewise, Ernst et al. compared histone modifications in nine human cells lines, which showed higher H3K27ac and H3K9ac content in active versus inactive/paused promoter (17). It should be noted, though, that these activation markers are not exclusively associated with active promoters. For example, wherein in human lung fibroblast 99% of active promoters are associated with H3 acetylation and 97% with H3K4 methylation, 95% of pol II-paused promoters and 20–30% of inactive promoters were also associated with these modifications (35). Similarly, in stem cells it was reported that H3K4me3 and H3K9,14ac, along with pol II, are present in most actively transcribed or paused protein-coding genes (36). The results provide evidence that these modifications are a prerequisite for promoter activation; however, they are neither restricted to active promoters nor sufficient for pol II recruitment. On the other hand, an increase or decrease in the extent of these modifications positively correlates with a change in promoter activity. Our data are in agreement with these observations, as we find that H3K9ac demarcates promoters with or without bound pol II (Fig. 1a and supplemental Figs. 1S and 9S). Conversely, the extent of change in the level of this modification positively correlates with the change in pol II recruitment or the reduction in pausing (Fig. 2). Noteworthy, one of the unique observations in our ChIP-Seq data is that in some genes H3K9ac modification extended several kilobases beyond the promoter region, in particular, within genes that exhibited de novo pol II recruitment during TAC (Figs. 2f and 5a). This suggests that there are more facets to H3K9ac functionality than we currently know.
The recent report by Gilchrist et al. suggested that pausing may function in fine tuning basal gene expression (18). This is indeed what we observed, as widespread pol II pausing in the adult heart is incrementally (10–60%) released during cardiac hypertrophy. This mode of transcriptional regulation encompasses the largest change in gene transcription during normal and pathological hypertrophy alike and included most of the genes that are critical for the basic normal functionality of the cell. Some of these include the genes involved in ubiquitination, DNA excision repair, RNA degradation, splicing, tRNA biosynthesis, and more (Table 1). Important characteristics of this mode of regulation are that (i) it is synchronous, (ii) unidirectional, (iii) incremental, (iv) does not require de novo pol II recruitment, and (v) is accompanied by an incremental increase in H3K9ac. For the first time these data explain how the essential/housekeeping genes are regulated during hypertrophic growth in an incremental fashion that parallels the increase in cell size. Because it recapitulates the neonatal pattern, we conclude that this aspect of cardiac growth is physiological in nature and allows the heart to compensate for the increase in workload.
In contrast to our data, in Toll10b Drosophila embryos (2–4 h after fertilization), pol II promoter pausing was detected in 12% of all genes, enriched for those known to function in development, whereas genes that are constitutively expressed exhibited uniform binding of pol II (37). Similarly, in Drosophila S2 cells, RNA pol II pausing was widespread and involved genes that function in development, differentiation, and cell communication (13). In agreement with our data, in situ hybridization of the Drosophila embryo revealed two patterns of gene expression, stochastic and synchronous, the latter of which seemed to involve the release of promoter-proximal paused pol II at the dorso-ventral patterning genes (15). Pausing has also been observed in ∼4.5% of genes in a human fetal lung fibroblast cell line (35). Our results are the first to show how widespread pausing at essential/housekeeping genes is dynamically regulated during physiological and pathological growth of an organ.
Phosphorylation of the pol II C-terminal domain by Cdk9 enhances promoter-proximal clearance of paused pol II (38). Cdk9 function, however, is not required by all genes; but the scope or nature of those that do require it remain undefined. Cdk9 has been known to play critical roles in both cardiac hypertrophy and cancer and is, thus, being tested as a therapeutic target. During cardiac hypertrophy, Cdk9 activity and pol II phosphorylation increase, whereas inhibition of Cdk9 suppresses endothelin-1-induced myocyte hypertrophy (39). Conversely, overexpression of the cyclin partner, of Cdk9, cyclin T1, in the heart was sufficient for inducing cardiac hypertrophy (39). This suggests that Cdk9 is either involved in the regulation of a major trigger(s) of hypertrophy or that itself increases global cellular gene expression, which underlies the increase in cardiac mass. However, until presently, we had no knowledge of which genes in the heart are regulated by pol II pausing/stalling, or when, or their requirement for Cdk9 activity. Our ChIP-Seq results uncovered, for the first time, that pausing increases in the adult mouse heart relative to the neonatal and occurs mainly at essential/housekeeping genes (Table 1), which constitute ∼40% of the expressed genes. These data, combined with our previous report showing that the main regulator of pol II elongational activity, Cdk9, is sufficient for inducing cardiac hypertrophy, supports the conclusion that the release of promoter-paused pol II is a cause rather than an effect of hypertrophy.
In contrast to the modest increases in transcriptional elongation that is tightly regulated through pol II pausing, the ChIP-Seq data show that more robust changes in transcription occur through an increase in de novo pol II recruitment (Fig. 2, group 3). This mode of transcriptional regulation is associated with a much smaller fraction of expressed genes (∼5%) that is functionally distinct from the former set (Table 2). Interesting, this group appears to have evolved to avoid miRNA targeting via shortening of the 3′-UTR (40). For the first time these findings highlight the distinction between transcriptional versus posttranscriptional regulation, their influence on the extent of modulating expression of a gene, and the nature of the genes that are regulated by either mechanism during cardiac hypertrophy.
Acknowledgments
We thank Dr. Junichi Sadoshima, Chairman of the Department of Cell Biology and Molecular Medicine, University of Medicine and Dentristy of New Jersey, for his support.
This work was supported, in whole or in part, by National Institutes of Health Grants HL057970 and HL104115 (to M. A.). This work was also supported by American Heart Association Scientist Development Grant 12SDG8820011 (to D. S.).

This article contains supplemental Figs. 1S–13S, Tables 1S–8S, and additional references.
- miRNA
- micro RNA
- ChIP
- chromatin immunoprecipitation
- H3K9ac
- H3 histone lysine 9 acetylated
- IGB
- Integrated Genome Browser
- pol II
- RNA polymerase II
- qPCR
- quantitative PCR
- Seq
- sequencing
- TAC
- transverse aortic constriction
- TSS
- transcription start site.
REFERENCES
- 1. Cutilletta A. F., Rudnik M., Zak R. (1978) Muscle and non-muscle cell RNA polymerase activity during the development of myocardial hypertrophy. J. Mol. Cell. Cardiol. 10, 677–687 [DOI] [PubMed] [Google Scholar]
- 2. Kamala J., Mariappan M., Rajamanickam C. (1986) Changes associated with rat heart chromatin during cardiac hypertrophy. Biochem. Int. 13, 271–286 [PubMed] [Google Scholar]
- 3. Abdellatif M., Packer S. E., Michael L. H., Zhang D., Charng M. J., Schneider M. D. (1998) A Ras-dependent pathway regulates RNA polymerase II phosphorylation in cardiac myocytes: implications for cardiac hypertrophy. Mol. Cell. Biol. 18, 6729–6736 [DOI] [PMC free article] [PubMed] [Google Scholar]
- 4. Simpson P. C., Long C. S., Waspe L. E., Henrich C. J., Ordahl C. P. (1989) Transcription of early developmental isogenes in cardiac myocyte hypertrophy. J. Mol. Cell Cardiol 21, 79–89 [DOI] [PubMed] [Google Scholar]
- 5. Feldman A. M., Weinberg E. O., Ray P. E., Lorell B. H. (1993) Selective changes in cardiac gene expression during compensated hypertrophy and the transition to cardiac decompensation in rats with chronic aortic banding. Circ. Res. 73, 184–192 [DOI] [PubMed] [Google Scholar]
- 6. Schneider M. D., McLellan W. R., Black F. M., Parker T. G. (1992) Growth factors, growth factor response elements, and the cardiac phenotype. Basic Res. Cardiol 87, 33–48 [DOI] [PubMed] [Google Scholar]
- 7. Paradis P., MacLellan W. R., Belaguli N. S., Schwartz R. J., Schneider M. D. (1996) Serum response factor mediates AP-1-dependent induction of the skeletal α-actin promoter in ventricular myocytes. J. Biol. Chem. 271, 10827–10833 [DOI] [PubMed] [Google Scholar]
- 8. Kong S. W., Bodyak N., Yue P., Liu Z., Brown J., Izumo S., Kang P. M. (2005) Genetic expression profiles during physiological and pathological cardiac hypertrophy and heart failure in rats. Physiol. Genomics 21, 34–42 [DOI] [PubMed] [Google Scholar]
- 9. Strøm C. C., Aplin M., Ploug T., Christoffersen T. E., Langfort J., Viese M., Galbo H., Haunsø S., Sheikh S. P. (2005) Expression profiling reveals differences in metabolic gene expression between exercise-induced cardiac effects and maladaptive cardiac hypertrophy. FEBS J. 272, 2684–2695 [DOI] [PubMed] [Google Scholar]
- 10. Rajan S., Williams S. S., Jagatheesan G., Ahmed R. P., Fuller-Bicer G., Schwartz A., Aronow B. J., Wieczorek D. F. (2006) Microarray analysis of gene expression during early stages of mild and severe cardiac hypertrophy. Physiol. Genomics 27, 309–317 [DOI] [PubMed] [Google Scholar]
- 11. Sayed D., Abdellatif M. (2011) MicroRNAs in development and disease. Physiol. Rev. 91, 827–887 [DOI] [PubMed] [Google Scholar]
- 12. Nechaev S., Adelman K. (2008) Promoter-proximal pol II: when stalling speeds things up. Cell Cycle 7, 1539–1544 [DOI] [PubMed] [Google Scholar]
- 13. Muse G. W., Gilchrist D. A., Nechaev S., Shah R., Parker J. S., Grissom S. F., Zeitlinger J., Adelman K. (2007) RNA polymerase is poised for activation across the genome. Nat. Genet. 39, 1507–1511 [DOI] [PMC free article] [PubMed] [Google Scholar]
- 14. Core L. J., Lis J. T. (2008) Transcription regulation through promoter-proximal pausing of RNA polymerase II. Science 319, 1791–1792 [DOI] [PMC free article] [PubMed] [Google Scholar]
- 15. Boettiger A. N., Levine M. (2009) Synchronous and stochastic patterns of gene activation in the Drosophila embryo. Science 325, 471–473 [DOI] [PMC free article] [PubMed] [Google Scholar]
- 16. Wong P., Hattangadi S. M., Cheng A. W., Frampton G. M., Young R. A., Lodish H. F. (2011) Gene induction and repression during terminal erythropoiesis are mediated by distinct epigenetic changes. Blood 118, e128–138 [DOI] [PMC free article] [PubMed] [Google Scholar]
- 17. Ernst J., Kheradpour P., Mikkelsen T. S., Shoresh N., Ward L. D., Epstein C. B., Zhang X., Wang L., Issner R., Coyne M., Ku M., Durham T., Kellis M., Bernstein B. E. (2011) Mapping and analysis of chromatin state dynamics in nine human cell types. Nature 473, 43–49 [DOI] [PMC free article] [PubMed] [Google Scholar]
- 18. Gilchrist D. A., Dos Santos G., Fargo D. C., Xie B., Gao Y., Li L., Adelman K. (2010) Pausing of RNA polymerase II disrupts DNA-specified nucleosome organization to enable precise gene regulation. Cell 143, 540–551 [DOI] [PMC free article] [PubMed] [Google Scholar]
- 19. Carey R. A., Natarjan G., Bove A. A., Santamore W. P., Spann J. F. (1980) Elevated collagen content in volume overload induced cardiac hypertrophy. J. Mol. Cell. Cardiol. 12, 929–936 [DOI] [PubMed] [Google Scholar]
- 20. Kania G., Blyszczuk P., Eriksson U. (2009) Mechanisms of cardiac fibrosis in inflammatory heart disease. Trends Cardiovasc. Med. 19, 247–252 [DOI] [PubMed] [Google Scholar]
- 21. Schwartz K., de la Bastie D., Bouveret P., Oliviéro P., Alonso S., Buckingham M. (1986) α-Skeletal muscle actin mRNAs accumulate in hypertrophied adult rat hearts. Circ. Res. 59, 551–555 [DOI] [PubMed] [Google Scholar]
- 22. McCalmon S. A., Desjardins D. M., Ahmad S., Davidoff K. S., Snyder C. M., Sato K., Ohashi K., Kielbasa O. M., Mathew M., Ewen E. P., Walsh K., Gavras H., Naya F. J. (2010) Modulation of angiotensin II-mediated cardiac remodeling by the MEF2A target gene Xirp2. Circ. Res. 106, 952–960 [DOI] [PMC free article] [PubMed] [Google Scholar]
- 23. Lewis B. P., Burge C. B., Bartel D. P. (2005) Conserved seed pairing, often flanked by adenosines, indicates that thousands of human genes are microRNA targets. Cell 120, 15–20 [DOI] [PubMed] [Google Scholar]
- 24. Grimson A., Farh K. K., Johnston W. K., Garrett-Engele P., Lim L. P., Bartel D. P. (2007) MicroRNA targeting specificity in mammals: determinants beyond seed pairing. Mol. Cell 27, 91–105 [DOI] [PMC free article] [PubMed] [Google Scholar]
- 25. Friedman R. C., Farh K. K., Burge C. B., Bartel D. P. (2009) Most mammalian mRNAs are conserved targets of microRNAs. Genome Res. 19, 92–105 [DOI] [PMC free article] [PubMed] [Google Scholar]
- 26. Abdellatif M. (2012) Differential expression of microRNAs in different disease states. Circ. Res. 110, 638–650 [DOI] [PMC free article] [PubMed] [Google Scholar]
- 27. Sayed D., Hong C., Chen I. Y., Lypowy J., Abdellatif M. (2007) MicroRNAs play an essential role in the development of cardiac hypertrophy. Circ. Res. 100, 416–424 [DOI] [PubMed] [Google Scholar]
- 28. Ikeda S., He A., Kong S. W., Lu J., Bejar R., Bodyak N., Lee K. H., Ma Q., Kang P. M., Golub T. R., Pu W. T. (2009) MicroRNA-1 negatively regulates expression of the hypertrophy-associated calmodulin and Mef2a genes. Mol. Cell. Biol. 29, 2193–2204 [DOI] [PMC free article] [PubMed] [Google Scholar]
- 29. Carè A., Catalucci D., Felicetti F., Bonci D., Addario A., Gallo P., Bang M. L., Segnalini P., Gu Y., Dalton N. D., Elia L., Latronico M. V., Høydal M., Autore C., Russo M. A., Dorn G. W., 2nd, Ellingsen O., Ruiz-Lozano P., Peterson K. L., Croce C. M., Peschle C., Condorelli G. (2007) MicroRNA-133 controls cardiac hypertrophy. Nat. Med. 13, 613–618 [DOI] [PubMed] [Google Scholar]
- 30. Elia L., Contu R., Quintavalle M., Varrone F., Chimenti C., Russo M. A., Cimino V., De Marinis L., Frustaci A., Catalucci D., Condorelli G. (2009) Reciprocal regulation of microRNA-1 and insulin-like growth factor-1 signal transduction cascade in cardiac and skeletal muscle in physiological and pathological conditions. Circulation 120, 2377–2385 [DOI] [PMC free article] [PubMed] [Google Scholar]
- 31. Ikeda S., Kong S. W., Lu J., Bisping E., Zhang H., Allen P. D., Golub T. R., Pieske B., Pu W. T. (2007) Altered microRNA expression in human heart disease. Physiol. Genomics 31, 367–373 [DOI] [PubMed] [Google Scholar]
- 32. Rau F., Freyermuth F., Fugier C., Villemin J. P., Fischer M. C., Jost B., Dembele D., Gourdon G., Nicole A., Duboc D., Wahbi K., Day J. W., Fujimura H., Takahashi M. P., Auboeuf D., Dreumont N., Furling D., Charlet-Berguerand N. (2011) Misregulation of miR-1 processing is associated with heart defects in myotonic dystrophy. Nat. Struct. Mol. Biol. 18, 840–845 [DOI] [PubMed] [Google Scholar]
- 33. Core L. J., Waterfall J. J., Lis J. T. (2008) Nascent RNA sequencing reveals widespread pausing and divergent initiation at human promoters. Science 322, 1845–1848 [DOI] [PMC free article] [PubMed] [Google Scholar]
- 34. Schübeler D., MacAlpine D. M., Scalzo D., Wirbelauer C., Kooperberg C., van Leeuwen F., Gottschling D. E., O'Neill L. P., Turner B. M., Delrow J., Bell S. P., Groudine M. (2004) The histone modification pattern of active genes revealed through genome-wide chromatin analysis of a higher eukaryote. Genes Dev. 18, 1263–1271 [DOI] [PMC free article] [PubMed] [Google Scholar]
- 35. Kim T. H., Barrera L. O., Zheng M., Qu C., Singer M. A., Richmond T. A., Wu Y., Green R. D., Ren B. (2005) A high-resolution map of active promoters in the human genome. Nature 436, 876–880 [DOI] [PMC free article] [PubMed] [Google Scholar]
- 36. Guenther M. G., Levine S. S., Boyer L. A., Jaenisch R., Young R. A. (2007) A chromatin landmark and transcription initiation at most promoters in human cells. Cell 130, 77–88 [DOI] [PMC free article] [PubMed] [Google Scholar]
- 37. Zeitlinger J., Stark A., Kellis M., Hong J. W., Nechaev S., Adelman K., Levine M., Young R. A. (2007) RNA polymerase stalling at developmental control genes in the Drosophila melanogaster embryo. Nat. Genet. 39, 1512–1516 [DOI] [PMC free article] [PubMed] [Google Scholar]
- 38. Lis J. T., Mason P., Peng J., Price D. H., Werner J. (2000) P-TEFb kinase recruitment and function at heat shock loci. Genes Dev. 14, 792–803 [PMC free article] [PubMed] [Google Scholar]
- 39. Sano M., Schneider M. D. (2004) Cyclin-dependent kinase-9: an RNAPII kinase at the nexus of cardiac growth and death cascades. Circ. Res. 95, 867–876 [DOI] [PubMed] [Google Scholar]
- 40. Bartel D. P. (2009) MicroRNAs: target recognition and regulatory functions. Cell 136, 215–233 [DOI] [PMC free article] [PubMed] [Google Scholar]