Background: NPAS4 is involved in memory formation, but its roles in neuronal function remain to be fully elucidated.
Results: NPAS4 increased CDK5-dependent phosphorylation of synapsin I that was associated with neurite elongation.
Conclusion: NPAS4 induced CDK5-dependent phosphorylation of synapsin I to facilitate neurite outgrowth.
Significance: NPAS4 plays an important role in the structural and functional plasticity of neurons.
Keywords: CDK (Cyclin-dependent Kinase), Neurite Outgrowth, Neurodevelopment, Protein Phosphorylation, Transcription Factors, NPAS4, Phosphorylated Synapsin I
Abstract
Neuronal Per Arnt Sim domain protein 4 (NPAS4), a brain-specific basic helix-loop-helix transcription factor, has recently been shown to regulate the development of the GABAergic inhibitory synapses and transcription program for contextual memory formation in the hippocampus. We previously reported that chronic social isolation or restriction stress in mice resulted in an impairment in memory and emotional behavior, which was associated with a decrease in Npas4 mRNA levels. In this study, we investigated the role of NPAS4 in neuronal function in vitro and in vivo. Differentiation medium-induced neurite outgrowth was inhibited in Npas4 knockdown Neuro2a cells, whereas overexpression of NPAS4 accelerated the neurite outgrowth in Neuro2a cells. Furthermore, depolarization-induced neurite outgrowth was abolished in Npas4 KO hippocampal neurons. NPAS4 overexpression increased cyclin-dependent kinase 5 (CDK5)-dependent synapsin I phosphorylation in Neuro2a cells and primary cultured hippocampal neurons. A CDK5 inhibitor, roscovitine, inhibited the neurite outgrowth and the increase in phosphorylated synapsin I (p-SYN I) levels in Npas4-overexpressed Neuro2a cells. Interaction of NPAS4 with promoters of Cdk5 and NeuN genes was demonstrated by a chromatin immunoprecipitation assay. In an in vivo study, pentylenetetrazole-induced convulsions in mice resulted in an increase in NPAS4 and p-SYN I levels in the prefrontal cortex of wild-type mice, although no changes in p-SYN I levels were observed in Npas4 knock-out mice. These results suggest that NPAS4 plays an important role in the structural and functional plasticity of neurons.
Introduction
The basic helix-loop-helix family has been studied for its important roles in various physiological and pathophysiological processes, including as transcription factors, in the regulation of neuronal differentiation and even in psychiatric disorders (1–6). Neuronal Per Arnt Sim domain protein (NPAS) is a member of the basic helix-loop-helix family, which is categorized as Npas1, Npas2, Npas3, and Npas4 (7–9). Npas3 has been identified as a candidate gene associated with schizophrenia, learning disabilities, and bipolar disorder (5, 10), and it is known to play a role in hippocampal neurogenesis (1, 11). NPAS4 is a neuron-specific transcription factor (12), and the Npas4 expression level in the hippocampus is regulated by cerebral ischemic insults, the AMPA receptor agonist and kainic acid (13–15). Lin et al. (13) have reported that NPAS4 regulates the development of GABAergic inhibitory synapses in an activity-dependent manner and suggested its homeostatic role in the balance between excitatory and inhibitory neuronal activities in the brain. We previously reported that reduced Npas4 mRNA levels may contribute to impairments in adult neurogenesis in the hippocampus, memory and emotional behaviors induced by social isolation or restriction stress (16, 17). Recent studies (18, 19) revealed that NPAS4 is important in memory formation and consolidation. Synaptic remodeling is considered to be a way for neurons to adapt cellular and neuronal circuits to environmental changes (20), and neurite arborization and rewiring may contribute to the neuronal plasticity in the brain (21–24). In this study, to investigate a possible role for NPAS4 in structural and functional plasticity of neurons, we examined the effect of knockdown or overexpression of NPAS4 on neurite outgrowth in Neuro2a cells. Neurite outgrowth in Npas4 knock-out primary cultured hippocampal neurons was also investigated. Then, we investigated the underlying mechanism by which NPAS4 regulates neurite outgrowth. We focused on the phosphorylation of a synaptic vesicle-associated protein, Syn I,3 via cyclin-dependent kinase 5 (CDK5). Finally, we conducted an in vivo study to see if the NPAS4-induced CDK5/SYN I pathway could be operated under physiological and pathophysiological conditions using a pentylenetetrazole (PTZ)-induced epilepsy model in mice.
EXPERIMENTAL PROCEDURES
Cell Culture
Neuro2a cells were kindly donated by Dr. Sigeru Yoshida (Taisho Pharmaceutical Co., Ltd., Saitama, Japan) and cultured in Dulbecco's modified Eagle's medium (DMEM, Sigma) supplemented with 10% fetal bovine serum (FBS, Invitrogen) and antibiotics/antimycotics (Invitrogen) at 37 °C in a humidified atmosphere with 5% CO2. For neurite development, the medium was replaced with differentiation medium (DM), DMEM containing lithium chloride (LiCl, 20 mm, Wako Chemicals, Osaka, Japan), and myo-inositol (10 mm, Wako Chemicals) with 2% FBS, and the cells were cultured for 12–48 h. The number of Neuro2a cells seeded was 1–5 × 10⁴ cells/ml, 2 ml per well (6-well dishes), according to the experimental design.
Quantitative Real Time RT-PCR
Complementary DNA was synthesized from total isolated RNA using a SuperScriptIII first-strand synthesis system for RT-PCR (Invitrogen). Levels of mRNA expression were quantified by using a 7300 real time PCR System (Applied Biosystems, Foster City, CA). The quantitative real time RT-PCR was performed in a volume of 25 μl with 1 μg of cDNA and 500 nm primers in a Power SYBR Green Master Mix (Applied Biosystems). The primers used were as follows: 5′-AGCATTCCAGGCTCATCTGAA-3′ (forward) and 5′-GGCGAAGTAAGTCTTGGTAGGATT-3′ (reverse) for Npas4; 5′-TGTCAAGCTCATTTCCTGGTATGA-3′ (forward) and 5′-CTTACTCCTTGGAGGCCATGTAG-3′ (reverse) for glyceraldehyde-3-phosphate dehydrogenase for GAPDH; and 5′-CGATGCCCTGAGGCTCTTT-3′ (forward) and 5′-TGGATGCCACAGGATTCCA-3′ (reverse) for β-Actin used as internal controls.
Immunocytochemistry
The cells were rinsed twice in phosphate-buffered saline (PBS) at room temperature. Fixation was performed with 4% (v/v) paraformaldehyde in PBS for 20 min at room temperature, and permeabilization was carried out with 0.2% Triton X-100 in PBS for 15 min at room temperature. The cells were incubated in 5% goat serum (Vector Laboratories Inc., Burlingame, CA) in PBS or Tris-buffered saline (TBS) for 1 h at room temperature. Polyclonal antibodies, NPAS4 antibodies 1 and 2, were raised against a peptide sequence of FHYTEKEQNEIDRL at the C terminus (for Neuro2a cells, rabbit, 1:300, Japan Bio Services Co., Ltd., Saitama, Japan) and a recombinant protein sequence (597–802, for hippocampal neurons, rabbit, 1:5,000, MBL, Nagano, Japan) of the NPAS4 protein, respectively. The cells were incubated with anti-Npas4, anti-Myc (mouse, 1:2,000), anti-Cdk5 (rabbit, 1:300, Santa Cruz Biotechnology), anti-Tau (mouse, 1:500, Santa Cruz Biotechnology), anti-GFP (rabbit, 1:2,000, MBL), anti-MAP2 (mouse, 1:500, Abcam, Cambridge, MA), anti-Tuj1 (mouse or rabbit, 1:500, Sigma), or anti-p-Syn I (goat, 1:300) antibodies at 4 °C overnight. The cells were rinsed in PBS three times for 10 min and incubated with anti-rabbit Alexa 594 (goat, 1:1,000, Invitrogen), anti-rabbit Alexa 488 (donkey, 1:1,000), anti-mouse Alexa 488 (goat, 1:1,000), anti-goat Alexa 546 (donkey, 1:1,000), anti-mouse Alexa 594 (donkey, 1:1,000), anti-mouse Alexa 405 (goat, 1:1,000), or anti-rabbit Alexa 405 (goat, 1:1,000) antibodies at room temperature for 2 h. Rinsed cells were mounted with coverslips and visualized under a microscope (Axio Imager, Zeiss). p-SYN I or CDK5 fluorescence intensity was measured with the “histogram” feature of ImageJ after selecting puncta with “freehand selections” (National Institutes of Health, rsbweb.nih.gov).
Npas4 siRNA Transfection and Neurite Length Measurement
The sequence of Npas4 siRNA is 5′-GGTTGACCCTGATAATTTA-3′, and the scrambled siRNA sequence is 5′-GGTTCAGCGTCATAATTTA-3′ according to Lin et al. (13). Neuro2a cells (1 × 10⁴ cells/ml) were cotransfected with Npas4 siRNA (50 nm) or scrambled siRNA (50 nm) and pZsGreen1-N1 (100 ng, Clontech) vectors using Lipofectamine RNAiMAX (7.5 μl, Invitrogen). Seventy two hours later, the medium was replaced with DM, and the cells were cultured for 24 h. Six to seven areas were photographed randomly from three independent experiments each, and TUJ1-positive neurite length (25) was measured using a microscope and a visual image analysis system (Axio Imager, Zeiss, Jena, Germany).
NPAS4 Overexpression and Neurite Length Measurement
On the basis of the GenBankTM sequence, Mus musculus Npas4 mRNA (BC129861) was chosen to construct the overexpression vector. Briefly, PCR was carried out using mouse cDNA with primers, which introduced a NotI site with deletion of the stop codon at the 3′ end. The PCR product was subcloned into the pCR®-XL-TOPO (Invitrogen) and sequenced. The cloned vector was digested using PstI and NotI endonuclease (Takara, Otsu, Shiga, Japan), and the fragment was inserted at the PstI and NotI site of pCMV/myc/nuc vector (Invitrogen). Neuro2a cells (2 × 10⁴ cells/ml) were transfected with the Npas4/pCMV/myc/nuc vector (1 μg, Npas4 vector) or pCMV/myc/nuc vector (mock vector) using FuGENE 6 (6 μl, Roche Diagnostics). Seventy two hours later, the medium was replaced with DM, and the cells were cultured for 12 h. Neurite length was measured as described above.
Immunoblot Analysis of NPAS4-overexpressed Neuro2a Cells
The NPAS4 overexpression vector was transfected to the Neuro2a cells (5 × 10⁴ cells/ml) as mentioned above. Seventy two hours later, whole cell lysates were collected by general methods. For Tuj1 analysis, the medium was replaced with DM, and the cells were cultured for 12 h. The homogenates were subjected to SDS-PAGE (7.5%), and immunoblotting was performed. After blocking, membranes were incubated with anti-p-SYN I (goat, 1:300, Santa Cruz Biotechnology), anti-SYN I (goat, 1:300, Santa Cruz Biotechnology), anti-β-actin (goat, 1:300, Santa Cruz Biotechnology), anti-Npas4 (antibody 2, 1:1,000), anti-Tuj1 (mouse, 1:5,000, Sigma), anti-Myc (mouse, 1:1,000, Cell Signaling Technology, Beverly, MA), or anti-neuronal nuclei (NeuN) (mouse, 1:1,000, Chemicon International, Temecula, CA) antibodies at 4 °C overnight. Horseradish peroxidase-conjugated anti-rabbit (1:1,500, Kirkegaard & Perry Laboratories), anti-mouse (1:2,000, Kirkegaard & Perry Laboratories), or anti-goat antibodies (1:1,000, R&D Systems, Minneapolis, MN) were treated for 1 h at room temperature, and the immunoreactivity was visualized with an ECL Plus detection system (GE Healthcare).
CDK5 Immunoblot and Activity Assay
After transfection of Npas4 or mock expression vector in Neuro2a cells, the transfected cells were enriched by G418 (1.2 μg/ml, Calbiochem, Merck KGaA) selection. The whole cell lysates were collected, and an immunoblot assay was performed with anti-Cdk5 (rabbit, 1:1,000, Santa Cruz Biotechnology) antibody. CDK5 activity assay was performed with ADP-GloTM kinase assay kit according to manufacturer's instructions (Promega, Madison, WI).
Primary Hippocampal Neuron Culture and the Measurement of p-SYN I and Neurite Outgrowth
Hippocampal neurons were dissociated and prepared from E16 to E17 mouse embryos as described previously (26). To measure p-SYN I levels, ICR mice were killed on gestational day 16 or 17, and embryo hippocampi were digested with 0.25% trypsin and 0.01% DNase for 10 min at 37 °C and mechanically dissociated by gentle pipetting. Neurons were plated at 5 × 10⁴ cells on poly-l-lysine-coated coverslips (12 mm, BD BioCoat, Bedford, MA) and cultured in DMEM (D6546, 10% fetal bovine serum, 2 mm l-glutamine, antibiotics/antimycotics) on day in vitro (DIV) 0. DMEM was replaced with glial conditioned medium (nerve cell and microglial cell culture system, SUMITOMO BAKELITE, Tokyo, Japan) with Ara-C (5 μm, Sigma) and antibiotics/antimycotics. The Npas4 overexpression vector was transfected on DIV 4. Briefly, the medium was removed and kept at 37 °C in a humidified atmosphere with 5% CO2. Npas4/pCMV/myc/nuc vector (1 μg) was transfected with Opti-MEM I (100 μl, Invitrogen) and Lipofectamine 2000 (5 μl, Invitrogen) in a new medium (500 μl, without antibiotics/antimycotics), and the transfection medium was replaced with old medium 4 h later. Immunocytochemistry was performed on DIV 5, and the p-SYN I fluorescence intensity was measured as described above. To measure neurite outgrowth, hippocampal neurons were dissociated and prepared from E16 to E17 mouse embryos of Npas4 knock-out (KO) or wild-type (WT) littermates as described above. Npas4 KO mice were kindly donated by Dr. Greenberg (13). The longest Tau-positive axonal length was measured at DIV 3. MAP2-positive dendrites length was measured at DIV 9, after treatment of KCl (16 mm) for 48 h (DIV 7–9) according to Wayman et al. (27). The measurement of neurite length and Sholl analysis were performed using a microscope and a visual image analysis system (Neurolucida, MBF Bioscience, Williston, VT).
Chromatin Immunoprecipitation Assay (ChIP Assay)
Neuro2a cells (3.9 × 10⁷ cells, 10 cm dish) were seeded, and 96 h later the medium was replaced with DM, and the cells were cultured for 48 h. Primary cultured cortical neurons (4.0 × 10⁷ cells, 10-cm dish) on DIV 4 were treated with tetrodotoxin and AP5 (an N-methyl-d-aspartate receptor antagonist) followed by KCl according to the protocol of Lin et al. (13). A ChIP assay was performed with a Simple Chip Enzymatic Chromatin IP kit (Cell Signaling Technology) following the manufacturer's manual. The following primers were used for quantitative PCR in the chromatin immunoprecipitation assay: 5′-CAGGATGACTCACACTGACAGTATTTTTAG-3′ (forward) and 5′-GTGGGAGAAGAGCTATTTATATCACCAG-3′ (reverse) for Npas4 (13); 5′-GCTAGCTCTAGATTTCGTGT-3′ (forward) and 5′-GGAAAGTTGAGTTGGGAGA-3′ (reverse) Cdk5; 5′-CCGTGGTATGTGCCTCA-3′ (forward) and 5′-CTGATACACGTTGCTGGA-3′ (reverse) for NeuN; and 5′-GTTGGCCAGACAGAAGACAAGAGA-3′ (forward) and 5′-TATACACAGCCCTCCAAAGGCAGA-3′ (reverse) for p35.
Pentylenetetrazole-induced Convulsion Model of Epilepsy
Npas4 KO mice or WT littermates at 6–8 weeks old were housed 4–5 per cage under standard conditions (23 ± 1 °C, 50 ± 5% humidity), with a 12-h light/dark cycle. Food and water were available ad libitum. The animals were handled in accordance with the guidelines established by the Institutional Animal Care and Use Committee of Nagoya University. Npas4 KO and WT mice were administered intraperitoneally with PTZ (Sigma) at a dose of 60 mg/kg, and the intensity of convulsions induced by PTZ was scored according to previous studies (28, 29). After seizure testing, mice were sacrificed. The prefrontal cortex was isolated, and an immunoblot assay was performed as described above (including p35 detection with p35 antibodies, rabbit, 1:1,000, Santa Cruz Biotechnology).
Statistical Analysis
Differences between the two groups were analyzed by Student's t test. One-way analysis of variance (ANOVA) followed by Dunnett's test or two- and three-way ANOVA followed by Bonferroni's test was used for multigroup comparisons. To compare neurite length, differences between two groups were analyzed by the Kolmogorov-Smirnov test, and differences among more than two groups were analyzed by one-way ANOVA followed by Dunnett's test and confirmed by the Kolmogorov-Smirnov test. The relationship between CDK5 and p-SYN I expression was analyzed by linear regression. The comparison of regression lines was performed by parallel line analysis.
RESULTS
Effect of Differentiation Medium on Neurite Outgrowth, NPAS4, and p-SYN I Expression in Neuro2a Cells
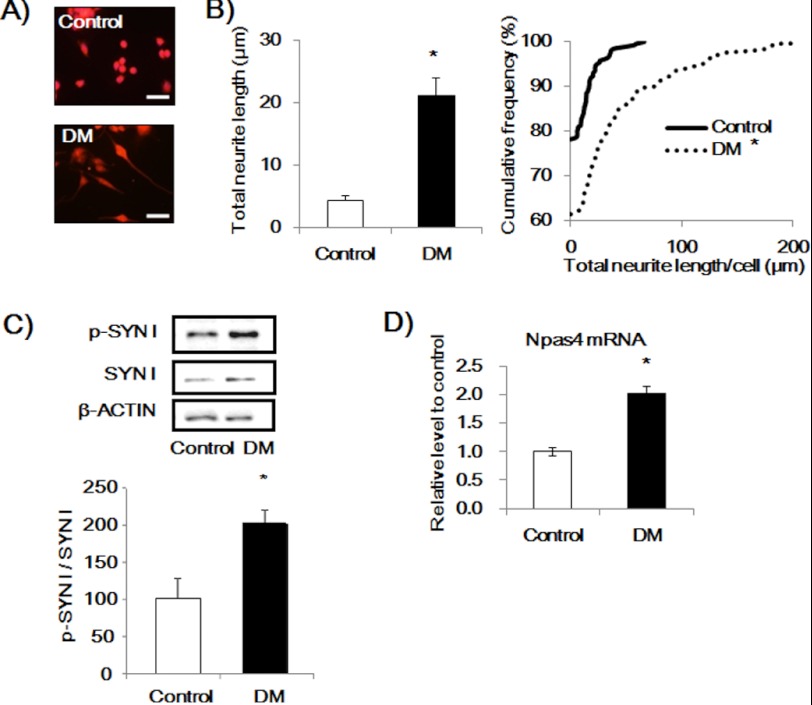
Neuronal differentiation of Neuro2a cells can be induced by treatment with DM leading to morphological changes with longer neurites. When Neuro2a cells were treated with DM for 48 h, neurite outgrowth in Neuro2a cells was accompanied by an increase in p-SYN I levels (Fig. 1, A–C) with no change in total SYN I levels. Next, we investigated whether neurite outgrowth of Neuro2a cells and the increase in p-SYN I levels induced by DM were associated with changes in Npas4 mRNA levels. We measured Npas4 mRNA levels in DM-treated Neuro2a cells using quantitative RT-PCR. DM significantly increased the mRNA levels of Npas4 in Neuro2a cells (Fig. 1D).
FIGURE 1.
Effect of DM treatment for 48 h on neurite outgrowth, NPAS4, and p-SYN I expression levels in Neuro2a cells. A, representative photographs showing control (top) and DM-treated cells (bottom). Scale bar, 20 μm. B, quantitative analysis of neurite length. Values indicate the mean ± S.E. (left) and the cumulative frequency of neurite length (right). (n = 261 for control and n = 251 for DM.). *, p < 0.001 versus control (Student's t test, Kolmogorov-Smirnov test). C, immunoblot analysis of p-SYN I expression levels induced by DM. Values indicate the mean ± S.E. (n = 8). *, p < 0.05 versus control (Student's t test). D, quantitative RT-PCR analysis of the Npas4 mRNA level. Values indicate the mean ± S.E. (n = 3). *, p < 0.01 versus control (Student's t test).
Effect of Npas4 Knockdown by siRNA Treatment on Neurite Outgrowth in Neuro2a Cells
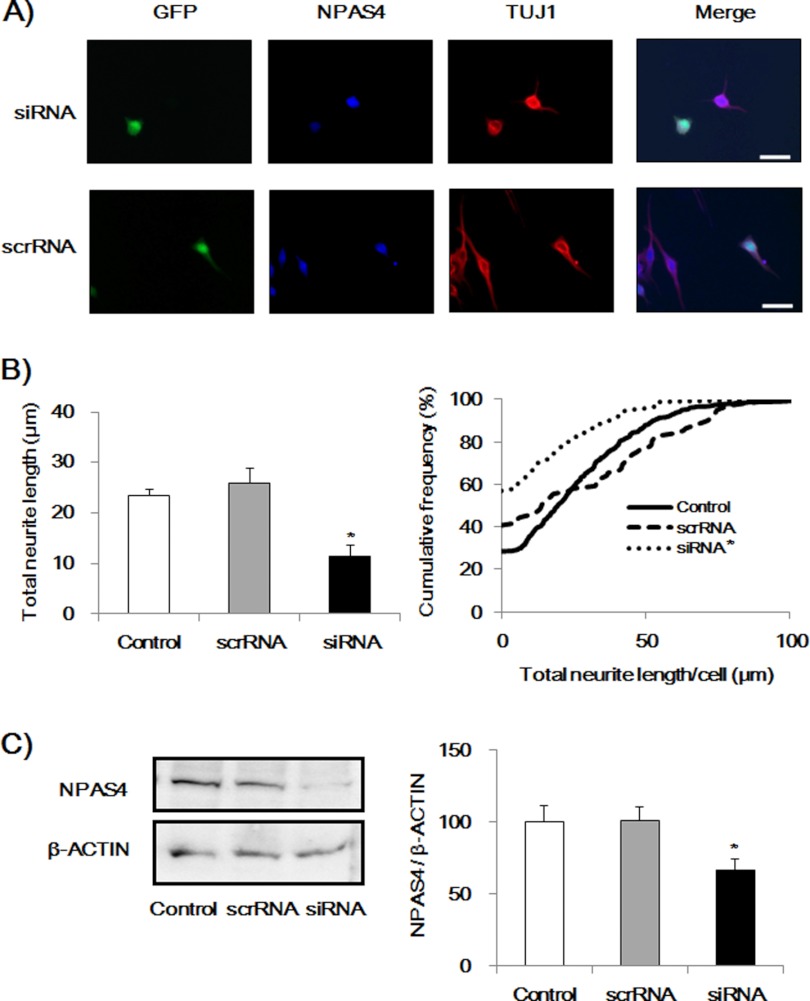
To study the causal relationship between the DM-induced increase in NPAS4 expression and the neurite outgrowth in Neuro2a cells, we next examined whether knockdown of Npas4 expression by siRNA treatment suppressed neurite outgrowth induced by DM treatment. The siRNA or scrambled siRNA of Npas4 with a pZsGreen1-N1 vector, which encodes green fluorescent protein (GFP), was transfected in Neuro2a cells. Seventy two hours after the transfection, cells were treated with DM for 24 h, and the TUJ1-positive neurite length (25) was quantified. GFP-positive cells were regarded as siRNA- or scrambled RNA-transfected cells, whereasGFP-negative cells were considered to be nontransfected cells. The siRNA transfection significantly suppressed the neurite outgrowth induced by DM, whereas scrambled siRNA did not affect the neurite length (Fig. 2).
FIGURE 2.
Effect of NPAS4 knockdown on neurite outgrowth induced by DM in Neuro2a cells. A, representative photographs showing immunocytochemical analysis of siRNA- or scrRNA-transfected cells (GFP-positive). Scale bar, 20 μm. B, quantitative analysis of neurite length. Values indicate the mean ± S.E. (left) and the cumulative frequency of neurite length (right). (n = 79 for Npas4 siRNA transfection (siRNA), n = 81 for scrambled siRNA transfection (scrRNA), and n = 463 for nontransfection (control).). *, p < 0.01 versus scrRNA and control (one-way ANOVA followed by Dunnett's test, confirmed by the Kolmogorov-Smirnov test). C, immunoblot analysis of NPAS4 expression levels in control, Npas4 siRNA, or scrRNA-transfected Neuro2a cells. Seventy two hours after transfection, the medium was replaced with DM, and the cells were cultured for 24 h. Values indicate the mean ± S.E. (n = 10–11). *, p < 0.05 versus control and scrRNA (one-way ANOVA followed by Dunnett's test).
Effect of NPAS4 Overexpression on Neurite Outgrowth in Neuro2a Cells
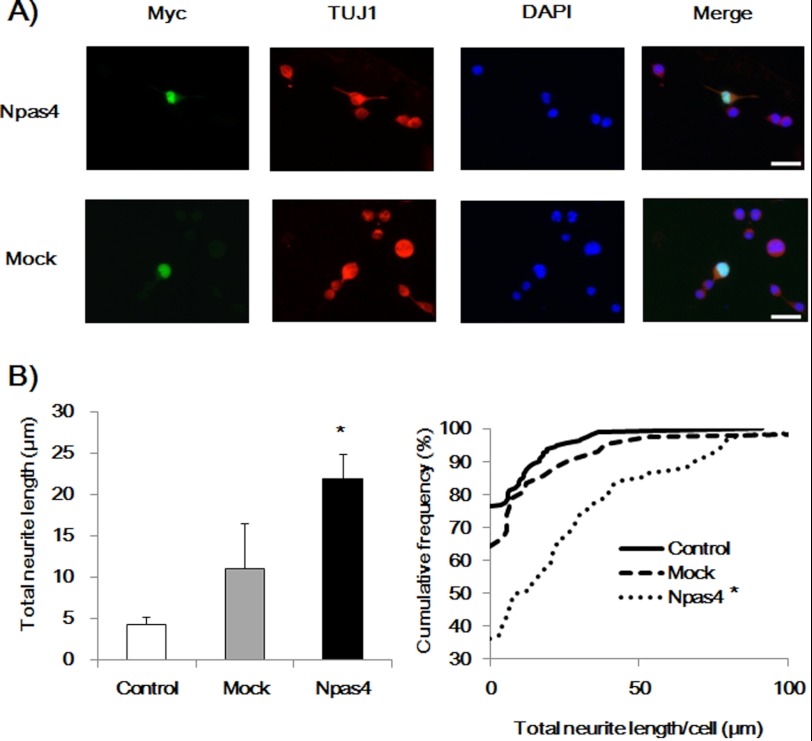
To investigate the role of NPAS4 in neurite outgrowth in Neuro2a cells further, we examined whether overexpression of NPAS4 facilitated neurite outgrowth induced by DM treatment. Seventy two hours after the transfection, cells were treated with DM for 12 h, and the neurite length was quantified. At this time point, neurite outgrowth induced by DM treatment in control cells was minimum (Fig. 3) compared with the length at 24 h (Fig. 2). Myc-positive cells were regarded as Npas4 vector- or mock vector-transfected cells, whereas Myc-negative cells were considered to be nontransfected cells. Overexpression of NPAS4 significantly increased the neurite outgrowth induced by DM, whereas the mock vector had no effect on the neurite length in Neuro2a cells (Fig. 3).
FIGURE 3.
Effect of NPAS4 overexpression on neurite outgrowth induced by DM in Neuro2a cells. A, representative photographs showing immunocytochemical analysis of Npas4- or mock vector-transfected cells (Myc-positive). Scale bar, 20 μm. B, quantitative analysis of neurite length. Values indicate the mean ± S.E. (left) and the cumulative frequency of neurite length (right). (n = 88 for Npas4 vector transfection (Npas4), n = 42 for mock vector transfection (Mock), and n = 160 for nontransfection (Control).) *, p < 0.01 versus mock and control (one-way ANOVA followed by Dunnett's test, confirmed by the Kolmogorov-Smirnov test).
Effect of NPAS4 Overexpression on NeuN, p-SYN I, and Tuj1 Expression in Neuro2a Cells
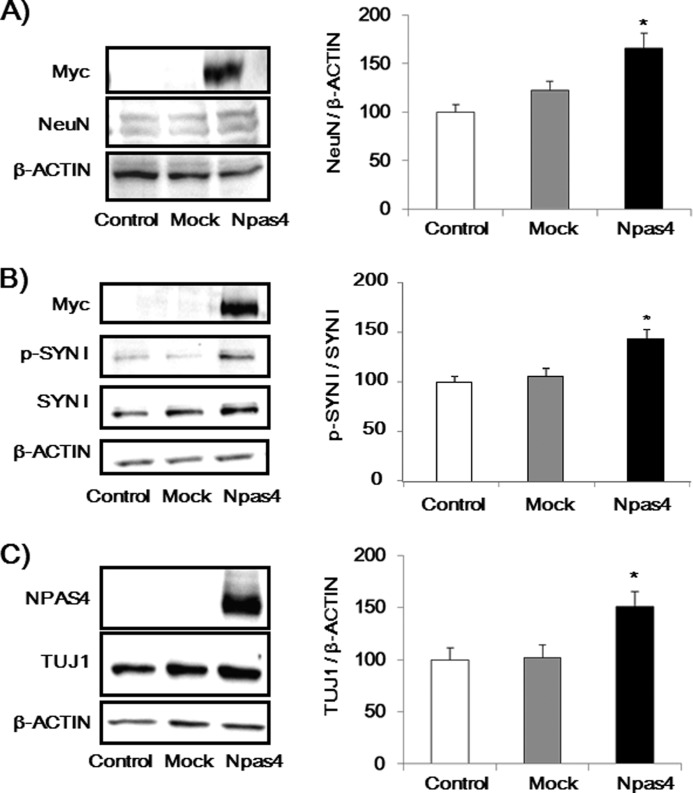
To clarify the role of NPAS4 in neuronal maturation, the expression levels of NeuN, p-SYN I, and TUJ1 were investigated in NPAS4-overexpressed Neuro2a cells. Seventy two hours after the transfection, cells were harvested, and immunoblot analysis was performed. Overexpression of NPAS4 increased NeuN and p-SYN I expression levels, whereas the mock vector had no effect in Neuro2a cells (Fig. 4, A and B). In addition, overexpression of NPAS4 significantly increased the neurite marker TUJ1 expression levels induced by DM (Fig. 4C).
FIGURE 4.
NPAS4 overexpression increased NeuN, p-SYN I, and TUJ1 expression levels in Neuro2a cells. A, immunoblot analysis of NeuN expression levels induced by NPAS4 overexpression (n = 10–11). B, immunoblot analysis of p-SYN I expression levels induced by NPAS4 overexpression (n = 10–11). C, immunoblot analysis of TUJ1 expression levels induced by NPAS4 overexpression with DM (n = 6). Values indicate the mean ± S.E. *, p < 0.05 versus mock and control (one-way ANOVA followed by Dunnett's test).
Involvement of CDK5 in p-SYN I Expression in NPAS4-overexpressed Neuro2a Cells
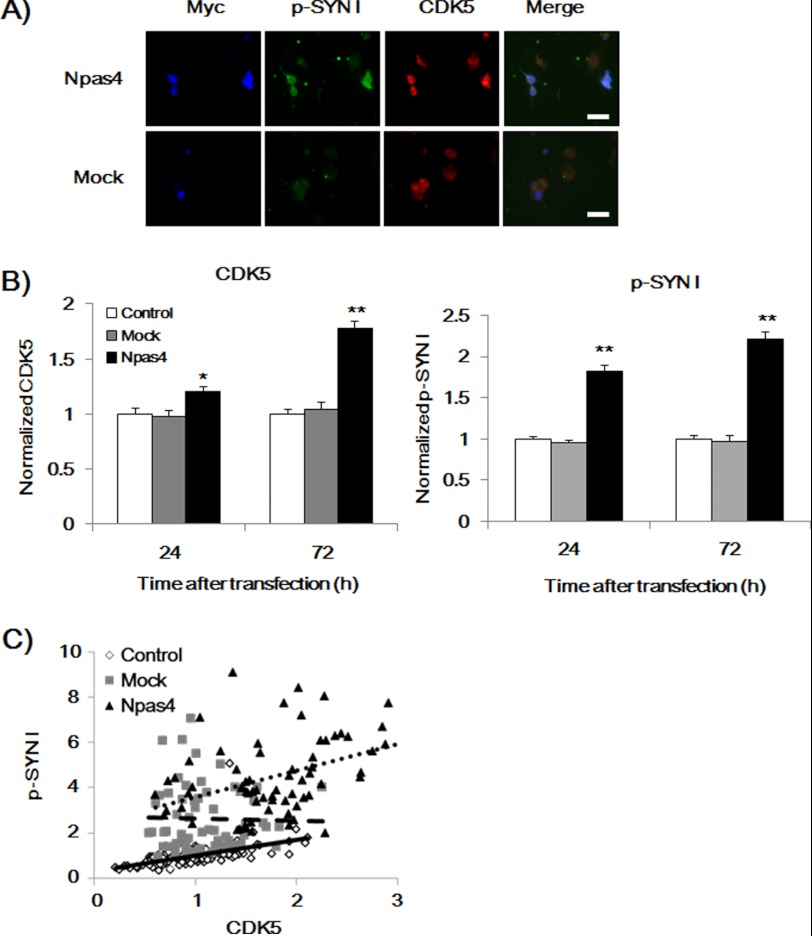
The anti-p-Syn I antibodies used in this study recognize phosphorylated Ser553 of SYN I, which is known to be a substrate of CDK5 (30, 31). Therefore, we measured CDK5 expression levels and its role for p-SYN I expression levels in NPAS4-overexpressed cells. Immunocytochemical analysis was performed 24 and 72 h after transfection with the Npas4 overexpression vector in Neuro2a cells. Overexpression of NPAS4 significantly increased CDK5 and p-SYN I expression levels in Neuro2a cells, whereas mock transfection had no effect (Fig. 5, A and B). Regression lines (72 h) were analyzed. There was a positive correlation between p-SYN I and CDK5 expression levels in the control (y = 0.691x + 0.308, R2 = 0.288, p < 0.001) and NPAS4-overexpressed Neuro2a cells (y = 1.159x + 2.427, R2 = 0.156, p < 0.001), and the slope for NPAS4-overexpressed Neuro2a cells was significantly greater than that for the control (p < 0.05). However, no correlation was observed in mock-transfected Neuro2a cells (y = −0.092x + 2.731, R2 = 0.000) (Fig. 5C).
FIGURE 5.
NPAS4 overexpression increased CDK5 and p-SYN I expression levels and the relationship between CDK5 and p-SYN I expression in Neuro2a cells. A, representative photographs showing immunocytochemical analysis of CDK5 and p-SYN I expression levels (72 h after transfection). Scale bar, 20 μm. B, quantitative analysis of CDK5 expression levels at 24 and 72 h after transfection (left). Values (the mean ± S.E.) indicate normalized CDK5 levels. (n = 81 for Npas4 vector transfection (Npas4), n = 32 for mock vector transfection (Mock), and n = 74 for nontransfection (control), 24 h after transfection. n = 103 for Npas4 vector transfection (Npas4), n = 39 for mock vector transfection (Mock), and n = 154 for nontransfection (control), 72 h after transfection.) *, p < 0.01; **, p < 0.001 versus control and mock (one-way ANOVA followed by Dunnett's test). Quantitative analysis of p-SYN I expression levels at 24 and 72 h after transfection (right). Values (the mean ± S.E.) indicate normalized p-SYN I levels. (n = 62 for Npas4 vector transfection (Npas4), n = 32 for mock vector transfection (mock), and n = 109 for nontransfection (control), 24 h after transfection. n = 74 for Npas4 vector transfection (Npas4), n = 36 for mock vector transfection (mock), and n = 43 for nontransfection (control), 72 h after transfection.) **, p < 0.001 versus control and mock (one-way ANOVA followed by Dunnett's test). C, regression analysis of the relationship between CDK5 and p-Syn I expression levels at 72 h after transfection. (n = 68 for Npas4 vector transfection (Npas4), n = 60 for mock vector transfection (Mock), and n = 117 for nontransfection (Control).). The expression levels of p-SYN I were correlated with CDK5 expression levels in control and NPAS4-overexpressed cells. There are significant differences among the slopes (p < 0.05, parallel line analysis).
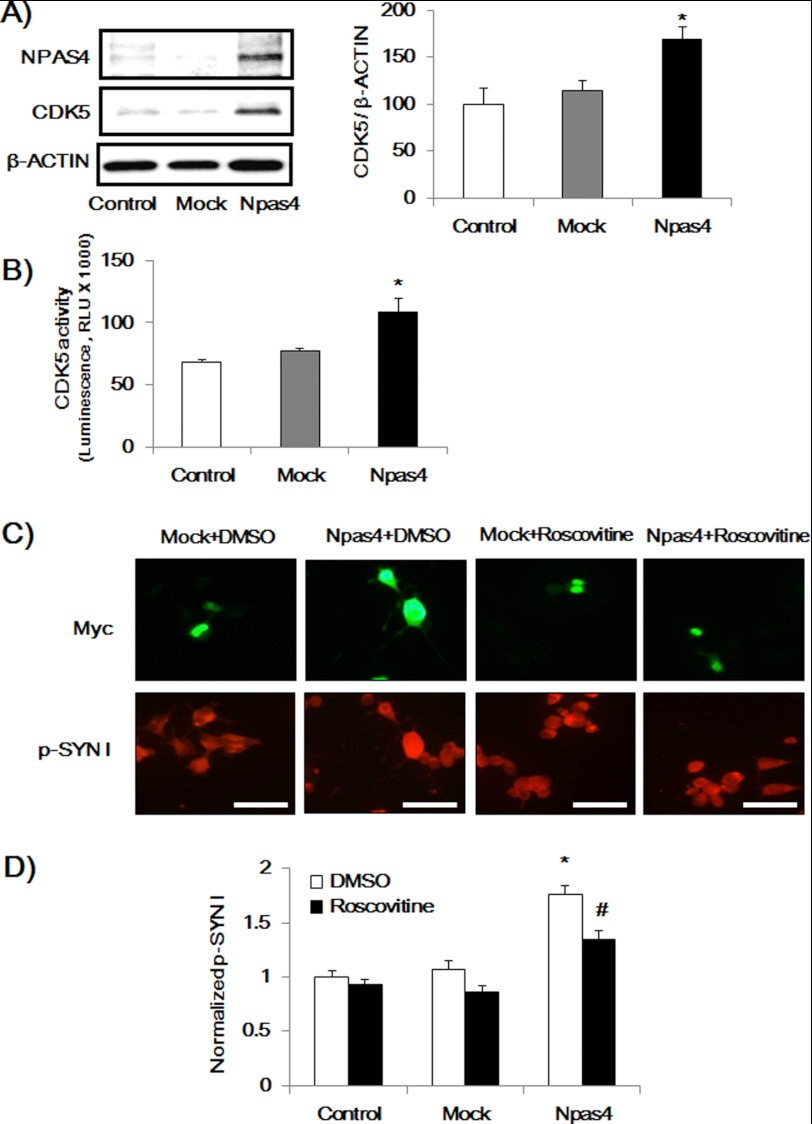
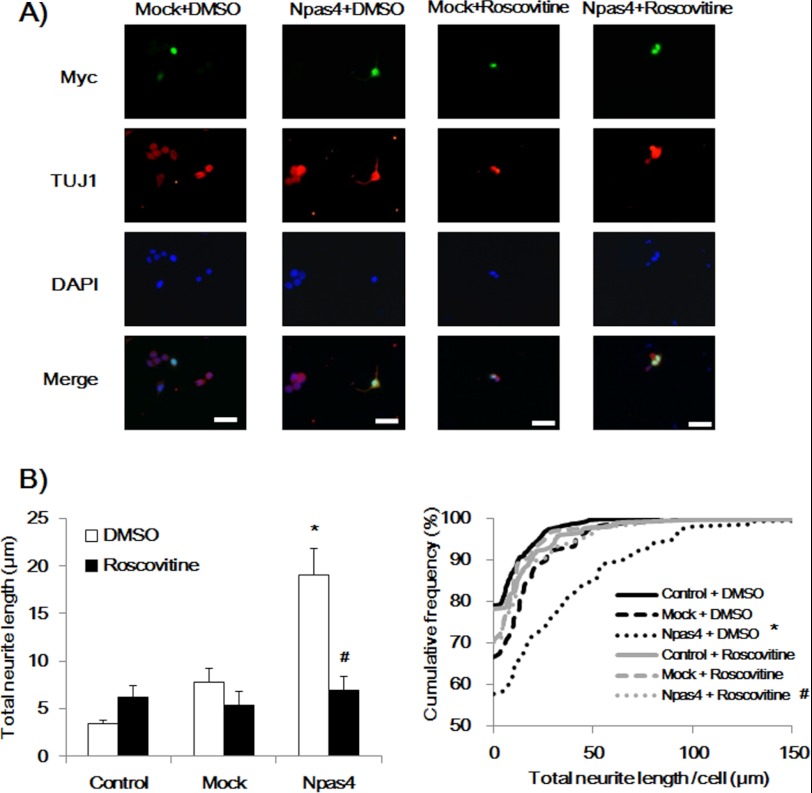
Furthermore, we measured the CDK5 expression levels and kinase activity in NPAS4-overexpressed Neuro2a cells. Overexpression of NPAS4 increased CDK5 expression and activity, whereas the mock vector had no effect in Neuro2a cells (Fig. 6, A and B). To explore the causal relationship, NPAS4-overexpressed Neuro2a cells (72 h after the transfection) were treated with DM for 12 h, during which a CDK5 inhibitor, roscovitine (30 μm, Calbiochem), or DMSO was added to the culture medium (total 84 h), and p-SYN I expression levels and neurite length were measured. Roscovitine significantly reduced the p-SYN I expression (Fig. 6, C and D) and neurite outgrowth (Fig. 7) in Neuro2a cells induced by NPAS4 overexpression.
FIGURE 6.
NPAS4 overexpression increased CDK5 expression levels and kinase activity and roscovitine inhibited p-SYN I expression levels. A, immunoblot analysis of CDK5 expression levels induced by NPAS4 overexpression (n = 3). Values indicate the mean ± S.E. *, p < 0.05 versus mock and control (one-way ANOVA followed by Dunnett's test). B, CDK5 activity assay in NPAS4 overexpressed Neuro2a cells (n = 4). Values indicate the mean ± S.E. *, p < 0.05 versus mock and control (one-way ANOVA followed by Dunnett's test). RLU, relative light units. C, representative photographs showing immunocytochemical analysis of p-SYN I expression in Npas4 vector-transfected cells (Myc-positive) in the presence or absence of roscovitine treatment. Scale bar, 20 μm. D, quantitative analysis of p-SYN I expression levels. Values (mean ± S.E.) indicate normalized p-SYN I levels. (n = 55 for Npas4 + DMSO; n = 33 for Npas4 + roscovitine; n = 41 for mock + DMSO; n = 28 for mock + roscovitine; n = 51 for control + DMSO, and n = 47 for control + roscovitine.) *, p < 0.05 versus control + DMSO and mock + DMSO; #, p < 0.05 versus Npas4 + DMSO (one-way ANOVA followed by Dunnett's test).
FIGURE 7.
Roscovitine inhibited neurite outgrowth in NPAS4-overexpressed Neuro2a cells. A, representative photographs showing immunocytochemical analysis of neurite outgrowth in Npas4 vector-transfected cells (Myc-positive) in the presence or absence of roscovitine treatment. Scale bar, 20 μm. B, quantitative analysis of neurite length. Values indicate the mean ± S.E. (left) and the cumulative frequency of neurite length (right). (n = 89 for Npas4 + DMSO; n = 120 for mock + DMSO; n = 545 for control + DMSO; n = 148 for Npas4 + roscovitine; n = 65 for mock + roscovitine, and n = 308 for control + roscovitine). *, p < 0.001 versus mock + DMSO and control + DMSO; #, p < 0.001 versus Npas4 + DMSO (one-way ANOVA followed by Dunnett's test, confirmed by the Kolmogorov-Smirnov test).
Phosphorylated SYN I Expression and Neurite Outgrowth in Hippocampal Neurons
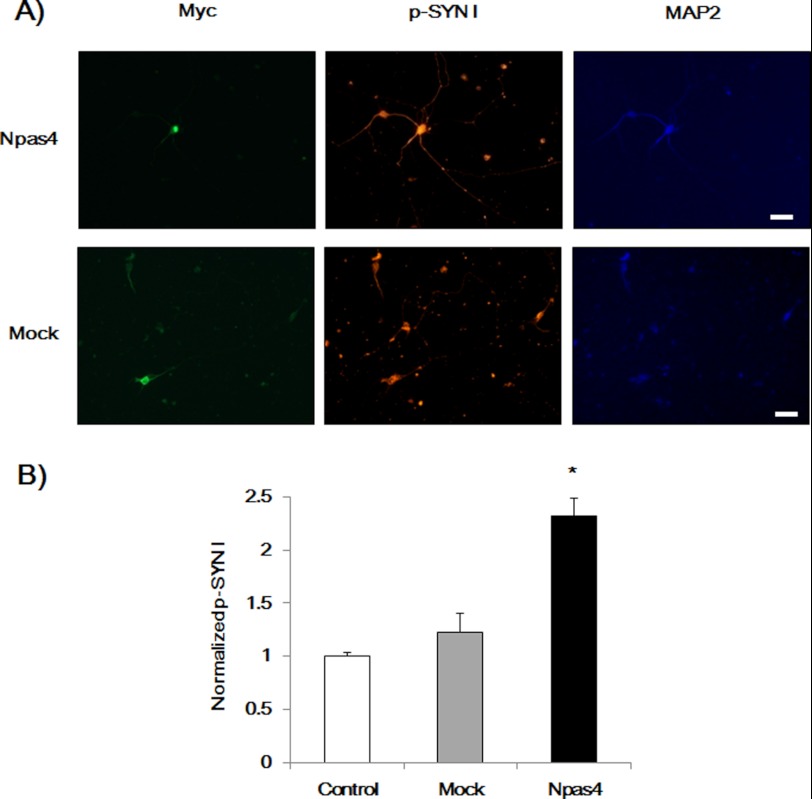
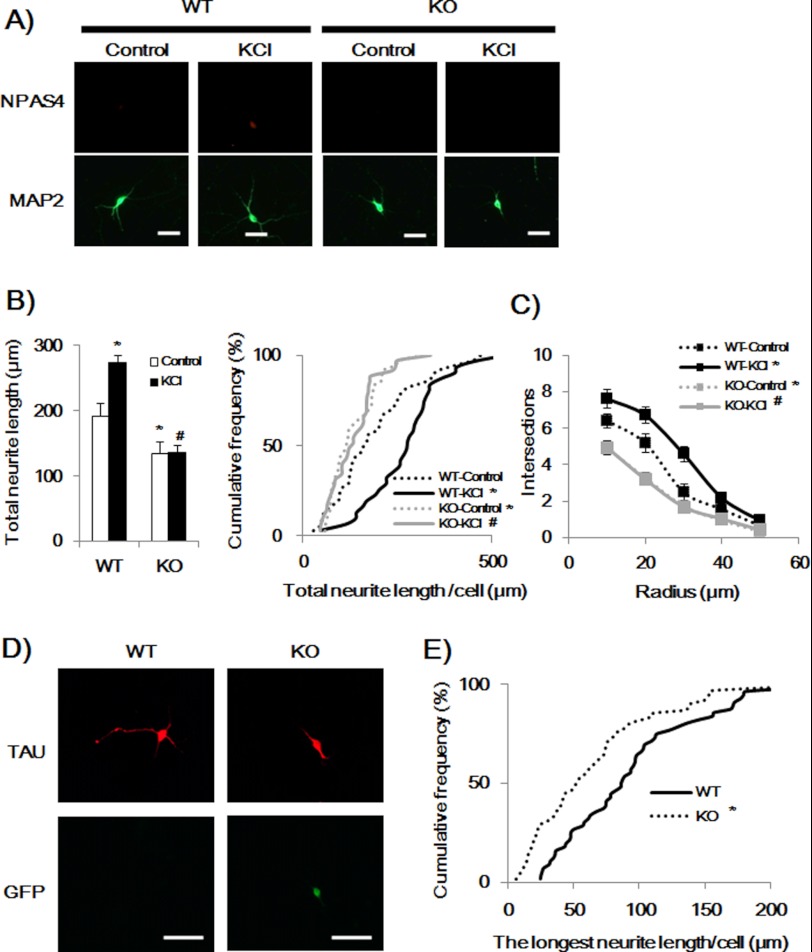
To confirm NPAS4-induced phosphorylation of SYN I in hippocampal neurons, p-SYN I expression levels were investigated in NPAS4-overexpressed hippocampal neurons. Twenty four hours after the transfection, immunocytochemical analysis was performed. Overexpression of NPAS4 increased p-SYN I levels in hippocampal neurons, whereas the mock vector had no effect (Fig. 8). We compared neurite length between WT and Npas4 KO hippocampal neurons. Npas4 KO hippocampal neurons showed an impaired MAP2-positive dendritic (Fig. 9, A and B) and Tau-positive axonal outgrowth (Fig. 9, D and E) and a reduction in the number of intersections of dendrites (Sholl analysis, Fig. 9C) compared with WT hippocampal neurons. Furthermore, KCl treatment increased dendritic length and complexity in WT hippocampal neurons but not in Npas4 KO hippocampal neurons (Fig. 9, A–C).
FIGURE 8.
NPAS4 overexpression increased p-SYN I expression levels in primary cultured hippocampal neurons. A, representative photographs showing immunocytochemical analysis of p-SYN I expression in Npas4 vector-transfected cells (Myc-positive). Scale bar, 20 μm. B, quantitative analysis of p-SYN I expression levels. Values (the mean ± S.E.) indicate normalized p-SYN I levels. (n = 48 for Npas4 vector transfection (Npas4), n = 34 for mock vector transfection (Mock), and n = 77 for nontransfection (Control)). *, p < 0.05 versus control and mock (one-way ANOVA followed by Dunnett's test).
FIGURE 9.
Impairment of neurite outgrowth in primary cultured hippocampal neurons of Npas4 KO mice. A, representative photographs showing immunocytochemical analysis of dendritic outgrowth in hippocampal neurons of WT and KO mice in the presence or absence of KCl (16 mm, DIV 7–9) treatment. Scale bar, 20 μm. B, quantitative analysis of dendritic length. Values indicate the mean ± S.E. (left). *, p < 0.01 versus WT-Control; #, p < 0.001 versus WT-KCl (two-way ANOVA, Bonferroni's test), and the cumulative frequency of dendritic length (right). *, p < 0.05 versus WT-Control, #, p < 0.001 versus WT-KCl (Kolmogorov-Smirnov test). (n = 34 for WT-Control; n = 31 for WT-KCl; n = 36 for KO-Control; n = 35 for KO-KCl.) C, intersections. The concentric circle method of Sholl was used for dendritic quantification. *, p < 0.001 versus WT-Control; #, p < 0.001 versus WT-KCl (three-way ANOVA followed by Bonferroni's test). D, representative photographs showing immunocytochemical analysis of axonal outgrowth in hippocampal neurons of WT and KO mice (DIV 3). GFP signals indicate Npas4 KO hippocampal neurons (13). Scale bar, 20 μm. E, quantitative analysis of axonal length. Values indicate the mean ± S.E. (n = 31) *, p < 0.01 versus WT (Kolmogorov-Smirnov test).
Binding of NPAS4 to Promoter Regions of CDK5 and NeuN Genes in Neuro2a Cells and Primary Cultured Neurons
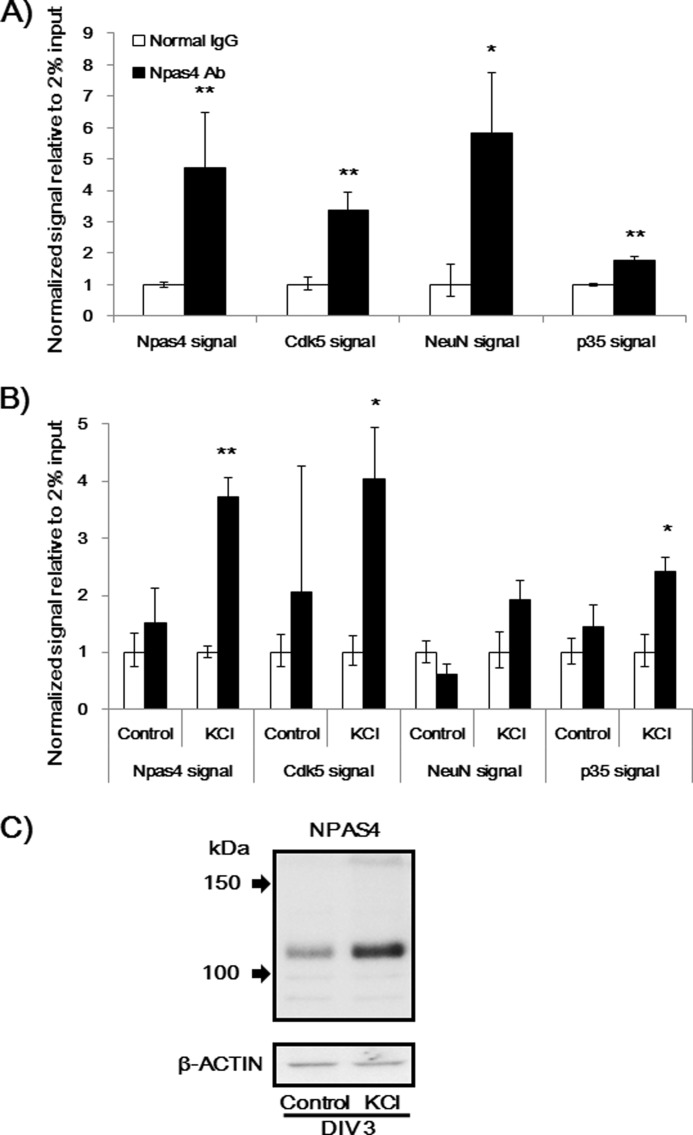
We used a ChIP assay to confirm the binding of NPAS4 to Cdk5 and NeuN promoters. An Npas4 promoter was used as a positive control (13). The ChIP assay revealed that NPAS4 binds to promoter regions of Cdk5 and NeuN in DM-treated Neuro2a cells (Fig. 10A). In primary cultured neurons, a ChIP assay was conducted with or without KCl stimulation because the treatment was reported to induce NPAS4 in cultured neurons (13). As shown in Fig. 10C, we confirmed the increase in NPAS4 protein levels after KCl stimulation in primary hippocampal neurons. Only under such conditions was the binding of NPAS4 to the promoters of Npas4 and Cdk5 proven by the ChIP assay (Fig. 10B). Furthermore, NPAS4 bound to a promoter of p35, a coactivator of CDK5, in Neuro2a cells as well as in primary cultured neurons (Fig. 10).
FIGURE 10.
NPAS4 binds to promoters of Cdk5, Neu, and p35. A, ChIP assay in Neuro2a cells. Values (mean ± S.E.) indicate a normalized signal to 2% input. *, p < 0.05; **, p < 0.01 versus normal IgG (Student's t test, n = 3–5). B, ChIP assay in primary cultured neurons. Values (the mean ± S.E.) indicate a normalized signal to 2% input. *, p < 0.05; **, p < 0.001 versus normal IgG (Student's t test, n = 3). C, immunoblot analysis of NPAS4 expression in primary cultured hippocampal neurons on DIV 3 with or without KCl (50 mm) stimulation.
Effect of PTZ Administration on NPAS4 and p-SYN I Expression in the Prefrontal Cortex of Npas4 KO and WT Mice
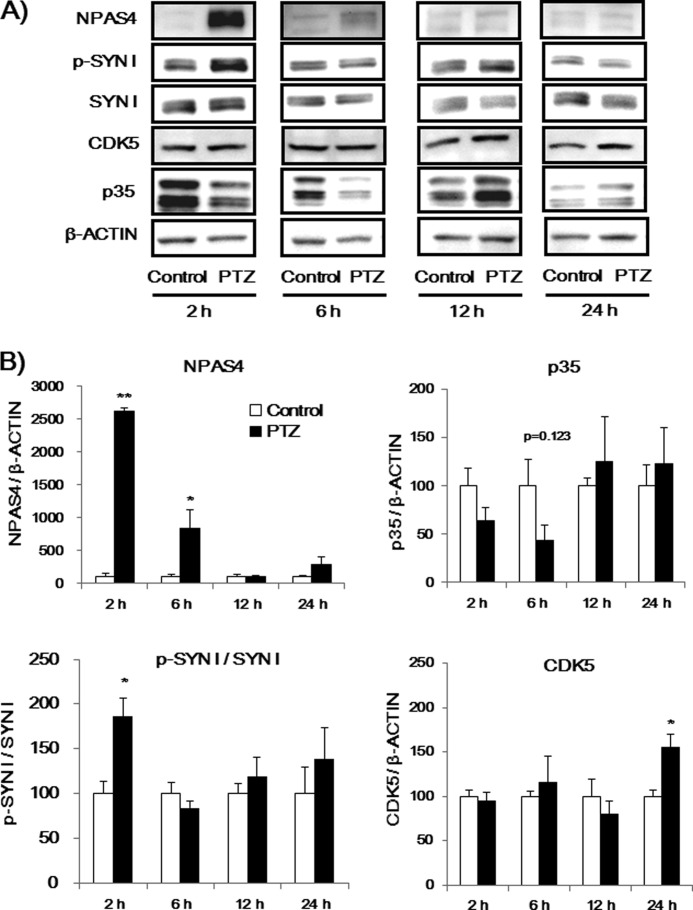
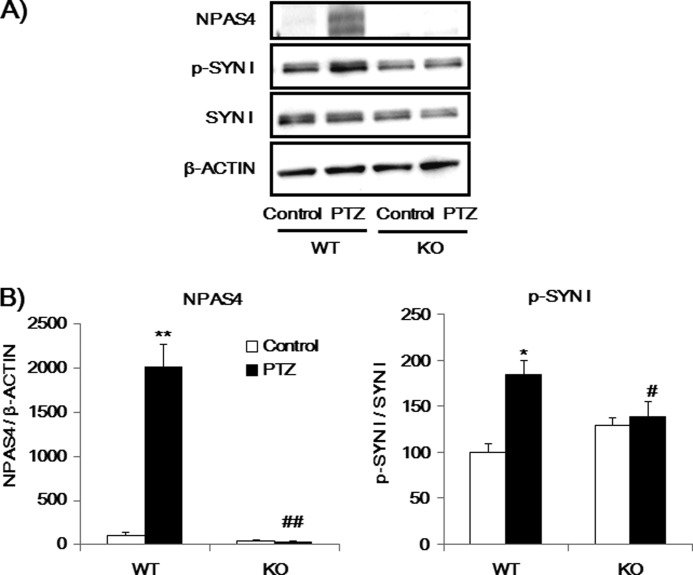
Finally, we investigated if p-SYN I expression was affected by in vivo PTZ treatment in WT and Npas4 KO mice because it has been reported that PTZ-induced convulsions in mice lead to an increase in the Npas4 mRNA levels in the hippocampus (32). First, we measured NPAS4, p-SYN I, SYN I, p35 and CDK5 expression levels 2, 6, 1, and 24 h after PTZ administration in the prefrontal cortex of WT mice (Fig. 11). PTZ-induced NPAS4 and p-SYN I were most highly expressed 2 h after PTZ administration. We next compared the effects of PTZ on NPAS4 and p-SYN I levels in WT and KO mice 2 h after treatment. PTZ administration increased Npas4 levels in the prefrontal cortex of WT mice but not in Npas4 KO mice (Fig. 12). Similarly, p-SYN I levels were increased by PTZ administration in WT mice, whereas the same treatment had no effect on p-SYN I levels in Npas4 KO mice (Fig. 12). There was no difference in the intensity score of convulsions induced by PTZ treatment between Npas4 KO mice (convulsion score 4.5 ± 0.5) and WT mice (3.9 ± 0.13), suggesting that the changes in p-SYN I levels after PTZ treatment in Npas4 KO mice are not due to the reduced excitability of the mutant mouse brains.
FIGURE 11.
PTZ-induced NPAS4, p-SYN I, SYN I, CDK5, and p35 expression in the prefrontal cortex of mice at different time points. A, immunoblot analysis of NPAS4, p-SYN I, SYN I, CDK5, and p35 expression levels in the prefrontal cortex of mice at various time points after PTZ injection. B, quantitative analysis of immunoblots (A). Values indicate the mean ± S.E. (n = 4). *, p < 0.05; **, p < 0.001 versus control (Student's t test).
FIGURE 12.
NPAS4 is a key factor in PTZ-induced phosphorylation of SYN I. A, immunoblot analysis of NPAS4, p-SYN I, and SYN I expression levels in the prefrontal cortex of mice 2 h after PTZ injection. B, quantitative analysis of immunoblots (A). Values indicate the mean ± S.E. (n = 5–8). *, p < 0.05; **, p < 0.001 versus WT-Control. #, p < 0.05; ##, p < 0.001 versus WT-PTZ (two-way ANOVA followed by Bonferroni's test).
DISCUSSION
NPAS4 is a brain-specific neuronal transcription factor that may respond to various excitatory stimuli and has a role in GABAergic neuronal synapse development (13–15). A recent study demonstrated that the activity-dependent expression of NPAS4 regulates a transcriptional program in the CA3 hippocampus required for contextual memory formation (18).
In this study, we showed that DM induced an increase in neurite outgrowth with an elevated Npas4 mRNA level. DM-induced neurite outgrowth was inhibited in Npas4 knockdown Neuro2a cells, whereas overexpression of NPAS4 accelerated the neurite outgrowth induced by DM. Furthermore, we demonstrated that axonal and dendritic outgrowths were impaired in Npas4 KO hippocampal neurons. Although it was reported that NPAS4 was expressed after maturation in primary cultured neurons (13), our data indicate that this transcription factor is expressed even in immature neurons at DIV 3 (Fig. 10C). Under such culture conditions, an impaired axonal outgrowth was evident in Npas4 KO neurons compared with WT neurons. Lin et al. (13) showed that Npas4-RNAi transfection at DIV 6 did not decrease dendritic complexity at a later stage (DIV 25–26). We compared the dendritic length of WT and conventional KO mice hippocampal neurons at DIV 9, and we found that the dendritic length of Npas4 KO neurons was significantly shorter than that of WT neurons. Furthermore, KCl-induced dendritic outgrowth, which was evident in WT neurons, was abolished in Npas4 KO hippocampal neurons. These results suggest that the role of NPAS4 in dendritic outgrowth varies depending on neuronal development stages in an activity-dependent manner.
Activity-dependent neurite outgrowth in cultured hippocampal neurons is reported to be mediated via activation by CaM-dependent protein kinase of the membrane-associated γ isoform of CaMKI (27), whereas the DM-induced neurite outgrowth in Neuro2a cells is associated with inhibition of GSK-3β (33). In our study, NPAS4 overexpression elevated CDK5 and p-SYN I expression levels and enhanced neurite outgrowth. The CDK5 inhibitor roscovitine reduced p-SYN I expression, as well as neurite outgrowth induced by NPAS4 overexpression. SYN I has been characterized as one of the major phosphoproteins in nerve terminals and is thought to be involved in the regulation of neurotransmitter release (34, 35). Both phosphorylated and nonphosphorylated Syn I regulate neuronal development (36–38). The anti-p-Syn I antibodies used in this study recognize phosphorylated Ser553 of SYN I, which is known to be phosphorylated by CDK5 (30, 31). Although previous DNA microarrays and ChIP-Seq studies did not reveal that CDK5 or CDK5-coactivator p35 is a target of NPAS4 (13, 46), CDK5 is essential for neurite outgrowth (39–41) and has roles in the physiological regulation of cytoskeletal components during neurotransmitter release via phosphorylation of SYN I (30). We demonstrated that NPAS4 overexpression increased CDK5 protein and the kinase activity in Neuro2a cells. In addition, NPAS4 bound to promoter regions of CDK5 as well as p35 in KCl-activated primary cultured neurons and DM-treated Neuro2a cells. Accordingly, it is suggested that NPAS4 may directly regulate transcription of CDK5 and consequently increase the protein expression with kinase activity, which is associated with neurite outgrowth.
We also demonstrated that PTZ-induced phosphorylation of SYN I in vivo was absent in NPAS4 KO mice, suggesting that NPAS4 has a crucial role in SYN I phosphorylation in vivo. However, there might be concern that the NPAS4/CDK5/SYN I signaling in neurite outgrowth described here may operate only in vitro cell culture systems because the in vivo study showed that phosphorylation of SYN I was induced by PTZ without an increase in the levels of CDK5 or p35. In fact, CDK5 expression was increased at 24 h, but not 2 h, after PTZ treatment, whereas an increase in p-SYN I and NPAS4 was observed at 2 h, but not 24 h, after PTZ treatment (Fig. 11). It is therefore likely that unidentified downstream signaling mechanisms other than CDK5 of NPAS4 may operate in the regulation of SYN I phosphorylation in neurons. To address this issue, further experiments with other animal models of epileptogenesis (42) are necessary in Npas4 KO mice.
A useful mature neuronal marker, NeuN, was induced in NPAS4-overexpressed Neuro2a cells, whereas NeuN was hardly detected in nontransfected control cells, as demonstrated in previous reports (43, 44). Although NeuN was not identified as a target of NPAS4 in previous studies (13, 45), NeuN has been identified as a transcriptional factor, FOX-3, and appears to be a nervous system-specific nuclear regulatory molecule and a splicing regulator (46, 47). In our study, a ChIP assay showed that Npas4 binds the promoter of NeuN in Neuro2a cells. Accordingly, NPAS4 may have indirect effects through the regulation of other transcriptional factors (18). Taking these findings together, it is suggested that NPAS4 contributes to neurite development and functional maturation of neurons through the transcriptional regulation of neurotransmission and neurodevelopment-associated molecules.
Acknowledgments
We thank Drs. N. Ogiso, Y. Ohya, and K. Yano (Division for Research of Laboratory Animals, Nagoya University) for their technical assistance.
This work was supported in part by Grants-in-aid for Scientific Research 22390046, 23659135, and 23790081, Exploratory Research from Japan Society for the Promotion of Science, “Integrated Research on Neuropsychiatric Disorders” and “Bioinformatics for Brain Sciences” carried out under the Strategic Research Program for Brain Sciences from the Ministry of Education, Culture, Sports, Science and Technology, the Global-Center of Excellence Program from the Ministry of Education, Culture, Sports, Science and Technology, CREST from Japan Science and Technology Agency, Intramural Research Grant 24-12 for Neurological and Psychiatric Disorders of National Center of Neurology and Psychiatry, Agriculture, Forestry and Fisheries Research Council Project, Nobiletin Research and Development Consortium, Smoking Research Foundation Grant for Biomedical Research, and The Uehara Memorial Foundation.
- Syn I
- synapsin I
- ANOVA
- analysis of variance
- DM
- differentiation medium
- p-Syn I
- phosphorylated synapsin I
- DIV
- day in vitro
- PTZ
- pentylenetetrazole.
REFERENCES
- 1. Erbel-Sieler C., Dudley C., Zhou Y., Wu X., Estill S. J., Han T., Diaz-Arrastia R., Brunskill E. W., Potter S. S., McKnight S. L. (2004) Behavioral and regulatory abnormalities in mice deficient in the NPAS1 and NPAS3 transcription factors. Proc. Natl. Acad. Sci. U.S.A. 101, 13648–13653 [DOI] [PMC free article] [PubMed] [Google Scholar]
- 2. Havrda M. C., Harris B. T., Mantani A., Ward N. M., Paolella B. R., Cuzon V. C., Yeh H. H., Israel M. A. (2008) Id2 is required for specification of dopaminergic neurons during adult olfactory neurogenesis. J. Neurosci. 28, 14074–14086 [DOI] [PMC free article] [PubMed] [Google Scholar]
- 3. Ide M., Yamada K., Toyota T., Iwayama Y., Ishitsuka Y., Minabe Y., Nakamura K., Hattori N., Asada T., Mizuno Y., Mori N., Yoshikawa T. (2005) Genetic association analyses of PHOX2B and ASCL1 in neuropsychiatric disorders. Evidence for association of ASCL1 with Parkinson's disease. Hum. Genet. 117, 520–527 [DOI] [PubMed] [Google Scholar]
- 4. Lee S., Lee B., Lee J. W., Lee S. K. (2009) Retinoid signaling and neurogenin2 function are coupled for the specification of spinal motor neurons through a chromatin modifier CBP. Neuron 62, 641–654 [DOI] [PMC free article] [PubMed] [Google Scholar]
- 5. Pickard B. S., Pieper A. A., Porteous D. J., Blackwood D. H., Muir W. J. (2006) The NPAS3 gene–emerging evidence for a role in psychiatric illness. Ann. Med. 38, 439–448 [DOI] [PubMed] [Google Scholar]
- 6. Shimizu N., Watanabe H., Kubota J., Wu J., Saito R., Yokoi T., Era T., Iwatsubo T., Watanabe T., Nishina S., Azuma N., Katada T., Nishina H. (2009) Pax6-5a promotes neuronal differentiation of murine embryonic stem cells. Biol. Pharm. Bull. 32, 999–1003 [DOI] [PubMed] [Google Scholar]
- 7. Ooe N., Saito K., Mikami N., Nakatuka I., Kaneko H. (2004) Identification of a novel basic helix-loop-helix-PAS factor, NXF, reveals a Sim2 competitive, positive regulatory role in dendritic-cytoskeleton modulator drebrin gene expression. Mol. Cell. Biol. 24, 608–616 [DOI] [PMC free article] [PubMed] [Google Scholar]
- 8. Zhou Y. D., Barnard M., Tian H., Li X., Ring H. Z., Francke U., Shelton J., Richardson J., Russell D. W., McKnight S. L. (1997) Molecular characterization of two mammalian bHLH-PAS domain proteins selectively expressed in the central nervous system. Proc. Natl. Acad. Sci. U.S.A. 94, 713–718 [DOI] [PMC free article] [PubMed] [Google Scholar]
- 9. Brunskill E. W., Witte D. P., Shreiner A. B., Potter S. S. (1999) Characterization of npas3, a novel basic helix-loop-helix PAS gene expressed in the developing mouse nervous system. Mech. Dev. 88, 237–241 [DOI] [PubMed] [Google Scholar]
- 10. Pickard B. S., Christoforou A., Thomson P. A., Fawkes A., Evans K. L., Morris S. W., Porteous D. J., Blackwood D. H., Muir W. J. (2009) Interacting haplotypes at the NPAS3 locus alter risk of schizophrenia and bipolar disorder. Mol. Psychiatry 14, 874–884 [DOI] [PubMed] [Google Scholar]
- 11. Pieper A. A., Wu X., Han T. W., Estill S. J., Dang Q., Wu L. C., Reece-Fincanon S., Dudley C. A., Richardson J. A., Brat D. J., McKnight S. L. (2005) The neuronal PAS domain protein 3 transcription factor controls FGF-mediated adult hippocampal neurogenesis in mice. Proc. Natl. Acad. Sci. U.S.A. 102, 14052–14057 [DOI] [PMC free article] [PubMed] [Google Scholar]
- 12. Moser M., Knoth R., Bode C., Patterson C. (2004) LE-PAS, a novel Arnt-dependent HLH-PAS protein, is expressed in limbic tissues and transactivates the CNS midline enhancer element. Brain Res. Mol. Brain Res. 128, 141–149 [DOI] [PubMed] [Google Scholar]
- 13. Lin Y., Bloodgood B. L., Hauser J. L., Lapan A. D., Koon A. C., Kim T. K., Hu L. S., Malik A. N., Greenberg M. E. (2008) Activity-dependent regulation of inhibitory synapse development by NPAS4. Nature 455, 1198–1204 [DOI] [PMC free article] [PubMed] [Google Scholar]
- 14. Ooe N., Motonaga K., Kobayashi K., Saito K., Kaneko H. (2009) Functional characterization of basic helix-loop-helix-PAS type transcription factor NXF in vivo. Putative involvement in an “on demand” neuroprotection system. J. Biol. Chem. 284, 1057–1063 [DOI] [PubMed] [Google Scholar]
- 15. Shamloo M., Soriano L., von Schack D., Rickhag M., Chin D. J., Gonzalez-Zulueta M., Gido G., Urfer R., Wieloch T., Nikolich K. (2006) NPAS4, a novel helix-loop-helix PAS domain protein, is regulated in response to cerebral ischemia. Eur. J. Neurosci. 24, 2705–2720 [DOI] [PubMed] [Google Scholar]
- 16. Ibi D., Takuma K., Koike H., Mizoguchi H., Tsuritani K., Kuwahara Y., Kamei H., Nagai T., Yoneda Y., Nabeshima T., Yamada K. (2008) Social isolation rearing-induced impairment of the hippocampal neurogenesis is associated with deficits in spatial memory and emotion-related behaviors in juvenile mice. J. Neurochem. 105, 921–932 [DOI] [PubMed] [Google Scholar]
- 17. Yun J., Koike H., Ibi D., Toth E., Mizoguchi H., Nitta A., Yoneyama M., Ogita K., Yoneda Y., Nabeshima T., Nagai T., Yamada K. (2010) Chronic restraint stress impairs neurogenesis and hippocampus-dependent fear memory in mice: possible involvement of a brain-specific transcription factor NPAS4. J. Neurochem. 114, 1840–1851 [DOI] [PubMed] [Google Scholar]
- 18. Ramamoorthi K., Fropf R., Belfort G. M., Fitzmaurice H. L., McKinney R. M., Neve R. L., Otto T., Lin Y. (2011) NPAS4 regulates a transcriptional program in CA3 required for contextual memory formation. Science 334, 1669–1675 [DOI] [PMC free article] [PubMed] [Google Scholar]
- 19. Ploski J. E., Monsey M. S., Nguyen T., DiLeone R. J., Schafe G. E. (2011) The neuronal PAS domain protein 4 (NPAS4) is required for new and reactivated fear memories. PLoS ONE 6, e23760. [DOI] [PMC free article] [PubMed] [Google Scholar]
- 20. Russo S. J., Mazei-Robison M. S., Ables J. L., Nestler E. J. (2009) Neurotrophic factors and structural plasticity in addiction. Neuropharmacology 56, 73–82 [DOI] [PMC free article] [PubMed] [Google Scholar]
- 21. Dickstein D. L., Kabaso D., Rocher A. B., Luebke J. I., Wearne S. L., Hof P. R. (2007) Changes in the structural complexity of the aged brain. Aging Cell 6, 275–284 [DOI] [PMC free article] [PubMed] [Google Scholar]
- 22. Le Bé J. V., Markram H. (2006) Spontaneous and evoked synaptic rewiring in the neonatal neocortex. Proc. Natl. Acad. Sci. U.S.A. 103, 13214–13219 [DOI] [PMC free article] [PubMed] [Google Scholar]
- 23. Majewska A. K., Newton J. R., Sur M. (2006) Remodeling of synaptic structure in sensory cortical areas in vivo. J. Neurosci. 26, 3021–3029 [DOI] [PMC free article] [PubMed] [Google Scholar]
- 24. Parrish J. Z., Emoto K., Kim M. D., Jan Y. N. (2007) Mechanisms that regulate establishment, maintenance, and remodeling of dendritic fields. Annu. Rev. Neurosci. 30, 399–423 [DOI] [PubMed] [Google Scholar]
- 25. Pautot S., Wyart C., Isacoff E. Y. (2008) Colloid-guided assembly of oriented 3D neuronal networks. Nat. Methods 5, 735–740 [DOI] [PMC free article] [PubMed] [Google Scholar]
- 26. Fath T., Ke Y. D., Gunning P., Götz J., Ittner L. M. (2009) Primary support cultures of hippocampal and substantia nigra neurons. Nat. Protoc. 4, 78–85 [DOI] [PubMed] [Google Scholar]
- 27. Wayman G. A., Impey S., Marks D., Saneyoshi T., Grant W. F., Derkach V., Soderling T. R. (2006) Activity-dependent dendritic arborization mediated by CaM-kinase I activation and enhanced CREB-dependent transcription of Wnt-2. Neuron 50, 897–909 [DOI] [PubMed] [Google Scholar]
- 28. Schröder H., Becker A., Lössner B. (1993) Glutamate binding to brain membranes is increased in pentylenetetrazole-kindled rats. J. Neurochem. 60, 1007–1011 [DOI] [PubMed] [Google Scholar]
- 29. Becker A., Grecksch G. (1995) Flunarizine–its effect on pentylenetetrazole-kindled seizures and on related cognitive disturbances. Pharmacol. Biochem. Behav. 52, 765–769 [DOI] [PubMed] [Google Scholar]
- 30. Matsubara M., Kusubata M., Ishiguro K., Uchida T., Titani K., Taniguchi H. (1996) Site-specific phosphorylation of synapsin I by mitogen-activated protein kinase and CDK5 and its effects on physiological functions. J. Biol. Chem. 271, 21108–21113 [DOI] [PubMed] [Google Scholar]
- 31. Levy M., Faas G. C., Saggau P., Craigen W. J., Sweatt J. D. (2003) Mitochondrial regulation of synaptic plasticity in the hippocampus. J. Biol. Chem. 278, 17727–17734 [DOI] [PubMed] [Google Scholar]
- 32. Flood W. D., Moyer R. W., Tsykin A., Sutherland G. R., Koblar S. A. (2004) Nxf and Fbxo33. Novel seizure-responsive genes in mice. Eur. J. Neurosci. 20, 1819–1826 [DOI] [PubMed] [Google Scholar]
- 33. García-Pérez J., Avila J., Díaz-Nido J. (1999) Lithium induces morphological differentiation of mouse neuroblastoma cells. J. Neurosci. Res. 57, 261–270 [DOI] [PubMed] [Google Scholar]
- 34. Bykhovskaia M. (2011) Synapsin regulation of vesicle organization and functional pools. Semin. Cell Dev. Biol. 22, 387–392 [DOI] [PubMed] [Google Scholar]
- 35. Shupliakov O., Haucke V., Pechstein A. (2011) How synapsin I may cluster synaptic vesicles. Semin. Cell Dev. Biol. 22, 393–399 [DOI] [PubMed] [Google Scholar]
- 36. Fornasiero E. F., Bonanomi D., Benfenati F., Valtorta F. (2010) The role of synapsins in neuronal development. Cell. Mol. Life Sci. 67, 1383–1396 [DOI] [PMC free article] [PubMed] [Google Scholar]
- 37. Bonanomi D., Menegon A., Miccio A., Ferrari G., Corradi A., Kao H. T., Benfenati F., Valtorta F. (2005) Phosphorylation of synapsin I by cAMP-dependent protein kinase controls synaptic vesicle dynamics in developing neurons. J. Neurosci. 25, 7299–7308 [DOI] [PMC free article] [PubMed] [Google Scholar]
- 38. Kao H. T., Song H. J., Porton B., Ming G. L., Hoh J., Abraham M., Czernik A. J., Pieribone V. A., Poo M. M., Greengard P. (2002) A protein kinase A-dependent molecular switch in synapsins regulates neurite outgrowth. Nat. Neurosci. 5, 431–437 [DOI] [PubMed] [Google Scholar]
- 39. Nikolic M., Dudek H., Kwon Y. T., Ramos Y. F., Tsai L. H. (1996) The cdk5/p35 kinase is essential for neurite outgrowth during neuronal differentiation. Genes Dev. 10, 816–825 [DOI] [PubMed] [Google Scholar]
- 40. Cheung Z. H., Chin W. H., Chen Y., Ng Y. P., Ip N. Y. (2007) CDK5 is involved in BDNF-stimulated dendritic growth in hippocampal neurons. PLoS Biol. 5, e63. [DOI] [PMC free article] [PubMed] [Google Scholar]
- 41. Cheung Z. H., Ip N. Y. (2007) The roles of cyclin-dependent kinase 5 in dendrite and synapse development. Biotechnol. J. 2, 949–957 [DOI] [PubMed] [Google Scholar]
- 42. Wilczynski G. M., Konopacki F. A., Wilczek E., Lasiecka Z., Gorlewicz A., Michaluk P., Wawrzyniak M., Malinowska M., Okulski P., Kolodziej L. R., Konopka W., Duniec K., Mioduszewska B., Nikolaev E., Walczak A., Owczarek D., Gorecki D. C., Zuschratter W., Ottersen O. P., Kaczmarek L. (2008) Important role of matrix metalloproteinase 9 in epileptogenesis. J. Cell Biol. 180, 1021–1035 [DOI] [PMC free article] [PubMed] [Google Scholar]
- 43. Evangelopoulos M. E., Weis J., Krüttgen A. (2005) Signalling pathways leading to neuroblastoma differentiation after serum withdrawal. HDL blocks neuroblastoma differentiation by inhibition of EGFR. Oncogene 24, 3309–3318 [DOI] [PubMed] [Google Scholar]
- 44. Evangelopoulos M. E., Weis J., Krüttgen A. (2009) Mevastatin-induced neurite outgrowth of neuroblastoma cells via activation of EGFR. J. Neurosci. Res. 87, 2138–2144 [DOI] [PubMed] [Google Scholar]
- 45. Kim T. K., Hemberg M., Gray J. M., Costa A. M., Bear D. M., Wu J., Harmin D. A., Laptewicz M., Barbara-Haley K., Kuersten S., Markenscoff-Papadimitriou E., Kuhl D., Bito H., Worley P. F., Kreiman G., Greenberg M. E. (2010) Widespread transcription at neuronal activity-regulated enhancers. Nature 465, 182–187 [DOI] [PMC free article] [PubMed] [Google Scholar]
- 46. Soylemezoglu F., Onder S., Tezel G. G., Berker M. (2003) Neuronal nuclear antigen (NeuN). A new tool in the diagnosis of central neurocytoma. Pathol. Res. Pract. 199, 463–468 [DOI] [PubMed] [Google Scholar]
- 47. Kim K. K., Adelstein R. S., Kawamoto S. (2009) Identification of neuronal nuclei (NeuN) as Fox-3, a new member of the Fox-1 gene family of splicing factors. J. Biol. Chem. 284, 31052–31061 [DOI] [PMC free article] [PubMed] [Google Scholar]


