

Abstract
AIMS
To evaluate the effects of clopidogrel and itraconazole on the disposition of efavirenz and its hydroxyl metabolites in relation to the CYP2B6*6 genotype and explore potential phenotyping indices for CYP2B6 activity in vivo using a low dose of oral efavirenz.
METHODS
We conducted a randomized three phase crossover study in 17 healthy Korean subjects pre-genotyped for the CYP2B6*6 allele (CYP2B6*1/*1, n= 6; *1/*6, n= 6; *6/*6, n= 5). Subjects were pretreated with clopidogrel (75 mg day−1 for 4 days), itraconazole (200 mg day−1 for 6 days), or placebo and then given a single dose of efavirenz (200 mg). The plasma (0–120 h) and urine (0–24 h) concentrations of efavirenz and its metabolites (7- and 8-hydroxyefavirenz and 8,14-dihydroxyefavirenz) were determined by LC/MS/MS.
RESULTS
This study is the first to delineate quantitatively the full (phase I and II) metabolic profile of efavirenz and its three hydroxyl metabolites in humans. Clopidogrel pretreatment markedly decreased AUC(0,48 h), Cmax and Ae(0,24 h) for 8,14-dihydroxyefavirenz, compared with placebo; 95% CI of the ratios were 0.55, 0.73, 0.30, 0.45 and 0.25, 0.47, respectively. The 8,14-dihydroxyefavirenz : efavirenz AUC(0,120 h) ratio was significantly correlated with the weight-adjusted CL/F of efavirenz (r2≍ 0.4, P < 0.05), differed with CYP2B6*6 genotype and was affected by clopidogrel pretreatment (P < 0.05) but not by itraconazole pretreatment.
CONCLUSIONS
The disposition of 8,14-dihydroxy-EFV appears to be sensitive to CYP2B6 activity alterations in human subjects. The 8,14-dihydroxyefaviremz : efavirenz AUC(0,120 h) ratio is attractive as a candidate phenotyping index for CYP2B6 activity in vivo.
Keywords: clopidogrel, CYP2B6, drug–drug interaction, efavirenz, genetic polymorphism, phenotyping index
WHAT IS ALREADY KNOWN ABOUT THIS SUBJECT
Cytochrome P450 (CYP) 2B6 is the enzyme primarily responsible for the metabolism of many clinically important drugs, including efavirenz, which it converts to 8-hydroxyefavirenz and then to 8,14-hydroxyefavirenz.
The CYP2B6*6 polymorphism influences efavirenz pharmacokinetics, but a validated phenotyping method for predicting CYP2B6 activity in human subjects is not yet available.
The disposition of 8,14-dihydroxyefavirenz in humans in vivo is unknown.
WHAT THIS STUDY ADDS
This study is the first quantitative examination of 8,14-dihydroxyefavirenz pharmacokinetics in human subjects.
The 8,14-dihydroxyefavirenz : efavirenz AUC(0,120 h) ratio correlates with efavirenz oral clearance and is sensitive and specific to CYP2B6 activity alterations.
The 8,14-dihydroxyefavirenz : efavirenz AUC(0,120 h) ratio may be a useful phenotyping index for CYP2B6 activity in vivo.
Introduction
Research interest in cytochrome P450 (CYP) 2B6 has been greatly stimulated in recent years. CYP2B6 represents 3–6% of the total hepatic CYP protein content, with wide inter-individual variability [1–4]. It catalyzes the metabolism of a growing list of clinically important drugs, including nevirapine, cyclophosphamide, artemisinin, bupropion, methadone, propofol, selegiline, ketamine and efavirenz (EFV) [5, 6], a drug used as first line therapy against HIV. Several factors, including genetic polymorphisms and inhibitor and inducer exposure, contribute to the variable expression and activity of CYP2B6.
The CYP2B6 gene is highly polymorphic (http://www.cypalleles.ki.se/cyp2b6.htm). In particular, the CYP2B6*6 allele is defined by two non-synonymous single nucleotide polymorphisms, 516G>T (Q172H) and 785A>G (K262R). This allele is clinically important because its frequency differs greatly in different populations (from 12% in Koreans [7] to 62% in Papua New Guineans [8]) and because it is associated with significantly decreased in vitro metabolism of EFV and an increase in adverse effects of EFV in HIV patients [9, 10].
CYP2B6 activity is directly inhibited by numerous compounds [6, 11]. Clopidogrel, one of the most frequently prescribed medicines in the world, has been identified as a potent mechanism-based CYP2B6 inhibitor in vitro[12]. It also decreases CYP2B6-mediated hydroxylation of bupropion in healthy volunteers [13]. However, its inhibitory effects on the metabolism of other CYP2B6 substrates, such as EFV, are poorly understood, particularly for the lower activity CYP2B6 variants.
An important limitation in in vivo studies assessing CYP2B6-related drug–drug interactions and/or CYP2B6 genetic effects is the lack of a generally validated phenotyping drug. Consequently, none of the existing ‘cocktail’ methods for CYP450 phenotyping has included a CYP2B6 probe. As a well-known CYP2B6 substrate, EFV might serve as a probe drug if an in vivo phenotyping metric is identified. In humans, EFV is eliminated primarily through hepatic metabolism [14], predominantly (∼75%) through 8-hydroxylation catalyzed by CYP2B6 (with minor contributions by CYP3A and other enzymes in vitro) to 8-hydroxyefavirenz (8-OH-EFV). 8-OH-EFV appears to undergo secondary metabolism (catalyzed exclusively by CYP2B6 in vitro) to 8,14-dihydroxyefavirenz (8,14-OH-EFV) [15, 16]. Other metabolic routes resulting in 7-hydroxylation (7-OH-EFV) and N-glucuronidation represent the other 25% of EFV primary metabolism [16]. The proposed pathway for human metabolism of EFV is summarized in Figure 1.
Figure 1.
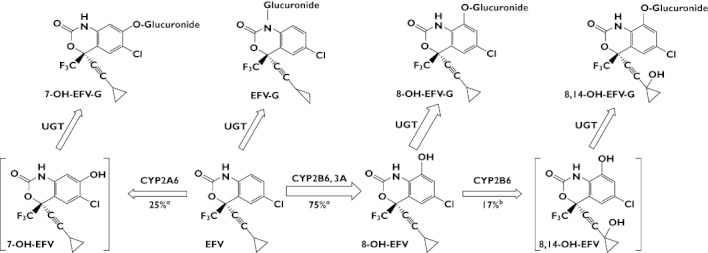
Proposed pathway for efavirenz (EFV) metabolism in humans. Arrow thickness represents the estimated relative contribution of each pathway to overall EFV metabolism. Metabolites in square brackets were not detected in our study. EFV(–G), EFV–glucuronide; 7-OH-EFV(–G), 7-hydroxyefavirenz–glucuronide; 8-OH-EFV(–G), 8-hydroxyefavirenz–glucuronide); 8,14-OH-EFV(–G), 8,14-hydroxyefavirenz–glucuronide. aEFV turnover rate (data from [16]). b8-OH-EFV turnover rate (data from [15])
The initial aim of the present study was to explore potential phenotyping indices for CYP2B6 in vivo activity using EFV as the probe drug. In accordance with the previously summarized validation criteria for phenotyping metrics (Table S1) [17], we designed a three phase crossover clinical trial with healthy subjects that enabled us to test multiple variables, such as drug–drug interactions and CYP2B6 genetic effects, in a single study with a low dose of oral EFV as the testing substrate. We also examined the pharmacokinetics of EFV and its metabolites to explore the metabolic metrics, which might reflect CYP2B6 enzyme activity. Drug–drug interactions were examined by pretreating the subjects with a potent CYP2B6 inhibitor (clopidogrel), a potent CYP3A inhibitor (itraconazole) or placebo before the EFV pharmacokinetics study. Genetic effects were examined by pre-genotyping CYP2B6*6 and recruiting equal numbers of subjects with each of the three genotypes (CYP2B6*1/*1, *1/*6, *6/*6). We hypothesized that we would find parameters and/or metabolic ratios derived from EFV disposition that were sensitive to both CYP2B6 inhibition and CYP2B6*6 genetic polymorphism but were not influenced by CYP3A inhibition.
Methods
Subjects
Genomic DNA samples from 374 Korean subjects were genotyped using the pyrosequencing method described by Rohrbacher et al. [18] for the two functionally important non-synonymous SNPs, G516T and A785G, that define the CYP2B6*9 (G516T), *4 (A785G) and *6 (G516T and A785G) alleles. Consistent with a previous report on the Korean population [7], the frequencies of the CYP2B6*9, *4, and *6 alleles in the 374 Korean subjects were 0.4%, 7.0% and 16.2%, respectively. The allelic frequencies were in Hardy–Weinberg equilibrium (χ2= 5.16, P= 0.27). Upon further study, the subjects with both 516GT and 785AG genotypes were confirmed to be CYP2B6*1/*6 but not *4/*9. From the 374 subjects, a total of 17 subjects (CYP2B6*1/*1, n= 6; CYP2B6*1/*6, n= 6; CYP2B6*6/*6, n= 5) were selected. Since gender appears to influence CYP2B6 expression in vitro and EFV disposition in vivo[3, 19], only male subjects were included.
Subjects were assessed using standard physical examinations, medical histories, and laboratory tests. Two weeks before and until the end of the entire clinical trial, subjects were required to abstain from all drugs and nutritional supplements and from tobacco, alcohol, caffeine and grapefruit juice. The study was approved by the Institutional Review Board of Inje University Busan Paik Hospital, Korea. Written informed consent was obtained from each volunteer. The study was conducted at the Clinical Trial Centre of Busan Paik Hospital.
Study design
The study was a three phase randomized crossover clinical trial. In the first phase, each subject was asked to take the pretreatment drug [clopidogrel (75 mg day−1 for 4 days), itraconazole (200 mg day−1 for 6 days) or placebo (for 6 days)]. On the last day of pretreatment, after an overnight fast, the subjects took their final dose of pretreatment drug at 08.00 h. One hour later, a single 200 mg dose of oral EFV was administered with 240 ml water. Blood samples (10 ml) were collected in tubes containing sodium heparin before and at 1, 2, 3, 4, 5, 6, 8, 10, 12, 24, 48, 72 and 120 h after EFV administration, and urine samples were collected from 0 to 24 h after EFV administration. For each urine sample, the volume was recorded and a 15 ml aliquot was saved. The plasma and urine samples were stored at −80°C until analysis. After an 8 week washout period, the above procedure was repeated with another pretreatment for the second and third phases.
Determination of EFV and EFV metabolite concentrations in plasma and urine
We determined the plasma and urine concentrations of EFV and its hydroxyl metabolites in both conjugated (glucuronidated) and unconjugated forms by liquid chromatography (LC)–tandem mass spectrometry (MS/MS). The concentrations of the conjugated forms were determined as follows. Briefly, 0.2 ml of plasma (or urine) sample was incubated with 2 ml of 0.2 m sodium acetate solution (pH 5.0) containing 1000 U of β-glucuronidase from Helix pomatia at 37°C for 1 h. The samples were then spiked with 20 µl of simvastatin (5 µg ml−1) as an internal standard, alkalinized with 1 ml of 0.1 m sodium carbonate buffer (pH 9.4) and extracted with 3 ml of ethyl acetate. After centrifugation (3000 rev min−1, 10 min), the organic phase was evaporated to dryness at ambient temperature in a Speed-Vac (Savant, Holbrook, NY, USA). The resulting residue was reconstituted in 0.1 ml of mobile phase [water : acetonitrile 2:8 (v/v)] and 80 µl of the solution was injected into an Agilent LC/MS/MS system (Agilent Technologies, Santa Clara, USA) equipped with an Agilent 1100 series high performance LC system (Agilent, Wilmington, DE, USA).
Chromatographic separation of the compounds was accomplished using a Luna C18 column (2.0 × 100 mm, 3 µm; Phenomenex, Torrance, CA) and a mobile phase consisting of water and acetonitrile [2:8 (v/v)] delivered at a flow rate of 0.2 ml min−1. The MS negative mode was chosen. For EFV, 7-, 8- and 8,14-OH-EFV and simvastatin, the precursor-to-product ion reactions monitored, had mass-to-charge ratios of 314/244, 330/286, 331/258, 346/262 and 435/319, respectively. The lower limit of quantification (LLOQ) for EFV was 10 ng ml−1 and for the EFV metabolites, the LLOQ was 5 ng ml−1. The inter-assay variation for all of the samples was less than 20% (except at the lowest concentration of 8,14-OH-EFV, for which the variation was 23.5%). Each sample was analyzed in triplicate. The unconjugated compounds were assayed using the same procedure as that for conjugated compounds, except that the incubation step with β-glucuronidase was omitted.
Pharmacokinetics analysis
The maximum plasma concentration (Cmax) was derived directly from the plasma concentration vs. time data. The area under the concentration–time curve (AUC), half-life (t1/2) and apparent oral clearance (CL/F) were estimated using the non-compartmental method of Winnonlin software (version 4.1, Pharsight, Mountain View, CA, USA).
Metabolic ratios
All possible combinations of metabolic ratios (e.g. metabolite : EFV) in plasma and urine were calculated using the AUC or concentration value (e.g. concentration at 48 h, C48). A molar ratio was used to calculate (8-OH-EFV + 8,14-OH-EFV) : EFV.
Statistical analysis
Gene–dose effects among the three genotypes in the same phase were tested using the Jonckheere–Terpstra test. Pharmacokinetic parameters were compared among the three genotypes in the same phase using the Kruskal–Wallis test and were compared between the two pretreatments in all subjects using the Wilcoxon signed-rank test. The Pearson correlation and r2 value were used to describe the degree of association of the two variables. SPSS (version 17.0, SPSS Inc, USA) software was used for the statistical analysis. Differences were considered statistically significant at P < 0.05.
Results
Determination of EFV, its hydroxyl metabolites and the conjugated forms in plasma
In the absence of the deconjugation procedure, EFV and 8-OH-EFV were detected but 7-OH-EFV and 8,14-OH-EFV were not. Deconjugation allowed detection of all four compounds. The EFV concentration was similar with and without deconjugation and the 8-OH-EFV concentration was near or below the LLOQ without deconjugation. Upon visual inspection, the concentration–time curves for all metabolites were in parallel with EFV (Figure 2). In the clopidogrel phase, the 8,14-OH-EFV concentration–time curves for all subjects had two peaks, with the second peak appearing ∼48 h after EFV administration.
Figure 2.
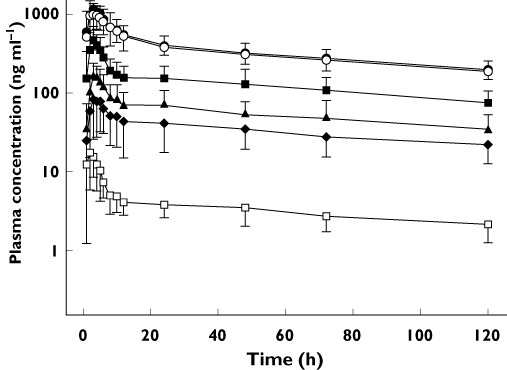
Plasma concentration–time curves for unconjugated EFV ( ), total (unconjugated + conjugated) EFV (
 ), unconjugated 8-hydroxy- EFV (
 ), total 8-hydroxy-EFV (
 ), 8,14-dihydroxy-EFV (
 ) and 7-hydroxy-EFV (
 ) after administration of a single 200 mg dose of oral efavirenz in 17 healthy subjects in the placebo phase. Data points represent mean ± SD
Effects of clopidogrel and itraconazole pretreatment and CYP2B6*6 genotype on the pharmacokinetics of EFV and its hydroxyl metabolites
Subject characteristics were similar among the three genotypes (Table S2). Three subjects (two in the placebo and one in the clopidogrel phase, two CYP2B6*6 and one CYP2B6*1/*1), complained of minor headache and dizziness. No subjects dropped out of the study due to adverse effects.
The pharmacokinetic parameters of EFV and its metabolites are displayed in Tables 1A and B. The systemic exposure parameters (AUC and Cmax) of EFV and 7-OH-EFV and the AUC of 8-OH-EFV were significantly higher in the clopidogrel phase than in the placebo phase (n= 17, P < 0.05). On the other hand, the Cmax, AUC(0,120 h) and AUC(0,48 h) of 8,14-OH-EFV were significantly lower in the clopidogrel phase than in the placebo phase. The placebo : clopidogrel phase ratio for Cmax, AUC(0,120 h) and AUC(0,48 h) of 8,14-OH-EFV were [shown as means (95% CI)] 0.37 (0.30, 0.45), 0.80 (0.71, 0.90) and 0.60 (0.55, 0.73), respectively (Table 1A, Figure 3). In the itraconazole phase, the only significant difference in the pharmacokinetic parameters for any of the compounds, relative to placebo, was a slight increase in the AUC(0,120 h) of 8-OH-EFV (P < 0.05, Table 1B).
Table 1A.
Pharmacokinetic parameters of efavirenz and its hydroxyl metabolites in plasma: comparison between placebo and clopidogrel pretreatment phases
| Placebo | Clopidogrel | ||||||||
|---|---|---|---|---|---|---|---|---|---|
| *1/*1 | *1/*6 | *6/*6 | Total | *1/*1 | *1/*6 | *6/*6 | Total | ||
| CYP2B6*6 genotype | (n= 6) | (n= 6) | (n= 5) | (n= 17) | (n= 6) | (n= 6) | (n= 5) | (n= 17) | Mean ratio‡(95% CI) |
| EFV | |||||||||
| AUC(0,120 h) (µg ml−1 h) | 36.0 ± 7.8 | 41.6 ± 9.0 | 46.6 ± 11.4 | 41.4 ± 9.5 | 40.0 ± 6.4 | 48.0 ± 9.5 | 55.5 ± 8.0 | 47.9 ± 9.5§ | 1.16 (1.09, 1.23)*** |
| AUC(0,∞) (µg ml−1 h) | 60.2 ± 18.0 | 66.1 ± 14.4 | 80.6 ± 13.1 | 68.8 ± 16.6§ | 62.9 ± 8.3 | 77.5 ± 13.6 | 101.7 ± 15.0 | 80.5 ± 20.0§ | 1.17 (1.05, 1.31)* |
| Cmax (ng ml−1) | 1312.5 ± 611.8 | 1471.2 ± 419.9 | 1602.2 ± 549.3 | 1462.5 ± 503.1 | 1738.9 ± 638.2 | 1747.2 ± 262.1 | 2208.8 ± 660.8 | 1888.9 ± 545.5 | 1.31 (1.11, 1.57)*** |
| Ae(0,24 h) (mg) | N.D. | N.D. | |||||||
| 8-OH-EFV | |||||||||
| AUC(0,120 h) (µg ml−1 h) | 14.8 ± 3.9 | 18.2 ± 8.1 | 12.3 ± 5.0 | 15.2 ± 6.1 | 19.7 ± 5.8 | 19.2 ± 3.6 | 14.1 ± 4.8 | 17.8 ± 5.2 | 1.21 (1.08, 1.34)* |
| AUC(0,∞) (µg ml−1 h) | 22.7 ± 6.3 | 26.5 ± 11.5 | 20.8 ± 6.4 | 23.5 ± 8.5 | 29.4 ± 9.5 | 29.1 ± 8.1 | 22.2 ± 6.7 | 27.2 ± 8.4 | 1.15 (1.01, 1.31)* |
| Cmax (ng ml−1) | 468.9 ± 208.7 | 635.6 ± 188.1 | 464.9 ± 180.8 | 526.5 ± 199.4 | 453.1 ± 130.9 | 490.0 ± 80.7 | 479.0 ± 215.3 | 473.7 ± 138.7 | 0.93 (0.79, 1.09) |
| Ae(0,24 h) (mg) | 7.2 ± 2.7 | 7.6 ± 1.7 | 5.4 ± 1.9 | 6.7 ± 2.2 | 7.1 ± 4.3 | 5.4 ± 1.8 | 4.7 ± 1.7 | 5.8 ± 2.9 | 0.82 (0.65, 1.04) |
| 7-OH-EFV | |||||||||
| AUC(0,120 h) (µg ml−1 h) | 3.5 ± 0.9 | 4.7 ± 2.5 | 3.7 ± 1.7 | 3.5 ± 0.9 | 4.2 ± 1.5 | 5.8 ± 2.8 | 3.7 ± 0.6 | 4.7 ± 2.5 | 1.16 (1.02, 1.32)* |
| AUC(0,∞) (µg ml−1 h) | 6.8 ± 2.5 | 8.0 ± 3.1 | 6.1 ± 2.2 | 6.8 ± 2.5 | 7.5 ± 2.8 | 10.3 ± 3.8 | 7.0 ± 0.7 | 8.0 ± 3.1 | 1.20 (1.05, 1.39)* |
| Cmax (ng ml−1) | 80.1 ± 28.5 | 112.1 ± 66.1 | 84.3 ± 62.2 | 92.6 ± 53.0 | 98.7 ± 25.7 | 138.2 ± 64.4 | 100.2 ± 28.5 | 113.1 ± 45.5 | 1.28 (1.02, 1.60)* |
| Ae(0,24 h) (mg) | 1.5 ± 0.5 | 2.0 ± 1.9 | 1.3 ± 0.5 | 1.6 ± 1.2 | 1.5 ± 1.0 | 1.6 ± 1.0 | 1.1 ± 0.5 | 1.4 ± 0.8 | 0.91 (0.72, 1.13) |
| 8,14-OH-EFV | |||||||||
| AUC(0,120 h) (µg ml−1 h) | 5.9 ± 1.6 | 6.6 ± 1.5 | 5.4 ± 1.6 | 6.6 ± 3.3 | 5.3 ± 1.9 | 5.3 ± 1.5 | 4.0 ± 1.5 | 5.3 ± 2.5 | 0.80 (0.71, 0.90)** |
| AUC(0,48 h) (µg ml−1 h) | 3.1 ± 1.0 | 4.3 ± 2.1 | 2.9 ± 1.0 | 3.5 ± 1.6 | 2.1 ± 0.8 | 2.5 ± 0.7 | 1.7 ± 0.5 | 2.1 ± 0.7 | 0.60 (0.55, 0.73)*** |
| Cmax (ng ml−1) | 160.9 ± 65.0 | 222.8 ± 81.6 | 160.9 ± 69.3 | 182.7 ± 74.4 | 58.4 ± 15.8 | 76.2 ± 35.8 | 61.1 ± 18.7 | 65.5 ± 25.2 | 0.37 (0.30, 0.45)*** |
| Ae(0,24 h) (mg) | 3.4 ± 1.0 | 4.1 ± 0.9 | 2.7 ± 0.8 | 3.4 ± 1.0 | 1.4 ± 0.8 | 1.7 ± 1.3 | 1.0 ± 0.7 | 1.4 ± 1.0 | 0.34 (0.25, 0.47)*** |
Table 1B.
Pharmacokinetic parameters of efavirenz and its hydroxyl metabolites in plasma: comparison between placebo and itraconazole pretreatment phases
| Placebo | Clopidogrel | ||||||||
|---|---|---|---|---|---|---|---|---|---|
| *1/*1 | *1/*6 | *6/*6 | Total | *1/*1 | *1/*6 | *6/*6 | Total | ||
| CYP2B6*6 genotype | (n= 6) | (n= 6) | (n= 5) | (n= 17) | (n= 6) | (n= 6) | (n= 5) | (n= 17) | Mean ratio‡(95% CI) |
| EFV | |||||||||
| AUC(0,120 h) (µg ml−1 h) | 36.0 ± 7.8 | 41.6 ± 9.0 | 46.6 ± 11.4 | 41.4 ± 9.5 | 36.3 ± 5.9 | 41.6 ± 9.6 | 49.2 ± 8.5 | 41.8 ± 9.6‡§ | 1.01 (0.95, 1.08) |
| AUC(0,∞) (µg ml−1 h) | 60.2 ± 18.0 | 66.1 ± 14.4 | 80.6 ± 13.1 | 68.8 ± 16.6§ | 64.7 ± 15.1 | 67.3 ± 16.5 | 89.8 ± 17.1 | 71.8 ± 18.8‡§ | 1.04 (0.93, 1.16) |
| Cmax (ng ml−1) | 1312.5 ± 611.8 | 1471.2 ± 419.9 | 1602.2 ± 549.3 | 1462.5 ± 503.1 | 1116.9 ± 407.0 | 1410.7 ± 665.3 | 1714.2 ± 579.9 | 1413.7 ± 583.8 | 0.94 (0.75, 1.19) |
| Ae(0,24 h) (mg) | N.D. | N.D. | |||||||
| 8-OH-EFV | |||||||||
| AUC(0,120 h) (µg ml−1 h) | 14.8 ± 3.9 | 18.2 ± 8.1 | 12.3 ± 5.0 | 15.2 ± 6.1 | 17.3 ± 4.0 | 18.4 ± 4.8 | 14.4 ± 4.8 | 16.9 ± 4.7 | 1.15 (1.03, 1.28)* |
| AUC(0,∞) (µg ml−1 h) | 22.7 ± 6.3 | 26.5 ± 11.5 | 20.8 ± 6.4 | 23.5 ± 8.5 | 24.9 ± 5.6 | 26.9 ± 9.4 | 25.6 ± 9.3 | 25.9 ± 7.9 | 1.12 (0.96, 1.30) |
| Cmax (ng ml−1) | 468.9 ± 208.7 | 635.6 ± 188.1 | 464.9 ± 180.8 | 526.5 ± 199.4 | 482.7 ± 121.6 | 590.2 ± 232.6 | 508.7 ± 320.0 | 528.3 ± 222.4 | 0.99 (0.80, 1.23) |
| Ae(0,24 h) (mg) | 7.2 ± 2.7 | 7.6 ± 1.7 | 5.4 ± 1.9 | 6.7 ± 2.2 | 6.1 ± 2.0 | 6.1 ± 2.1 | 6.5 ± 2.6 | 6.2 ± 2.1 | 0.93 (0.74, 1.16) |
| 7-OH-EFV | |||||||||
| AUC(0,120 h) (µg ml−1 h) | 3.5 ± 0.9 | 4.7 ± 2.5 | 3.7 ± 1.7 | 3.5 ± 0.9 | 3.8 ± 1.4 | 5.1 ± 2.4 | 4.0 ± 2.1 | 3.7 ± 1.7 | 1.06 (0.97, 1.16) |
| AUC(0,∞) (µg ml−1 h) | 6.8 ± 2.5 | 8.0 ± 3.1 | 6.1 ± 2.2 | 6.8 ± 2.5 | 6.3 ± 2.8 | 9.3 ± 3.3 | 8.1 ± 2.7 | 6.1 ± 2.2 | 1.04 (0.92, 1.17) |
| Cmax (ng ml−1) | 80.1 ± 28.5 | 112.1 ± 66.1 | 84.3 ± 62.2 | 92.6 ± 53.0 | 82.3 ± 22.1 | 114.7 ± 92.3 | 103.7 ± 86.9 | 100.0 ± 70.0 | 1.03 (0.84, 1.25) |
| Ae(0,24 h) (mg) | 1.5 ± 0.5 | 2.0 ± 1.9 | 1.3 ± 0.5 | 1.6 ± 1.2 | 1.4 ± 0.6 | 1.4 ± 1.1 | 1.6 ± 0.8 | 1.5 ± 0.8 | 0.89 (0.71, 1.13) |
| 8,14-OH-EFV | |||||||||
| AUC(0,120 h) (µg ml−1 h) | 5.9 ± 1.6 | 6.6 ± 1.5 | 5.4 ± 1.6 | 6.6 ± 3.3 | 6.3 ± 1.6 | 7.2 ± 1.6 | 5.6 ± 2.0 | 6.6 ± 2.3 | 1.05 (0.98, 1.12) |
| AUC(0,48 h) (µg ml−1 h) | 3.1 ± 1.0 | 4.3 ± 2.1 | 2.9 ± 1.0 | 3.5 ± 1.6 | 3.2 ± 0.9 | 4.2 ± 1.3 | 2.9 ± 1.1 | 3.4 ± 1.2 | 0.97 (0.88, 1.18) |
| Cmax (ng ml−1) | 160.9 ± 65.0 | 222.8 ± 81.6 | 160.9 ± 69.3 | 182.7 ± 74.4 | 132.4 ± 33.2 | 196.1 ± 45.9 | 133.6 ± 49.7 | 155.2 ± 50.9 | 0.87 (0.72, 1.06) |
| Ae(0,24 h) (mg) | 3.4 ± 1.0 | 4.1 ± 0.9 | 2.7 ± 0.8 | 3.4 ± 1.0 | 2.8 ± 1.3 | 3.1 ± 1.7 | 3.1 ± 1.0 | 3.0 ± 1.3 | 0.91 (0.68, 1.21) |
Data are presented as means ± SD. N.D., not determined. †P < 0.05, significant difference among genotypes (Kruskal–Wallis test). ‡Mean ratio (95% CI) of pretreatment phase : placebo phase parameters. §P < 0.05, significant gene–dose effect (Jonckheere–Terpstra test). *P < 0.05, **P < 0.01, ***P < 0.001 compared with placebo phase (Wilcoxon signed-rank test).
Figure 3.
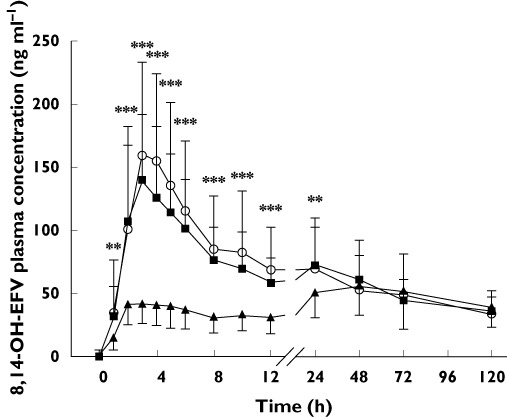
Comparison of concentration–time curves for conjugated 8,14-dihydroxy- EFV (8,14-OH-EFV) in the placebo ( ), clopidogrel (
 ) and itraconazole (
 ) phases in 17 subjects after administration of a single 200 mg dose of oral efavirenz. Data points represent mean ± SD. *P < 0.01, **P < 0.001 compared with the placebo phase, as determined using the Wilcoxon signed-rank test
CYP2B6*6 gene–dose effects were seen for EFV AUC(0,∞) in all phases and for EFV AUC(0,120 h) in pretreatment phases, but not for any of the other parameters (P < 0.05, Tables 1A and B). Comparisons among the three genotypes revealed no statistically significant differences among genotypes in the placebo phase, significant differences in AUC(0,120 h) and AUC(0,∞) among genotypes in the clopidogrel phase (P < 0.05) and a marginal difference in AUC(0,∞) among genotypes in the itraconazole phase (P= 0.06).
Effects of clopidogrel and itraconazole on 24 h urinary excretion of EFV and its hydroxyl metabolites
The concentrations of EFV and its conjugated form in 24 h urine samples were below the LLOQ (10 ng ml−1) in all phases. The three EFV metabolites were present at negligible concentrations in the absence of deconjugation but were several hundred times more abundant after deconjugation. In the placebo phase, the total amount of the three metabolites in the 24 h urine samples accounted for ∼5% of the 200 mg dose of EFV (data not shown). The clopidogrel : placebo phase ratio for 8,14-OH-EFV in 24 h urine samples was only 0.34 (95% CI 0.25, 0.47), but the corresponding phase ratios for 7- and 8-OH-EFV were near unity (Table 1A). Pretreatment with itraconazole had no impact on 24 h urinary excretion of the metabolites (Table 1B).
EFV metabolic ratios and their relation to CYP2B6*6 genotypes, pretreatments and EFV weight-adjusted CL/F
Metabolic ratios that differed significantly among the genotypes or with pretreatment or that correlated with the weight-adjusted CL/F for EFV are shown in Table 2. The 8,14-OH-EFV : 8-OH-EFV AUC(0,120 h) ratio and the 8,14-OH-EFV : EFV AUC(0,120 h) and C48 ratios decreased significantly with clopidogrel pretreatment (P < 0.001 vs. placebo) but not with itraconazole pretreatment. The 8-OH-EFV : EFV, (8-OH-EFV + 8,14-OH-EFV) : EFV and 8,14-OH-EFV : EFV AUC(0,120 h) ratios and the 8,14-OH-EFV : EFV C48 ratio differed significantly among the three genotypes in a gene–dose-dependent manner in all phases (P < 0.05), with one exception: the 8-OH-EFV : EFV AUC(0,120 h) ratio did not differ significantly among genotypes in the placebo phase (P= 0.08). These three AUC(0,120 h) ratios were also significantly correlated with the EFV weight-adjusted CL/F in each phase, with r2 ranging from 0.22–0.51 (P < 0.05), with the exception of the 8-OH-EFV : EFV ratio in the itraconazole phase (P= 0.07).
Table 2.
Comparison of metabolic ratios of efavirenz among three CYP2B6 genotypes after each pretreatment, or between different pretreatments in all 17 subjects, and their correlations with efavirenz CL/F after each pretreatment
| CYP2B6 *1/*1 | CYP2B6 *1/*6 | CYP2B6 *6/*6 | Correlation | |||||
|---|---|---|---|---|---|---|---|---|
| Total (n= 17) | (n= 6) | (n= 6) | (n= 5) | Pa | Pb | r2 | Pc | |
| AUC(0,120 h) 8,14-OH : 8-OH | ||||||||
| Placebo | 0.45 ± 0.09 | 0.45 ± 0.10 | 0.44 ± 0.06 | 0.47 ± 0.11 | 0.89 | 0.75 | 0.01 | 0.91 |
| Clopidogrel | 0.29 ± 0.07** | 0.29 ± 0.06 | 0.28 ± 0.04 | 0.29 ± 0.11 | 0.70 | 0.37 | 0.10 | 0.28 |
| Itraconazole | 0.40 ± 0.08 | 0.39 ± 0.06 | 0.41 ± 0.07 | 0.39 ± 0.10 | 0.70 | 0.71 | 0.05 | 0.22 |
| AUC(0,120 h) 8-OH : EFV | ||||||||
| Placebo | 0.35 ± 0.10 | 0.41 ± 0.11 | 0.37 ± 0.08 | 0.26 ± 0.07 | 0.08 | 0.04 | 0.30 | 0.04 |
| Clopidogrel | 0.38 ± 0.13 | 0.48 ± 0.12 | 0.40 ± 0.07 | 0.25 ± 0.09 | 0.01 | 0.01 | 0.49 | 0.01 |
| Itraconazole | 0.41 ± 0.12 | 0.49 ± 0.12 | 0.45 ± 0.09 | 0.29 ± 0.06 | 0.02 | 0.01 | 0.22 | 0.07 |
| AUC(0,120 h) (8-OH + 8,14-OH) : EFV | ||||||||
| Placebo | 0.47 ± 0.13 | 0.55 ± 0.13 | 0.50 ± 0.09 | 0.35 ± 0.08 | 0.02 | 0.01 | 0.35 | 0.02 |
| Clopidogrel | 0.45 ± 0.15 | 0.58 ± 0.13 | 0.45 ± 0.08 | 0.31 ± 0.09 | 0.01 | 0.01 | 0.51 | 0.01 |
| Itraconazole | 0.52 ± 0.15 | 0.63 ± 0.15 | 0.55 ± 0.07 | 0.37 ± 0.07 | 0.01 | 0.01 | 0.30 | 0.03 |
| AUC(0,120 h) 8,14-OH : EFV | ||||||||
| Placebo | 0.15 ± 0.04 | 0.18 ± 0.04 | 0.16 ± 0.02 | 0.12 ± 0.02 | 0.01 | 0.01 | 0.39 | 0.01 |
| Clopidogrel | 0.11 ± 0.04** | 0.14 ± 0.03 | 0.11 ± 0.01 | 0.07 ± 0.02 | 0.01 | 0.01 | 0.33 | 0.03 |
| Itraconazole | 0.16 ± 0.05 | 0.19 ± 0.05 | 0.17 ± 0.02 | 0.11 ± 0.02 | 0.01 | 0.01 | 0.43 | 0.01 |
| C48 8,14-OH : EFV | ||||||||
| Placebo | 0.16 ± 0.05 | 0.18 ± 0.06 | 0.18 ± 0.03 | 0.11 ± 0.02 | 0.03 | 0.03 | 0.08 | 0.29 |
| Clopidogrel | 0.11 ± 0.04** | 0.12 ± 0.04 | 0.13 ± 0.04 | 0.08 ± 0.02 | 0.04 | 0.03 | 0.22 | 0.08 |
| Itraconazole | 0.17 ± 0.06 | 0.21 ± 0.05 | 0.17 ± 0.05 | 0.11 ± 0.03 | 0.02 | 0.01 | 0.37 | 0.02 |
Data are presented as means ± SD.
P value for significance of differences among genotypes, obtained by Kruskal–Wallis test.
P value for significance of gene–dose effect, obtained by Jonckheere–Terpstra test.
P value for significance of correlation with weight-adjusted CL/F of efavirenz, obtained by Pearson correlation test.
AUC(0,120 h), area under the curve from 0 to 120 h after efavirenz administration; C48, plasma concentration at 48 h after efavirenz administration; EFV, efavirenz; 8-OH, 8-hydroxyefavirenz; 8,14-OH, 8,14-dihydroxyefavirenz.
P < 0.01 compared with placebo phase (Wilcoxon signed-rank test).
Discussion
In this study, we presumed that a careful analysis of the overall metabolic profile of a CYP substrate under various pre-established conditions that influence CYP activity, such as inactivating mutations or drug-induced inhibition, might yield metabolic metrics sensitive to CYP enzyme alterations. Our findings suggest that EFV may be a suitable phenotypic probe drug for CYP2B6 activity.
We first evaluated the relative contributions of phase I and phase II enzymes in EFV metabolism in vivo by measuring both the total and unconjugated concentrations of EFV and its hydroxyl metabolites. The difference in the concentrations of unconjugated and total EFV was negligible, indicating that nearly all of the EFV was unconjugated, whereas the hydroxyl metabolites were found predominantly in their conjugated forms, consistent with previous studies [14, 20, 21]. These findings suggest that although the conventional measurement of unconjugated EFV appears sufficient in clinical practice, the concentration of the conjugated EFV metabolites must be measured if the phase I metabolism of EFV is to be accurately studied, because the unconjugated metabolites alone cannot reflect the actual rate-limiting phase I metabolism.
Clopidogrel pretreatment only modestly increased the exposure parameters (AUC and Cmax) for EFV and 7-OH-EFV (P < 0.05, n= 17). One likely reason for this less than expected inhibition of EFV metabolism is that the pre-inactivated CYP2B6 recovered its activity during the long (120 h) sampling time. This recovery probably would not occur if the inhibition was maintained throughout the trial [22]. Interestingly, the 8,14-OH-EFV concentration–time curve in the clopidogrel phase developed a second peak at ∼48 h after EFV administration in all subjects, possibly due to the recovery of CYP2B6 activity. This phenomenon would be similar to that described previously for CYP3A4 [22]. In addition, not all EFV is metabolized through 8-hydroxylation. Therefore, the increase in 7-OH-EFV in our study might reflect a shift toward 7-hydroxylation (by CYP2A6) induced by inhibition of 8-hydroxylation, as previously suggested [23]. This shift would keep EFV metabolism from decreasing dramatically in the presence of inhibitors of 8-hydroxylation.
Both the formation of 8-OH-EFV via 8-hydroxylation and its elimination via 14-hydroxylation are mediated by CYP2B6. However, other enzymes appear to be able to mediate the 8-hydroxylation step (but not the 14-hydroxylation step) [14, 15]. If the latter step were thus more susceptible to clopidogrel inhibition, the 8-OH-EFV AUC would increase with clopidogrel, as seen in our study. Interestingly, clopidogrel dramatically decreased the systemic exposure to 8,14-OH-EFV, as reflected by plasma and 24 h urine samples, probably because the effects of 8- and 14-hydroxylation were synergistic. The inhibition of consecutive steps in a metabolic pathway can lead to a near-complete disruption of the pathway [24]. On the other hand, itraconazole, a potent inhibitor of CYP3A and P-glycoprotein, did not alter the concentrations of EFV or its metabolites. Although a recent study identified itraconazole as a CYP2B6 inhibitor in vitro, any clinically meaningful CYP2B6 drug interaction was excluded by its relatively high Ki value and its low free portal concentration [I][25].
A CYP2B6*6 gene–dose effect was seen for EFV AUC(0,∞) in all phases and for EFV AUC(0,120 h) in the pretreatment phases (P < 0.05), but the pharmacokinetic parameters did not differ significantly among the genotypes in the placebo phase. A previously reported single-dose study in which 600 mg EFV was administered to 121 Ugandans showed similar results [26]. The results of both that study and the present study suggest that the essential CYP2B6*6 genetic effect is modest. In contrast, in a multiple dose study, EFV systemic exposure was at least three times as high in CYP2B6*6/*6 subjects as in CYP2B6*1/*1 subjects [9, 27]. The administration of multiple doses of EFV induces EFV metabolism and this auto-induction is more pronounced in CYP2B6*1/*1 patients [28]. Thus, genetic effects are heightened in multiple dose regimens. We recently found that CYP2B6*6 is more susceptible than CYP2B6*1 to inhibition by clopidogrel or voriconazole in vitro[29]. This finding is consistent with our present results demonstrating more significant genetic effects in the clopidogrel (P < 0.05) and itraconazole (marginally significant, P= 0.06) phases than in the placebo phase.
We next examined EFV plasma and urine metabolic ratios as potential phenotyping indices for CYP2B6 activity. A phenotyping index that accurately reflects in vivo enzyme activity will correlate well with the enzyme intrinsic clearance, or more practically, with the oral clearance of a drug that is extensively and predominantly metabolized by that enzyme [30]. The drug frequently used as a CYP2B6 phenotyping probe, bupropion, is imperfect since the CYP2B6-mediated hydroxylation of bupropion represents a minor pathway and, thus, does not accurately reflect CYP2B6 activity alterations [31, 32]. In several in vivo studies, the concentration ratio of 8-OH-EFV : EFV has been used to evaluate EFV treatment or its auto-induction [28, 33]. This ratio was found inappropriate for our study. The AUC(0,120 h) ratios of 8-OH-EFV : EFV and 8,14-OH-EFV : 8-OH-EFV did not meet the index criteria either. Apparently, ratios including 8-OH-EFV, the intermediate metabolite, are less suitable because the effect of CYP2B6 activity alteration on 8-OH-EFV remains uncertain. Thus, we rejected these ratios as candidate indices.
Our results suggest that the more suitable biomarker for CYP2B6 activity in humans in vivo is 8,14-OH-EFV, a little-researched secondary metabolite of EFV. The 8,14-OH-EFV : EFV AUC(0,120 h) ratio meets the validation criteria for phenotyping metrics, as it is markedly affected by CYP2B6*6 genotype in a gene-dosage-dependent manner and by the CYP2B6 inhibitor clopidogrel, but not by the CYP3A inhibitor itraconazole. Moreover, we observed a significant correlation between this ratio and the EFV weight-adjusted CL/F, although the r2 value (∼0.4) was relatively low, possibly because of the small sample size. However, use of this metabolic ratio requires multiple samplings over 120 h, and thus it might be impractical for use in population studies. Nonetheless, it remains an attractive candidate phenotyping index for clinical trials with small sample sizes. Two other ratios, the (8-OH-EFV + 8,14-OH-EFV) : EFV AUC(0,120 h) ratio and the 8,14-OH-EFV : EFV C48 ratio, are good potential candidates but need further validation. In particular, a single time–concentration ratio data point would provide a much simpler phenotyping procedure.
Notably, the reliability, safety and utility criteria for a phenotyping drug are met by EFV. Since the CL/F of a single dose EFV is dose- or time-independent (Sustiva® package insert), we consider it to be reliable. The low EFV dose used was well tolerated among the subjects. Besides, decreasing the dose might increase the selectivity toward CYP2B6, as CYP2B6 often acts as a high affinity, low capacity enzyme in drug metabolism [15]. Recently, 7-hydroxylation of EFV was proposed as an in vivo probe for CYP2A6 [16]. Therefore, EFV might serve as a dual probe for CYP2B6 and CYP2A6 activity once validated in future studies.
There are several limitations in this study: (1) the small sample size required a limited number of variables to be included. Thus, female gender and other CYP2B6 genetic polymorphisms were not tested, (2) the inhibitory effects probably declined throughout the 120 h sampling time. Therefore, the EFV CL/F we obtained from the inhibition phases should be regarded as a general estimate that does not reflect the actual CL/F at any particular time point and (3) as CYP2B6 is known for its substrate specificity, EFV might not be useful as an indicator of CYP2B6 activity towards other substrates.
In this first reported study of the quantitative disposition of EFV in humans, 8,14-OH-EFV was identified as a more sensitive indicator of CYP2B6 activity than either EFV or 8-OH-EFV. The 8,14-OH-EFV : EFV AUC(0,120 h) metabolic ratio is an attractive candidate phenotyping index for CYP2B6 in vivo activity. Further studies are needed to confirm this finding in different populations with larger sample sizes, to test other co-medication regimens and to compare EFV with other CYP2B6 substrates.
Acknowledgments
This work was supported by the Korea Health 21 R&D project of the Ministry of Health & Welfare (02-PJ2-PG6-DC04-0001) of the Republic of Korea and by the National Institute of General Medical Sciences grant (1R01GM078501-01A1) of the National Institutes of Health (Bethesda, MD, USA).
Competing Interests
There are no competing interests to declare.
Supporting Information
Additional Supporting Information may be found in the online version of this article:
Table S1. Validation criteria for phenotyping metrics. Further desirable properties of phenotyping metrics.
Table S2. Demographics of study subjects,grouped according to CYP2B6*6 genotype. Data arepresented as means ± SD. aP values amongthe three genotypes were determined using the Kruskal–Wallistest. BMI, body mass index.
REFERENCES
- 1.Stresser DM, Kupfer D. Monospecific antipeptide antibody to cytochrome P-450 2B6. Drug Metab Dispos. 1999;27:517–25. [PubMed] [Google Scholar]
- 2.Lang T, Klein K, Fischer J, Nussler AK, Neuhaus P, Hofmann U, Eichelbaum M, Schwab M, Zanger UM. Extensive genetic polymorphism in the human CYP2B6 gene with impact on expression and function in human liver. Pharmacogenetics. 2001;11:399–415. doi: 10.1097/00008571-200107000-00004. [DOI] [PubMed] [Google Scholar]
- 3.Lamba V, Lamba J, Yasuda K, Strom S, Davila J, Hancock ML, Fackenthal JD, Rogan PK, Ring B, Wrighton SA, Schuetz EG. Hepatic CYP2B6 expression: gender and ethnic differences and relationship to CYP2B6 genotype and CAR (constitutive androstane receptor) expression. J Pharmacol Exp Ther. 2003;307:906–22. doi: 10.1124/jpet.103.054866. [DOI] [PubMed] [Google Scholar]
- 4.Hesse LM, He P, Krishnaswamy S, Hao Q, Hogan K, von Moltke LL, Greenblatt DJ, Court MH. Pharmacogenetic determinants of interindividual variability in bupropion hydroxylation by cytochrome P450 2B6 in human liver microsomes. Pharmacogenetics. 2004;14:225–38. doi: 10.1097/00008571-200404000-00002. [DOI] [PubMed] [Google Scholar]
- 5.Ekins S, Wrighton SA. The role of CYP2B6 in human xenobiotic metabolism. Drug Metab Rev. 1999;31:719–54. doi: 10.1081/dmr-100101942. [DOI] [PubMed] [Google Scholar]
- 6.Mo SL, Liu YH, Duan W, Wei MQ, Kanwar JR, Zhou SF. Substrate specificity, regulation, and polymorphism of human cytochrome P450 2B6. Curr Drug Metab. 2009;10:730–53. doi: 10.2174/138920009789895534. [DOI] [PubMed] [Google Scholar]
- 7.Cho JY, Lim HS, Chung JY, Yu KS, Kim JR, Shin SG, Jang IJ. Haplotype structure and allele frequencies of CYP2B6 in a Korean population. Drug Metab Dispos. 2004;32:1341–4. doi: 10.1124/dmd.104.001107. [DOI] [PubMed] [Google Scholar]
- 8.Mehlotra RK, Ziats MN, Bockarie MJ, Zimmerman PA. Prevalence of CYP2B6 alleles in malaria-endemic populations of West Africa and Papua New Guinea. Eur J Clin Pharmacol. 2006;62:267–75. doi: 10.1007/s00228-005-0092-9. [DOI] [PMC free article] [PubMed] [Google Scholar]
- 9.Zanger UM, Klein K, Saussele T, Blievernicht J, Hofmann MH, Schwab M. Polymorphic CYP2B6: molecular mechanisms and emerging clinical significance. Pharmacogenomics. 2007;8:743–59. doi: 10.2217/14622416.8.7.743. [DOI] [PubMed] [Google Scholar]
- 10.Desta Z, Saussele T, Ward B, Blievernicht J, Li L, Klein K, Flockhart DA, Zanger UM. Impact of CYP2B6 polymorphism on hepatic efavirenz metabolism in vitro. Pharmacogenomics. 2007;8:547–58. doi: 10.2217/14622416.8.6.547. [DOI] [PubMed] [Google Scholar]
- 11.Turpeinen M, Nieminen R, Juntunen T, Taavitsainen P, Raunio H, Pelkonen O. Selective inhibition of CYP2B6-catalyzed bupropion hydroxylation in human liver microsomes in vitro. Drug Metab Dispos. 2004;32:626–31. doi: 10.1124/dmd.32.6.626. [DOI] [PubMed] [Google Scholar]
- 12.Richter T, Murdter TE, Heinkele G, Pleiss J, Tatzel S, Schwab M, Eichelbaum M, Zanger UM. Potent mechanism-based inhibition of human CYP2B6 by clopidogrel and ticlopidine. J Pharmacol Exp Ther. 2004;308:189–97. doi: 10.1124/jpet.103.056127. [DOI] [PubMed] [Google Scholar]
- 13.Turpeinen M, Tolonen A, Uusitalo J, Jalonen J, Pelkonen O, Laine K. Effect of clopidogrel and ticlopidine on cytochrome P450 2B6 activity as measured by bupropion hydroxylation. Clin Pharmacol Ther. 2005;77:553–9. doi: 10.1016/j.clpt.2005.02.010. [DOI] [PubMed] [Google Scholar]
- 14.Mutlib AE, Chen H, Nemeth GA, Markwalder JA, Seitz SP, Gan LS, Christ DD. Identification and characterization of efavirenz metabolites by liquid chromatography/mass spectrometry and high field NMR: species differences in the metabolism of efavirenz. Drug Metab Dispos. 1999;27:1319–33. [PubMed] [Google Scholar]
- 15.Ward BA, Gorski JC, Jones DR, Hall SD, Flockhart DA, Desta Z. The cytochrome P450 2B6 (CYP2B6) is the main catalyst of efavirenz primary and secondary metabolism: implication for HIV/AIDS therapy and utility of efavirenz as a substrate marker of CYP2B6 catalytic activity. J Pharmacol Exp Ther. 2003;306:287–300. doi: 10.1124/jpet.103.049601. [DOI] [PubMed] [Google Scholar]
- 16.Ogburn ET, Jones DR, Masters AR, Xu C, Guo Y, Desta Z. Efavirenz primary and secondary metabolism in vitro and in vivo: identification of novel metabolic pathways and cytochrome P450 2A6 as the principal catalyst of efavirenz 7-hydroxylation. Drug Metab Dispos. 2010;38:1218–29. doi: 10.1124/dmd.109.031393. [DOI] [PMC free article] [PubMed] [Google Scholar]
- 17.Fuhr U, Jetter A, Kirchheiner J. Appropriate phenotyping procedures for drug metabolizing enzymes and transporters in humans and their simultaneous use in the ‘cocktail’ approach. Clin Pharmacol Ther. 2007;81:270–83. doi: 10.1038/sj.clpt.6100050. [DOI] [PubMed] [Google Scholar]
- 18.Rohrbacher M, Kirchhof A, Geisslinger G, Lotsch J. Pyrosequencing-based screening for genetic polymorphisms in cytochrome P450 2B6 of potential clinical relevance. Pharmacogenomics. 2006;7:995–1002. doi: 10.2217/14622416.7.7.995. [DOI] [PubMed] [Google Scholar]
- 19.Burger D, van der Heiden I, la Porte C, van der Ende M, Groeneveld P, Richter C, Koopmans P, Kroon F, Sprenger H, Lindemans J, Schenk P, van Schaik R. Interpatient variability in the pharmacokinetics of the HIV non-nucleoside reverse transcriptase inhibitor efavirenz: the effect of gender, race and CYP2B6 polymorphism. Br J Clin Pharmacol. 2006;61:148–54. doi: 10.1111/j.1365-2125.2005.02536.x. [DOI] [PMC free article] [PubMed] [Google Scholar]
- 20.Bae SK, Jeong YJ, Lee C, Liu KH. Identification of human UGT isoforms responsible for glucuronidation of efavirenz and its three hydroxy metabolites. Xenobiotica. 2011;41:437–44. doi: 10.3109/00498254.2011.551849. [DOI] [PubMed] [Google Scholar]
- 21.Cho DY, Ogburn ET, Jones D, Desta Z. Contribution of N-glucuronidation to efavirenz elimination in vivo in the basal and rifampin-induced metabolism of efavirenz. Antimicrob Agents Chemother. 2011;55:1504–9. doi: 10.1128/AAC.00883-10. [DOI] [PMC free article] [PubMed] [Google Scholar]
- 22.Katzenmaier S, Markert C, Riedel KD, Burhenne J, Haefeli WE, Mikus G. Determining the time course of CYP3A inhibition by potent reversible and irreversible CYP3A inhibitors using a limited sampling strategy. Clin Pharmacol Ther. 2011;90:666–73. doi: 10.1038/clpt.2011.164. [DOI] [PubMed] [Google Scholar]
- 23.di Iulio J, Fayet A, Arab-Alameddine M, Rotger M, Lubomirov R, Cavassini M, Furrer H, Gunthard HF, Colombo S, Csajka C, Eap CB, Decosterd LA, Telenti A. In vivo analysis of efavirenz metabolism in individuals with impaired CYP2A6 function. Pharmacogenet Genomics. 2009;19:300–9. doi: 10.1097/FPC.0b013e328328d577. [DOI] [PubMed] [Google Scholar]
- 24.Silverman RB. The Organic Chemistry of Drug Design and Drug Action. 2nd edn. Amsterdam; Boston: Elsevier Academic Press; 2004. [Google Scholar]
- 25.Walsky RL, Astuccio AV, Obach RS. Evaluation of 227 drugs for in vitro inhibition of cytochrome P450 2B6. J Clin Pharmacol. 2006;46:1426–38. doi: 10.1177/0091270006293753. [DOI] [PubMed] [Google Scholar]
- 26.Mukonzo JK, Roshammar D, Waako P, Andersson M, Fukasawa T, Milani L, Svensson JO, Ogwal-Okeng J, Gustafsson LL, Aklillu E. A novel polymorphism in ABCB1 gene, CYP2B6*6 and sex predict single dose efavirenz population pharmacokinetics in Ugandans. Br J Clin Pharmacol. 2009;68:690–9. doi: 10.1111/j.1365-2125.2009.03516.x. [DOI] [PMC free article] [PubMed] [Google Scholar]
- 27.King J, Aberg JA. Clinical impact of patient population differences and genomic variation in efavirenz therapy. AIDS. 2008;22:1709–17. doi: 10.1097/QAD.0b013e32830163ad. [DOI] [PubMed] [Google Scholar]
- 28.Habtewold A, Amogne W, Makonnen E, Yimer G, Riedel KD, Ueda N, Worku A, Haefeli WE, Lindquist L, Aderaye G, Burhenne J, Aklillu E. Long-term effect of efavirenz autoinduction on plasma/peripheral blood mononuclear cell drug exposure and CD4 count is influenced by UGT2B7 and CYP2B6 genotypes among HIV patients. J Antimicrob Chemother. 2011;66:2350–61. doi: 10.1093/jac/dkr304. [DOI] [PubMed] [Google Scholar]
- 29.Xu C, Ogburn ET, Guo Y, Desta Z. Effects of the CYP2B6*6 allele on catalytic properties and inhibition of CYP2B6 in vitro: implication for the mechanism of reduced efavirenz metabolism and other CYP2B6 substrates in vivo. Drug Metab Dispos. 2012;40:717–25. doi: 10.1124/dmd.111.042416. [DOI] [PMC free article] [PubMed] [Google Scholar]
- 30.Tucker GT, Houston JB, Huang SM. Optimizing drug development: strategies to assess drug metabolism/transporter interaction potential – towards a consensus. Br J Clin Pharmacol. 2001;52:107–17. doi: 10.1046/j.0306-5251.2001.temp.1441.x. [DOI] [PMC free article] [PubMed] [Google Scholar]
- 31.Kharasch ED, Mitchell D, Coles R. Stereoselective bupropion hydroxylation as an in vivo phenotypic probe for cytochrome P4502B6 (CYP2B6) activity. J Clin Pharmacol. 2008;48:464–74. doi: 10.1177/0091270008314254. [DOI] [PubMed] [Google Scholar]
- 32.Kirchheiner J, Klein C, Meineke I, Sasse J, Zanger UM, Murdter TE, Roots I, Brockmoller J. Bupropion and 4-OH-bupropion pharmacokinetics in relation to genetic polymorphisms in CYP2B6. Pharmacogenetics. 2003;13:619–26. doi: 10.1097/00008571-200310000-00005. [DOI] [PubMed] [Google Scholar]
- 33.Ngaimisi E, Mugusi S, Minzi O, Sasi P, Riedel KD, Suda A, Ueda N, Janabi M, Mugusi F, Haefeli WE, Bertilsson L, Burhenne J, Aklillu E. Effect of rifampicin and CYP2B6 genotype on long-term efavirenz autoinduction and plasma exposure in HIV patients with or without tuberculosis. Clin Pharmacol Ther. 2011;90:406–13. doi: 10.1038/clpt.2011.129. [DOI] [PubMed] [Google Scholar]
Associated Data
This section collects any data citations, data availability statements, or supplementary materials included in this article.