

Abstract
Objective
Cancer incidence and mortality data collected from population-based cancer registries were analyzed to present the overall cancer statistics in Chinese registration areas by age, sex and geographic area in 2007.
Methods
In 2010, 48 cancer registries reported cancer incidence and mortality data of 2007 to National Central Cancer Registry of China. Of them, 38 registries’ data met the national criteria. Incidence and mortality were calculated by cancer sites, age, gender, and area. Age-standardized rates were described by China and World population.
Results
The crude incidence rate for all cancers was 276.16/100,000 (305.22/100,000 for male and 246.46/100,000 for female; 284.71/100,000 in urban and 251.07/100,000 in rural). Age-standardized incidence rates by China and World population were 145.39/100,000 and 189.46/100,000 respectively. The crude mortality rate for all cancers was 177.09/100,000 (219.15/100,000 for male and 134.10/100,000 for female; 173.55/100,000 in urban and 187.49/100,000 in rural). Age-standardized mortality rates by China and World population were 86.06/100,000 and 116.46/100,000, respectively. The top 10 most frequently common cancer sites were the lung, stomach, colon and rectum, liver, breast, esophagus, pancreas, bladder, brain and lymphoma, accounting for 76.12% of the total cancer cases. The top 10 causes of cancer death were cancers of the lung, liver, stomach, esophagus, colon and rectum, pancreas, breast, leukemia, brain and lymphoma, accounting for 84.37% of the total cancer deaths.
Conclusion
Cancer remains a major disease threatening people’s health in China. Prevention and control should be enhanced, especially for the main cancers.
Key words: Cancer registry, Incidence, Mortality, China
INTRODUCTION
Cancer has become a major public health issue in China. According to the third National Death Survey, cancer mortality had increased these years, ranking as the second leading cause of death[1]. With increasing cancer burden, Chinese government led to a series of national initiative to address specific cancer issues including cancer surveillance. Systematic cancer surveillance could not only provide the statistics of cancer burden, but also form the basis of cancer prevention and control.
Population-based cancer registries play an important role in collecting and providing accurate cancer statistics, building up the major component of cancer surveillance. The first population-based cancer registry in China was established more than 50 years ago. But the covering population of cancer registries around China was very limited in the 20th century[2, 3]. National Office for Cancer Prevention and Control was built up as a federal bureau fighting against cancer. And it published the first manual of national cancer registration in 1982. In 2002, National Central Cancer Registry (NCCR) was established by the Health Ministry of China to enhance systematic management of cancer surveillance. Since then, NCCR has enhanced the management of cancer registries all over the country. NCCR currently provides national cancer statistics, enabling a thorough definition of the cancer burden, which is a necessary process before addressing it. In 2010, the number of cancer registries which reported cancer statistics of 2007 to NCCR had increased to 48, and the quality of the cancer statistics had improved.
Based on the increasing demand of cancer information for effective cancer prevention and control, NCCR published the annual cancer report of China to provide the latest statistics from registration areas[4]. In the present study, we pooled the qualified cancer data from population-based cancer registries and calculated the cancer incidence and mortality rates in 2007. Although the representativeness of the data in a national level might be considered, it remained the only source of information available on the profile of cancer in China. Our data also covered the largest population reflecting the most recent estimate of cancer burden in China.
MATERIALS AND METHODS
Data Source
NCCR of China was responsible for the collection, evaluation and publication of the cancer statistics from population-based cancer registries. In 2010, 48 cancer registries from 19 provinces reported cancer registration data of 2007 to NCCR. Of them, 20 registries were located in urban areas and 28 were located in rural areas. All data of incidence and mortality were reported to population-based cancer registries from hospitals, community health centers or other departments, including centers of township medical insurance and the New-type Rural Cooperative Medical System. The death record database was compared with cancer registration database to identify cancer deaths and supplement missing cases. Demographic information was provided by local statistics bureaus.
Quality Control
For data quality, the proportion of morphological verification (MV%), percentage of cancer cases identified with death certification only (DCO%) and mortality to incidence ratio (M/I) were used to evaluate the completeness, validity and reliability of the cancer statistics. Based on “Guideline of Chinese Cancer Registration” and the standard of data inclusion in “Cancer Incidence in Five Continents Volume IX”[5], we used software including MS-Excel and IARC-crgTools issued by the International Agency for Research on Cancer/the International Association of Cancer Registries (IARC/IACR) for data check and evaluation[6, 7].
Of 48 cancer registries’ data, 38 met the data quality criteria and were pooled into the national data for annual report. The population covered by the 38 cancer registries was 59,809,313, with 44,609,139 in urban and 15,200,174 in rural, 30,228,938 for males and 29,580,375 for females. The MV%, DCO%, and M/I ratio for the national pooled data were 65.83%, 1.95% and 0.64, respectively. The three indicators in cancer registries of urban areas were 67.71%, 2.28%, and 0.61, whereas in cancer registries of rural areas, they were 59.57%, 0.83% and 0.75, respectively.
Statistical Analysis
International Classification of Diseases (ICD)-10 and ICD-O-3 were used for the coding of the cancers. Crude incidence and mortality rates were prepared for different types of cancer, by sex, area and for 19 age groups (0-, 1-4, 5-9, ··· 80-84, 85+ years). Age- standardized rates were calculated using the Chinese population (1982) and World Segi’s population. The cumulative risk of developing or dying from cancer before 75 years old is calculated and presented as a percentage.
RESULTS
The number of overall new cancer cases reported from qualified cancer registries of China was 165,171, including 92,266 for males and 72,905 for females. The number of overall cancer deaths was 105,916, including 66,248 for males and 39,668 for females. The detailed information for the number of new cases and cancer deaths in each cancer registry is shown in Table 1.
Table 1. Population, number of new cancer cases and deaths in cancer registries in 2007.
| Registry | Urban=1 Rural=2 |
Population |
New cancer cases |
Cancer deaths |
||||||
|---|---|---|---|---|---|---|---|---|---|---|
| Both | Male | Female | Both | Male | Female | Both | Male | Female | ||
| Beijing | 1 | 7,385,826 | 3,734,516 | 3,651,310 | 20,736 | 10,806 | 9,930 | 11,778 | 6,909 | 4,869 |
| Shexian | 2 | 391,398 | 203,473 | 187,925 | 1,090 | 644 | 446 | 850 | 559 | 291 |
| Cixian | 2 | 624,084 | 317,671 | 306,413 | 1,886 | 1,120 | 766 | 1,369 | 891 | 478 |
| Yangcheng | 2 | 385,450 | 193,981 | 191,469 | 1,245 | 732 | 513 | 851 | 475 | 376 |
| Shenyang | 1 | 3,473,371 | 1,722,554 | 1,750,817 | 9,774 | 5,083 | 4,691 | 6,524 | 3,889 | 2,635 |
| Dalian | 1 | 2,195,949 | 1,103,964 | 1,091,985 | 7,843 | 4,235 | 3,608 | 4,412 | 2,790 | 1,622 |
| Anshan | 1 | 1,462,456 | 729,979 | 732,477 | 4,235 | 2,232 | 2,003 | 2,446 | 1,483 | 963 |
| Benxi | 1 | 959,458 | 478,918 | 480,540 | 2,361 | 1,324 | 1,037 | 1,463 | 949 | 514 |
| Haerbin-daoli | 1 | 698,335 | 341,526 | 356,809 | 1,912 | 1,035 | 877 | 1,334 | 816 | 518 |
| Haerbin-nangang | 1 | 1,047,989 | 526,483 | 521,506 | 2,428 | 1,292 | 1,136 | 1,908 | 1,187 | 721 |
| Shanghai | 1 | 6,152,360 | 3,088,243 | 3,064,117 | 23,031 | 12,052 | 10,979 | 14,239 | 8,327 | 5,912 |
| Suzhou | 1 | 2,099,527 | 1,051,450 | 1,048,077 | 6,203 | 3,675 | 2,528 | 3,731 | 2,368 | 1,363 |
| Qidong | 2 | 1,121,411 | 553,060 | 568,351 | 3,674 | 2,254 | 1,420 | 2,628 | 1,733 | 895 |
| Haimen | 2 | 1,022,168 | 467,280 | 554,888 | 3,493 | 2,122 | 1,371 | 2,548 | 1,656 | 892 |
| Lianyungang | 1 | 715,569 | 364,010 | 351,559 | 1,576 | 879 | 697 | 961 | 597 | 364 |
| Guanyun | 2 | 1,090,978 | 566,033 | 524,945 | 2,175 | 1,313 | 862 | 1,393 | 889 | 504 |
| Huai’an-Chuzhou | 1 | 1,207,776 | 622,836 | 584,940 | 2,627 | 1,613 | 1,014 | 1,856 | 1,174 | 682 |
| Jinhu | 2 | 358,484 | 182,398 | 176,086 | 985 | 601 | 384 | 623 | 368 | 255 |
| Jianhu | 2 | 804,287 | 415,466 | 388,821 | 2,077 | 1,335 | 742 | 1,713 | 1,128 | 585 |
| Dafeng | 2 | 727,386 | 364,338 | 363,048 | 1,932 | 1,149 | 783 | 1,602 | 997 | 605 |
| Yangzhong | 2 | 273,860 | 135,369 | 138,491 | 1,046 | 554 | 492 | 869 | 551 | 318 |
| Taixing | 2 | 1,277,353 | 639,990 | 637,363 | 2,692 | 1,761 | 931 | 2,365 | 1,570 | 795 |
| Hangzhou | 1 | 6,679,363 | 3,386,559 | 3,292,804 | 15,036 | 8,339 | 6,697 | 11,155 | 7,261 | 3,894 |
| Jiaxing | 1 | 500,978 | 250,332 | 250,646 | 1,468 | 810 | 658 | 825 | 539 | 286 |
| Jiashan | 2 | 381,010 | 189,650 | 191,360 | 1,231 | 718 | 513 | 847 | 551 | 296 |
| Haining | 2 | 647,418 | 320,492 | 326,926 | 1,320 | 768 | 552 | 1,023 | 639 | 384 |
| Ma’anshan | 1 | 621,077 | 318,515 | 302,562 | 1,175 | 739 | 436 | 923 | 641 | 282 |
| Changle | 2 | 664,983 | 350,444 | 314,539 | 1,170 | 751 | 419 | 894 | 628 | 266 |
| Linqu | 2 | 795,780 | 405,525 | 390,255 | 1,463 | 929 | 534 | 1,215 | 811 | 404 |
| Feicheng | 2 | 733,988 | 379,076 | 354,912 | 2,020 | 1,232 | 788 | 1,461 | 937 | 524 |
| Linzhou | 2 | 1,018,942 | 520,744 | 498,198 | 2,154 | 1,203 | 951 | 1,541 | 927 | 614 |
| Wuhan | 1 | 4,737,505 | 2,450,144 | 2,287,361 | 12,051 | 6,667 | 5,384 | 6,544 | 4,228 | 2,316 |
| Guangzhou | 1 | 3,886,593 | 1,981,494 | 1,905,099 | 12,981 | 7,185 | 5,796 | 6,175 | 3,897 | 2,278 |
| Sihui | 2 | 409,413 | 211,778 | 197,635 | 680 | 444 | 236 | 457 | 318 | 139 |
| Zhongshan | 2 | 1,437,026 | 717,977 | 719,049 | 3,041 | 1,823 | 1,218 | 2,038 | 1,349 | 689 |
| Fusui | 2 | 430,726 | 228,613 | 202,113 | 598 | 449 | 149 | 502 | 386 | 116 |
| Chongqing-Jiulongpo | 1 | 785,007 | 399,829 | 385,178 | 1,571 | 987 | 584 | 1,143 | 759 | 384 |
| Yanting | 2 | 604,029 | 314,228 | 289,801 | 2,191 | 1,411 | 780 | 1,710 | 1,071 | 639 |
| Total | 59,809,313 | 30,228,938 | 29,580,375 | 165,171 | 92,266 | 72,905 | 10,5916 | 66,248 | 39,668 | |
The crude incidence rate for all cancers in registration areas was 276.16/100,000 in 2007 (305.22/100,000 for males and 246.46/100,000 for females). The age-standardized rates by China and World population were 145.39/100,000 and 189.46/100,000, respectively. Among the patients aged 0-74 years, the cumulative incidence rate was 21.68%. The crude cancer incidence rate in urban areas was 284.71/100,000 and it was higher than that in rural areas (251.07/100,000). After age standardization, the incidence rate in urban was lower than that in rural (Table 2).
Table 2. Cancer incidence by sex and area in registration areas in 2007.
| Area | Sex | New cases | Incidence rate (1/105) | CASR* (1/105) | WASR† (1/105) | Cumulative rate (0-74, %) |
|---|---|---|---|---|---|---|
| All areas | Both | 165,171 | 276.16 | 145.39 | 189.46 | 21.68 |
| Male | 92,266 | 305.22 | 164.39 | 218.21 | 25.14 | |
| Female | 72,905 | 246.46 | 128.67 | 164.65 | 18.46 | |
| Urban | Both | 127,008 | 284.71 | 143.18 | 185.89 | 20.94 |
| Male | 68,953 | 305.76 | 155.95 | 206.90 | 23.45 | |
| Female | 58,055 | 263.20 | 132.55 | 168.60 | 18.65 | |
| Rural | Both | 38,163 | 251.07 | 155.57 | 204.10 | 24.47 |
| Male | 23,313 | 303.65 | 195.89 | 259.47 | 31.25 | |
| Female | 14,850 | 197.41 | 118.20 | 153.60 | 17.94 |
*Age, standardized incidence rate (China population); †Age, standardized incidence rate (World population).
Lung cancer was the most common cancer with crude rate of 51.25/100,000, followed by stomach cancer, colorectal cancer, liver cancer and breast cancer. The top ten most common cancers accounted for 76.12% of all registered new cases. Lung cancer in males and breast cancer in females were the most frequently diagnosed cancers (Table 3). Cancer atlas also showed difference between urban and rural areas. The incidence rates of lung cancer and colorectal cancer were higher in urban than those in rural. However, the incidence rates of stomach cancer, liver cancer and esophageal cancer were higher in rural than those in urban (Table 4).
Table 3. Top 10 cancer incidence rates in cancer registration areas in 2007.
| Rank | Cancer sites | Incidence rate (1/105) | % | CASR (1/105) |
|---|---|---|---|---|
| Both sexes | ||||
| 1 | Lung (C33-34) | 51.25 | 18.56 | 24.82 |
| 2 | Stomach (C16) | 33.68 | 12.19 | 17.06 |
| 3 | Colon an rectum (C18-21) | 29.62 | 10.73 | 14.76 |
| 4 | Liver (C22) | 27.11 | 9.82 | 14.36 |
| 5 | Breast (C50) | 21.59 | 7.82 | 12.05 |
| 6 | Esophagus (C15) | 19.86 | 7.19 | 10.14 |
| 7 | Pancreas (C25) | 7.28 | 2.64 | 3.49 |
| 8 | Bladder (C67) | 6.98 | 2.53 | 3.27 |
| 9 | Brain (C70-72) | 6.79 | 2.46 | 4.30 |
| 10 | Lymphoma (C81-85, 88, 90, 96) | 6.06 | 2.19 | 3.57 |
| Top 10 | 210.22 | 76.12 | 107.82 | |
| Male | ||||
| 1 | Lung (C33-34) | 67.93 | 22.26 | 34.62 |
| 2 | Stomach (C16) | 45.36 | 14.86 | 24.04 |
| 3 | Liver (C22) | 40.01 | 13.11 | 22.10 |
| 4 | Colon and rectum (C18-21) | 32.50 | 10.65 | 16.90 |
| 5 | Esophagus (C15) | 26.85 | 8.80 | 14.39 |
| 6 | Bladder (C67) | 10.53 | 3.45 | 5.21 |
| 7 | Prostate (C61) | 9.80 | 3.21 | 4.39 |
| 8 | Pancreas (C25) | 7.95 | 2.60 | 4.05 |
| 9 | Kidney (C64-66, 68) | 7.35 | 2.41 | 4.09 |
| 10 | Lymphoma | 6.95 | 2.28 | 4.17 |
| Top 10 | 255.23 | 83.62 | 133.96 | |
| Female | ||||
| 1 | Breast (C50) | 43.19 | 17.53 | 23.87 |
| 2 | Lung (C33-34) | 34.20 | 13.88 | 15.73 |
| 3 | Colon and rectum (C18-21) | 26.68 | 10.82 | 12.80 |
| 4 | Stomach (C16) | 21.74 | 8.82 | 10.46 |
| 5 | Liver (C22) | 13.92 | 5.65 | 6.73 |
| 6 | Esophagus (C15) | 12.72 | 5.16 | 6.05 |
| 7 | Cervix (C53) | 11.64 | 4.72 | 6.85 |
| 8 | Uterus (C54-55) | 8.70 | 3.53 | 4.84 |
| 9 | Ovary (C56) | 8.57 | 3.48 | 5.00 |
| 10 | Thyroid gland (C73) | 8.38 | 3.40 | 5.42 |
| Top 10 | 189.74 | 76.98 | 97.76 |
Table 4. Cancer incidence rate for major cancers in urban and rural areas in 2007.
| Rank | Male |
Rank | Female |
||||
|---|---|---|---|---|---|---|---|
| Sites | Incidence rate (1/105) | CASR (1/105) | Sites | Incidence rate (1/105) | CASR (1/105) | ||
| Urban | |||||||
| 1 | Lung | 72.82 | 34.86 | 1 | Breast | 51.24 | 27.14 |
| 2 | Stomach | 37.92 | 18.80 | 2 | Lung | 37.78 | 16.43 |
| 3 | Colon and rectum | 37.84 | 18.59 | 3 | Colon and rectum | 31.34 | 14.27 |
| 4 | Liver | 35.03 | 18.37 | 4 | Stomach | 18.42 | 8.42 |
| 5 | Esophagus | 17.33 | 8.63 | 5 | Liver | 12.26 | 5.64 |
| 6 | Bladder | 12.29 | 5.72 | 6 | Cervix | 11.75 | 6.78 |
| 7 | Prostate | 12.10 | 5.06 | 7 | Thyroid | 10.16 | 6.45 |
| 8 | Kidney | 9.20 | 4.90 | 8 | Ovary | 10.13 | 5.70 |
| 9 | Pancreas | 8.57 | 4.12 | 9 | Uterus | 9.60 | 5.09 |
| 10 | Lymphoma | 7.75 | 4.52 | 10 | Brain | 7.80 | 4.67 |
| Rural | |||||||
| 1 | Stomach | 67.20 | 42.98 | 1 | Stomach | 31.57 | 18.20 |
| 2 | Esophagus | 54.80 | 35.17 | 2 | Esophagus | 31.49 | 17.97 |
| 3 | Liver | 54.65 | 35.31 | 3 | Lung | 23.70 | 13.26 |
| 4 | Lung | 53.56 | 33.60 | 4 | Breast | 19.61 | 12.60 |
| 5 | Colon, rectum | 16.80 | 10.73 | 5 | Liver | 18.78 | 10.74 |
| 6 | Pancreas | 6.12 | 3.80 | 6 | Colon and rectum | 13.00 | 7.47 |
| 7 | Nasopharynx | 6.08 | 4.09 | 7 | Cervix | 11.31 | 7.35 |
| 8 | Bladder | 5.35 | 3.30 | 8 | Uterus | 6.05 | 3.92 |
| 9 | Brain | 5.21 | 3.67 | 9 | Brain | 5.14 | 3.55 |
| 10 | Lymphoma | 4.98 | 4.19 | 10 | Pancreas | 4.35 | 2.31 |
Table 5 shows the age-specific incidence rates for all cancers by sex and area. The cancer incidence was relatively low in subjects before 30 years old. And the rate was dramatically increasing for patients after 30 years old, reaching the peak in those of 80-84 years old (Table 5, Figure 1). Stratified by sex and area, subjects in the age group of 80-84 had highest age-specific rates, both for males and for females, in urban and in rural.
Table 5. Age-specific incidence rate in cancer registration areas in 2007 (1/105).
| Age group (year) | All areas |
Urban |
Rural |
||||||
|---|---|---|---|---|---|---|---|---|---|
| Both | Male | Female | Both | Male | Female | Both | Male | Female | |
| All | 276.16 | 305.22 | 246.46 | 284.71 | 305.76 | 263.20 | 251.07 | 303.65 | 197.41 |
| 0- | 15.26 | 16.78 | 13.56 | 20.66 | 22.32 | 18.83 | 6.01 | 7.49 | 4.31 |
| 1- | 13.12 | 15.20 | 10.79 | 16.45 | 19.38 | 13.23 | 7.21 | 7.94 | 6.36 |
| 5- | 8.17 | 7.27 | 9.17 | 10.98 | 9.88 | 12.21 | 3.33 | 2.84 | 3.88 |
| 10- | 7.51 | 7.78 | 7.23 | 9.22 | 8.91 | 9.54 | 4.67 | 5.90 | 3.32 |
| 15- | 11.96 | 12.65 | 11.24 | 12.83 | 13.20 | 12.45 | 9.72 | 11.27 | 8.05 |
| 20- | 14.75 | 12.75 | 16.91 | 15.62 | 13.13 | 18.36 | 11.51 | 11.28 | 11.75 |
| 25- | 27.56 | 22.62 | 32.70 | 30.69 | 23.84 | 37.92 | 18.69 | 19.07 | 18.30 |
| 30- | 47.09 | 36.04 | 58.27 | 52.74 | 37.01 | 68.73 | 33.75 | 33.75 | 33.76 |
| 35- | 86.61 | 67.64 | 105.80 | 87.34 | 61.92 | 113.15 | 84.42 | 85.08 | 83.76 |
| 40- | 163.37 | 136.34 | 191.51 | 159.35 | 122.49 | 198.03 | 177.34 | 185.38 | 169.18 |
| 45- | 239.03 | 219.23 | 259.58 | 246.84 | 214.79 | 280.38 | 211.81 | 235.02 | 188.38 |
| 50- | 400.27 | 414.07 | 386.17 | 388.05 | 382.06 | 394.14 | 447.55 | 536.64 | 354.97 |
| 55- | 534.21 | 602.42 | 465.11 | 495.83 | 540.72 | 450.60 | 672.67 | 822.10 | 518.14 |
| 60- | 683.65 | 833.05 | 537.59 | 629.66 | 748.78 | 515.74 | 858.41 | 1,093.45 | 611.68 |
| 65- | 861.78 | 1,069.85 | 665.90 | 832.68 | 1,003.07 | 674.77 | 958.47 | 1,284.01 | 635.44 |
| 70- | 1,237.35 | 1,570.61 | 932.69 | 1,199.57 | 1,490.65 | 930.31 | 1,395.42 | 1,916.22 | 942.36 |
| 75- | 1,533.70 | 2,031.99 | 1,100.74 | 1,541.73 | 1,998.94 | 1,131.25 | 1,501.15 | 2,178.80 | 985.98 |
| 80- | 1,623.46 | 2,232.65 | 1,163.89 | 1,652.19 | 2,250.86 | 1,182.39 | 1,512.54 | 2,153.90 | 1,098.00 |
| 85- | 1,385.23 | 2,057.86 | 991.46 | 1,436.73 | 2,113.29 | 1,024.33 | 1,184.28 | 1,811.44 | 872.11 |
Figure 1.
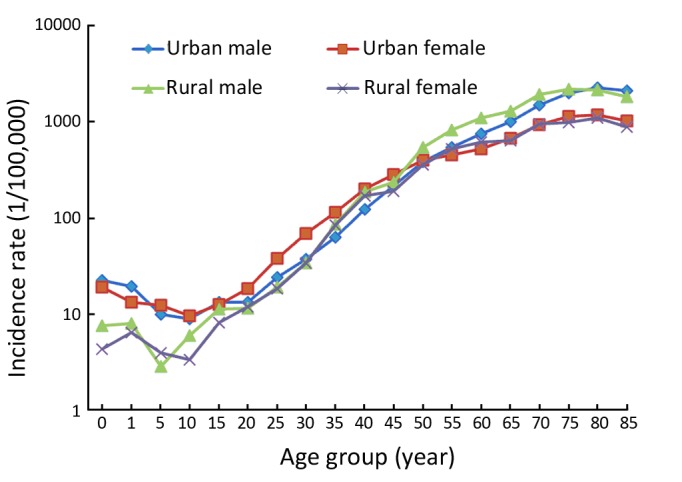
Age-specific cancer incidence rates in urban and rural areas, 2007.
The crude mortality in cancer registration areas was 177.09/100,000. And the age-standardized rates by Chinese population and World population were 86.06/100,000 and 116.46/100,000, respectively. Rural areas had higher cancer mortality of 187.49/100,000 than urban areas (173.55/100,000), though the incidence in rural was lower than that in urban. After age standardization, the mortality rate in rural was still higher than that in urban (Table 6).
Table 6. Cancer mortality in cancer registration areas in 2007.
| Area |
Sex |
Deaths |
Mortality rate (1/105) |
CASR (1/105) |
WASR (1/105) |
Cumulative rate (0-74, %) |
| All areas | Both | 105,916 | 177.09 | 86.06 | 116.46 | 13.06 |
| Male | 66,248 | 219.15 | 112.74 | 153.52 | 17.05 | |
| Female | 39,668 | 134.10 | 61.16 | 82.73 | 9.23 | |
| Urban | Both | 77,417 | 173.55 | 78.78 | 107.05 | 11.73 |
| Male | 47,814 | 212.02 | 101.66 | 139.14 | 15.06 | |
| Female | 29,603 | 134.21 | 57.46 | 77.96 | 8.55 | |
| Rural | Both | 28,499 | 187.49 | 112.06 | 149.96 | 17.85 |
| Male | 18,434 | 240.10 | 152.39 | 204.65 | 24.18 | |
| Female | 10,065 | 133.80 | 74.58 | 100.01 | 11.72 |
Lung cancer was the leading cause of cancer death in cancer registration areas both for men and for women with crude rates of 60.83/100,000 and 29.83/100,000, respectively. Other cancer types with high mortality in men were liver cancer, stomach cancer, esophageal cancer and colorectal cancer. In women, stomach cancer was the second cause of cancer death, followed by liver cancer, colorectal cancer and esophageal cancer (Table 7). Stratified by demographic area, lung cancer was the leading cause of cancer death in urban areas with crude mortality of 65.71/100,000 in men and 33.05/100,000 in women. However, in rural areas, the mortality rates of gastric cancer were highest both for males (50.47/100,000) and for females (24.86/100,000) (Table 8).
Table 7. Cancer mortality for major cancers in cancer registration areas in 2007.
| Cancer sites | Mortality (1/105) | % | CASR (1/105) |
|---|---|---|---|
| Both sexes | |||
| Lung | 45.50 | 18.56 | 24.82 |
| Liver | 25.91 | 34.20 | 13.88 |
| Stomach | 24.59 | 26.68 | 10.82 |
| Esophagus | 15.80 | 21.74 | 8.82 |
| Colon and rectum | 14.15 | 13.92 | 5.65 |
| Pancreas | 7.15 | 12.72 | 5.16 |
| Breast | 4.67 | 11.64 | 4.72 |
| Leukemia | 4.04 | 8.70 | 3.53 |
| Brain | 3.95 | 8.57 | 3.48 |
| Lymphoma | 3.64 | 8.38 | 3.40 |
| Top 10 | 149.40 | 189.74 | 76.98 |
| Male | |||
| Lung | 60.83 | 27.76 | 30.05 |
| Liver | 37.94 | 17.31 | 20.62 |
| Stomach | 32.51 | 14.84 | 16.41 |
| Esophagus | 21.58 | 9.84 | 11.10 |
| Colon and rectum | 15.58 | 7.11 | 7.55 |
| Pancreas | 7.64 | 3.49 | 3.83 |
| Leukemia | 4.57 | 2.08 | 3.30 |
| Brain | 4.39 | 2.00 | 2.69 |
| Lymphoma | 4.36 | 1.99 | 2.38 |
| Bladder | 3.76 | 1.72 | 1.62 |
| Top 10 | 193.16 | 88.14 | 99.55 |
| Female | |||
| Lung | 29.83 | 22.24 | 12.87 |
| Stomach | 16.49 | 12.29 | 7.30 |
| Liver | 13.62 | 10.16 | 6.28 |
| Colon and rectum | 12.69 | 9.46 | 5.32 |
| Esophagus | 9.90 | 7.38 | 4.25 |
| Breast | 9.31 | 6.95 | 4.61 |
| Pancreas | 6.64 | 4.95 | 2.87 |
| Gallbladder | 3.95 | 2.95 | 1.63 |
| Brain | 3.50 | 2.61 | 2.00 |
| Lymphoma | 3.50 | 2.61 | 2.29 |
| Top 10 | 109.43 | 81.6 | 49.43 |
Table 8. Cancer mortality for major cancers in urban and rural areas in 2007.
| Rank | Male |
Rank | Female |
||||
|---|---|---|---|---|---|---|---|
| Sites | Mortality (1/105) | CASR (1/105) | Sites | Mortality (1/105) | CASR (1/105) | ||
| Urban | |||||||
| 1 | Lung | 65.71 | 30.31 | 1 | Lung | 33.05 | 13.35 |
| 2 | Liver | 33.92 | 17.33 | 2 | Colon and rectum | 14.29 | 5.64 |
| 3 | Stomach | 26.40 | 12.20 | 3 | Stomach | 13.63 | 5.64 |
| 4 | Colon and rectum | 17.63 | 7.98 | 4 | Liver | 12.55 | 5.38 |
| 5 | Esophagus | 13.99 | 6.62 | 5 | Breast | 10.35 | 4.85 |
| 6 | Pancreas | 8.45 | 3.99 | 6 | Pancreas | 7.55 | 3.09 |
| 7 | Lymphoma | 4.85 | 2.50 | 7 | Esophagus | 5.09 | 1.92 |
| 8 | Leukemia | 4.58 | 3.16 | 8 | Gallbladder | 4.52 | 1.74 |
| 9 | Prostate | 4.35 | 1.67 | 9 | Ovary | 3.93 | 1.88 |
| 10 | Brain | 4.31 | 2.61 | 10 | Leukemia | 3.69 | 2.30 |
| Rural | |||||||
| 1 | Stomach | 50.47 | 31.75 | 1 | Stomach | 50.47 | 31.75 |
| 2 | liver | 49.74 | 32.13 | 2 | liver | 49.74 | 32.13 |
| 3 | Lung | 46.51 | 28.86 | 3 | Lung | 46.51 | 28.86 |
| 4 | Esophagus | 43.87 | 27.55 | 4 | Esophagus | 43.87 | 27.55 |
| 5 | Colon and rectum | 9.57 | 5.89 | 5 | Colon and rectum | 9.57 | 5.89 |
| 6 | Pancreas | 5.29 | 3.25 | 6 | Pancreas | 5.29 | 3.25 |
| 7 | brain | 4.64 | 3.14 | 7 | brain | 4.64 | 3.14 |
| 8 | Leukemia | 4.55 | 3.71 | 8 | Leukemia | 4.55 | 3.71 |
| 9 | Nasopharynx | 3.66 | 2.43 | 9 | Nasopharynx | 3.66 | 2.43 |
| 10 | Lymphoma | 2.92 | 1.94 | 10 | Lymphoma | 2.92 | 1.94 |
For overall age-specific cancer mortality, the cancer mortality rate in age group of 0-4 was higher than that in patients of 5-24 years old. And the age-specific mortality showed a significant increasing trend after 25 years old. A peak appeared in the age group of 80-84 years with a rate of 1,568.80/100,000 (Table 9, Figure 2). Stratified by sex and area, the trends generally showed similarity both in males and in females, in urban areas and in rural areas.
Table 9. Age-specific mortality in cancer registration areas in 2007 (1/105).
| Age group (year) | All areas |
Urban |
Rural |
||||||
|---|---|---|---|---|---|---|---|---|---|
| Both | Male | Female | Both | Male | Female | Both | Male | Female | |
| All | 177.09 | 219.15 | 134.10 | 173.55 | 212.02 | 134.21 | 187.49 | 240.1 | 133.80 |
| 0- | 5.66 | 5.59 | 5.74 | 7.79 | 7.44 | 8.19 | 2.00 | 2.50 | 1.44 |
| 1- | 5.20 | 6.37 | 3.89 | 5.55 | 7.05 | 3.89 | 4.59 | 5.19 | 3.89 |
| 5-- | 2.64 | 3.07 | 2.17 | 2.81 | 3.21 | 2.36 | 2.36 | 2.84 | 1.83 |
| 10- | 3.55 | 4.32 | 2.72 | 3.83 | 4.64 | 2.95 | 3.08 | 3.78 | 2.32 |
| 15- | 4.60 | 5.85 | 3.27 | 4.24 | 5.53 | 2.88 | 5.52 | 6.67 | 4.28 |
| 20- | 5.42 | 5.91 | 4.88 | 5.04 | 5.59 | 4.42 | 6.84 | 7.16 | 6.51 |
| 25- | 7.66 | 8.91 | 6.35 | 7.08 | 7.88 | 6.23 | 9.30 | 11.92 | 6.68 |
| 30- | 14.04 | 16.5 | 11.55 | 12.93 | 14.96 | 10.87 | 16.66 | 20.16 | 13.16 |
| 35- | 30.03 | 36.05 | 23.94 | 25.57 | 28.64 | 22.46 | 43.50 | 58.64 | 28.37 |
| 40- | 63.85 | 77.78 | 49.34 | 55.95 | 65.46 | 45.97 | 91.34 | 121.38 | 60.88 |
| 45- | 104.78 | 131.94 | 76.59 | 99.19 | 122.27 | 75.03 | 124.28 | 166.24 | 81.91 |
| 50- | 188.82 | 244.54 | 131.94 | 167.71 | 214.08 | 120.57 | 270.56 | 361.15 | 176.43 |
| 55- | 284.79 | 377.93 | 190.44 | 244.67 | 323.23 | 165.54 | 429.48 | 572.66 | 281.43 |
| 60- | 404.44 | 544.59 | 267.43 | 339.66 | 455.90 | 228.5 | 614.15 | 818.67 | 399.47 |
| 65- | 567.06 | 745.37 | 399.20 | 514.51 | 663.03 | 376.87 | 741.63 | 1,009.44 | 475.88 |
| 70- | 924.12 | 1,200.65 | 671.33 | 856.69 | 1,091.81 | 639.19 | 1,206.27 | 1,671.03 | 801.97 |
| 75- | 1,306.11 | 1,745.32 | 924.48 | 1,272.03 | 1,668.75 | 915.85 | 1,444.33 | 2,085.46 | 956.92 |
| 80- | 1,568.80 | 2,147.47 | 1,132.25 | 1,564.79 | 2,119.77 | 1,129.27 | 1,584.29 | 2,267.27 | 1,142.84 |
| 85- | 1,521.07 | 2,191.42 | 1,128.64 | 1,572.24 | 2,245.41 | 1,161.89 | 1,321.42 | 1,951.32 | 1,007.89 |
Figure 2.
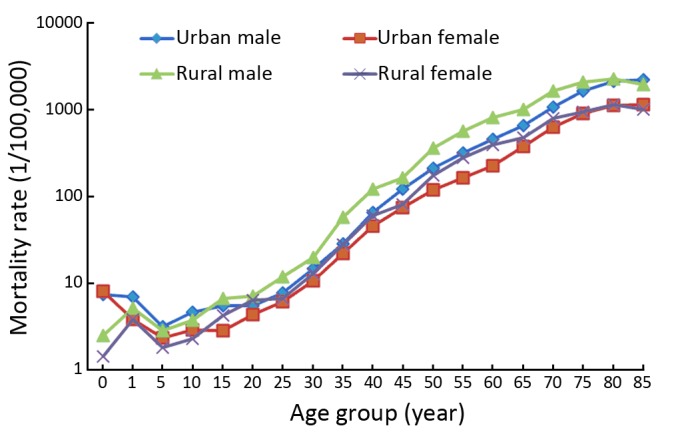
Age-specific cancer mortality rates in urban and rural areas, 2007.
DISCUSSION
In the present study, we provided the overall cancer incidence and mortality rates of 2007 in Chinese registration areas, based on 38 population-based cancer registries’ data. The crude incidence and mortality rates for all cancers in registration areas were 276.16/100,000 and 77.09/100,000, respectively. The incidence was higher in urban than that in rural, in males than in females, whereas the mortality was higher in rural than in urban, in males than in females.
Lung cancer, stomach cancer, colorectal cancer, liver cancer, breast cancer and esophageal cancer remained the most frequently diagnosed cancers of China. Our study presented the most recent cancer statistics of China, providing the basic information for cancer prevention and control.
Compared to the cancer incidence and mortality in 2006, we found that the prevalence of cancer in China was relatively stable[8]. The crude incidence and mortality rates were a little higher than those in 2006. But after age standardization, the incidence and mortality rates showed small decrease, suggesting aging population was a major cause of increasing cancer burden. As reflected from the age-specific incidence and mortality rates, age was observed to be associated with increased risk of developing cancer. It is expected that the cancer burden would be heavier in the next few years for the country with aging population[9].
We found that the profile of cancer incidence and mortality in urban areas was different from that in rural areas. Such disparities would reflect regional differences in the prevalence and distribution of major risk factors, detection practices and availability of treatment services. In urban areas, the prevalence of lung cancer, colorectal cancer and female breast cancer has increased quickly these years. The westernization of lifestyle and air pollution may explain part of the change of cancer spectrum. The cancers related to infections such as stomach cancer, cervical cancer and liver cancer remained leading causes of cancer deaths in rural areas of China. Programs of early diagnosis and treatment on these cancers are ongoing in many cancer epidemic areas of China, aiming to control the prevalence of the diseases. The mortality rate of cancer in rural was higher than that in urban area. In rural areas, cancers tend to be diagnosed at later stages and patients have reduced access to appropriate therapeutics.
Cigarette smoking is a major cause of lung cancer, esophageal cancer, bladder cancer, and oral cancer, accounting for 45% of cancer deaths in men and 21.5% of cancer deaths in women[10]. Smoking is also a cause of many other serious conditions including diseases of the lung and heart. China has the world’s largest smoking population with an estimated number of 350,000,000 smokers[11]. Reducing smoking is a declared government priority. In the United States, the mortality of overall cancers has decreased due to effective tobacco control and programs of cancer early diagnosis and treatment[12]. Chinese government should take more effective actions for nationwide tobacco control.
A limitation of the study is the lower proportion of MV%, as compared to many developed countries’ registration data. However, cancer data in Chinese settings are shown to be reasonably reliable and relatively stable these years. And the population coverage for the cancer registries is much larger than 20 years ago. In 2008, Ministry of Health in China started a nationwide program of Chinese cancer registry and follow-up. A total of 193 local registries were funded by the government in 2010, covering about 13% of the whole population. It is expected that the cancer statistics of China would be more accurate and representative in the future.
Overall, in China, the cancer incidence and mortality of 2007 were still very high. The cancer burden would continue to increase due to aging population. Effective intervention is imperative for cancer prevention and control.
ACKNOWLEDGMENT
The cooperation of 48 population-based cancer registries in providing cancer statistics is gratefully acknowledged. The authors assume full responsibility for analyses and interpretation of these data.
REFERENCES
- 1.Ministry of Health. National death survey report 2004-2005. Beijing: Peking Union Medical College Publication House; 2008. [Google Scholar]
- 2.Lu FZ, Zhang SW, Chen YH, et al. Investigation analysis of cancer registration in China. Zhong Guo Zhong Liu (in Chinese)2004;13:134-41 [Google Scholar]
- 3.Chen WQ, Zhao P, Rao KQ. A primary cancer registration system in China, 2010. Zhong Hua Yu Fang Yi Xue Za Zhi (in Chinese)2010;44:374-5 [PubMed] [Google Scholar]
- 4.National Office for Cancer Prevention and Control. China cancer annual report 2010. Beijing: Military Medical Sciences Press; 2011. [Google Scholar]
- 5.Curado MP, Edwards B, Shin HR, et al. Cancer Incidence in Five Continents, Vol. IX. In: IARC Scientific Publications No. 160. Lyon: IARC Press; 2007. [Google Scholar]
- 6.Parkin DM, Chen VW, Ferlay J, et al. Comparability and quality control in cancer registration. IARC Technical Report No.19, Lyon: IARC Press; 1994.
- 7.Felay J, Burkhard C, Whelan S, et al. Check and conversion programs for cancer registries. IARC Technical Report No.42. Lyon: IARC Press; 2005.
- 8.Chen WQ, Zhang SW, Zou XN, et al. Cancer incidence and mortality in China, 2006. Chin J Cancer Res 2011;23:3-9 [DOI] [PMC free article] [PubMed] [Google Scholar]
- 9.Chen WQ, Zheng RS, Zeng HM. Bayesian age-period-cohort prediction of lung cancer incidence in China. Thoracic Cancer 2011;2:149-55 [DOI] [PubMed] [Google Scholar]
- 10.Shopland DR, Eyre HJ, Pechacek TF. Smoking-attributable cancer mortality in 1991: is lung cancer now the leading cause of death among smokers in the United States? J Natl Cancer Inst 1991;83:1142-8 [DOI] [PubMed] [Google Scholar]
- 11.Ma GS, Kong LZ. The national nutrition and health survey in China, 2002: Behavior and Lifestyle. Beijing: People's Medical Publishing House; 2006. [Google Scholar]
- 12.Cole P, Rodu B.Declining cancer mortality in the United States. Cancer 1996;78:2045-8 [DOI] [PubMed] [Google Scholar]