

Abstract
Objective
Although the development of trastuzumab has improved the outlook for women with human epidermal growth factor receptor 2 (HER2)-positive breast cancer, the resistance to anti-HER2 therapy is a growing clinical dilemma. We aim to determine whether HER2-specific T cells generated from dendritic cells (DCs) modified with HER2 gene could effectively kill the HER2-positive breast cancer cells, especially the trastuzumab-resistant cells.
Methods
The peripheral blood mononuclear cells (PBMCs) from healthy donors, whose HLA haplotypes were compatible with the tumor cell lines, were transfected with reconstructive human adeno-association virus (rhAAV/HER2) to obtain the specific killing activities of T cells, and were evaluated by lactate dehydrogenase (LDH) releasing assay.
Results
Trastuzumab produced a significant inhibiting effect on SK-BR-3, the IC50 was 100ng/ml. MDA-MB-453 was resistant to trastuzumab even at a concentration of 10,000 ng/ml in vitro. HER2-specific T lymphocytes killed effectively SK-BR-3 [(69.86±13.41)%] and MDA-MB-453 [(78.36±10.68)%] at 40:1 (effector:target ratio, E:T), but had no significant cytotoxicity against HER2-negative breast cancer cell lines MDA-MB-231 or MCF-7 (less than 10%).
Conclusion
The study showed that HER2-specific T lymphocytes generated from DCs modified by rhAAV/HER2 could kill HER2-positive breast cancer cell lines in a HER2-dependent manner, and result in significantly high inhibition rates on the intrinsic trastuzumab-resistant cell line MDA-MB-453 and the tastuzumab-sensitive cell line SK-BR-3. These results imply that this immunotherapy might be a potential treatment to HER2-positive breast cancer.
Key words: HER2-positive breast cancer, Trastuzumab-resistant, Dendritic cells, Immunotherapy, Reconstructive human adeno-association virus
INTRODUCTION
Breast cancer is the most frequently diagnosed cancer and the leading cause of cancer death among females[1]. Human epidermal growth factor receptor 2 (HER2) over-expression or HER2 gene amplification exists in about 25% to 30% of breast cancer, which is called HER2-positive breast cancer representing a distinct disease entity confirmed by gene expression profiling studies[2-4].HER2 gene amplification is also an independent poor prognostic factor, which is associated with more aggressive, high risk of recurrence and poor prognosis characterized by resistance to traditional systemic therapy[5-8]. Although the development of trastuzumab and lapatinib has improved the outlook for women with HER2-positive disease, resistance to anti-HER2 therapy is a growing clinical dilemma[9,10].
With the progresses in immunology, immuno- therapy has become an important means of cancer treatment. Since HER2 is over-expressed at the cell surface of tumor cells, it represents a good target for anti-cancer immunotherapy[11]. Currently, anti-HER2 immunotherapy researches focus on anti-HER family antibodies, anti-HER2 vaccines and adoptive immuno- therapy of cancer using HER2 antigen-specific T lymphocytes [cytotoxic T lymphocytes (CTL) mainly][10,12]. Dendritic cells (DCs) are the most powerful antigen presenting cells (APCs). They also play an important role in tumor immune escape and tolerance mechanism, including the existence of distinct DC subsets that respond differentially to distinct activation signals andinability of the antigen-presenting function. To overcome this problem, genetic modification of DCs in vitro can be aimed at expressing tumor antigens or changing their biology to increase their ability to present antigens, taking advantage of the high efficiency of antigen presentation and T cell activation by DCs[13,14].Reconstructive human adeno-association virus (rhAAV) has the ability to infect both non-dividing and dividing cells with persistent expression which made it an attractive gene transfer vector. AAV vectors are one of the safest for use in gene therapy and high effective for the delivery of antigens and cytokine genes into human DCs. They do not show directly toxic to DCs or induce a cytopathic effect in DCs, and they may help the process of DC’s maturation[15]. The genetic manipulation of DCs by rhAAV vector-deliveries of self antigen may circumvent and surmount innate immune tolerance. Using rhAAV as vectors, autologous DCs could be loaded by HER2, prostate-specific antigen (PSA) and other tumor antigen genes. These modified DCs can induce specific anti-tumor immunity against tumor cells carrying the target antigen[16,17].
It is still unknown that whether tumor antigen- specific T cells generated by DCs pulsed with HER2cDNA could attack trastuzumab-resistant HER2-positive breast cancer cell lines. We aim to determine whether HER2-specific T cells generated from human peripheral blood DCs transfected with rhAAV/HER2 could effectively kill the both HER2-positive breast cancer cell lines in vitro.
Materials and methods
Generation of rhAAV/HER2 viruses
Three rhAAV/HER2 plasmids were kindly provided by Dr. Linda Santschi (Coastal Marine Biolab, USA). The partial HER2cDNA sequences, ligated into the pAAV-MCS, encoded amino acids 153-653 (left, HER2-L), 403-906 (middle, HER2-M), and 796-1,255 (right, HER2-R), respectively. The three rhAAV/HER2 vectors were generated by using the AAV Helper-Free System (Stratagene), according to manufacturer’s instructions.Virus stock was titered to determine vector genomes per ml (v.g./ml) by using the QuickTiter™ AAV Quantitation Kit’s (Cell biolabs),yielding titers of approximately 1×10¹⁰v.g./ml.
Cell lines and HER2 expression analysis detected by immunocytochemistry (IHC)
The human breast cancer cell lines MDA-MB-453 and SK-BR-3 were kindly given by Professor Liu Zhihua (Cancer Institute and Hospital, ChineseAcademy of Medical Sciences), the cell lines MDA-MB-231 and MCF-7 were obtained from the cell culture center of Institute of Basic Medical Science, ChineseAcademy of Medical Sciences (Beijing, China). All the cell lines were maintained in RPMI 1640 with 4% fetal bovine serum (FBS, GIBCO, USA), 100 U-100 µg/ml penicillin- streptomycin (GIBCO), in 75 cm2 plastic flasks (Coring, USA) at 37°C in a humidified atmosphere with 5% CO2. Cells were harvested by 0.25% trypsin-ethylene diaminetetraacetic acid (EDTA, GIBCO). All experiments were done with subconfluent cells in the exponential phase of growth.
The breast cancer cells were then stained with anti-HER2/neu (4B5) monoclonal antibodies (Ventana) as previously described[18]. IHC scoring system according to the guidelines given by American Society of Clinical Oncology/College of American Pathologists (ASCO/CAP)[18].
Generation of DCs infected by rhAAV/HER2 and activated T lymphocytes
The peripheral blood mononuclear cells (PBMCs) from healthy donors were separated by routine ficoll gradient method. All blood donors were given informed consent in writing. The human leukocyte antigen (HLA)-A or HLA-B haplotype, (HLA-A*/B* SSP Kits, Protrans, Germany) of donors was respectively compatible with one of the HER2-positive cell lines (MDA-MB-453, SK-BR-3) and one of the HER2-negative cell lines (MDA-MB-231, MCF-7). After cultured for 4 h in AIM-V medium, the non-adherent cells were transferred to 6-well culture plates in AIM-V containing interleukin-2 (IL-2, Tebao, Xiamen, China, 20 IU/ml). The adherent monocytes were infected immediately with 105v.g./cell (multiplicity of infection, MOI) rhAAV/HER2 (rhAAV/HER2-L,rhAAV/HER2-M, rhAAV/HER2-R, together) and cells without transfection were set as control. After 4 h, the medium/ virus solution was removed and the cells were finally fed with AIM-V medium containing recombinant human granulocyte-macrophage colony stimulating factor (GM-CSF) (200 ng/ml) and recombinant human IL-4 (R & D Systems, USA, 10 ng/ml). On day 6, tumor necrosis factor-α (TNF-α, R & D Systems, USA, 100 IU/ml) was added to the medium. The medium and cytokines were replaced every two days. On day 3, day 5 and day 7, the culture supernatants were collected, IL-10 and IL-12 secretion was measured in duplicate by enzyme-linked immune sorbent assay (ELISA) using commercially available kits (BOSTER, China), according to the manufacturer’s instructions.
On day 7, the mature DCs were harvested and mixed with peripheral blood lymphocytes (PBLs) (PBL:DC ratio, 20:1), keeping the two groups: the rhAAV/HER2 transfected group, and the non-rhAAV/ HER2 transfected group. The mixtures were cultured in AIM-V with 10% FBS containing GM-CSF (100 ng/ml, only the mixed day), IL-2 (20 IU/ml) and IL-7 (10 IU/ml) at 5×10⁶ cells/ml in 6-well culture plates. The medium and cytokines were replaced every two days. After 7 d (on day 14) post-priming, the cells were harvested and analyzed further.
Analysis of surface markers of DCs and activated T cells
For the analysis of the surface markers of DCs, panels of fluorescein isothiocyanate (FITC)-, phycoerythrin (PE)-, and phycoerythrin-Cy5 (PC5)-labeled monoclonal antibodies including HLA-DR-FITC, CD86-PE, CD11c-PC5, CD1a-PE, CD80-FITC, CD83-FITC (Beckman Coulter, USA) were co-cultured with DCs. On day 14, the primed T cell populations were analyzed for their surface markers with immunofluorescence staining. Panels of FITC-, PE-, and PC5-labeled monoclonal antibodies were added to cell suspensions as follows: CD4-FITC/CD8-PE/ CD3-PC5,CD3-FITC/CD16+CD56-PE, CD19-PC5; CD25-PE, CD4-FITC; CD28-PE, CD8-FITC (Beckman Coulter, USA). The expression of those markers was analyzed using flow cytometry (FCM, Beckman Coulter, USA).
In Vitro sensitivity of HER2-positive cell lines to trastuzumab
The breast cancer cell lines MDA-MB-453, SK-BR-3, MDA-MB-231 were plated in 96-well microtiter plates at a concentration of 5×10³/well and cultured at 37°C in a humidified atmosphere with 5% CO2 overnight. The effect of trastuzumab (Herceptin, F.Hoffmann-LaRoche Ltd., Switzerland) was tested at concentrations of 75, 100, 125, 250, 500, 1,000, 5,000, and 10,000 ng/ml, and incubated for 84 h. The medium and trastuzumab were replaced every two days. The inhibition of tumor cell proliferation was measured by Cell Counting Kit-8 (CCK-8, Dojindo Laboratories, Japan) according to the manufacturer’s recommendation, with the HER2- negative MDA-MB-231 cell line as a control.
Measurement of cytotoxicity of HER2-specific T lymphocytes and cytokine ELISA
Breast cancer cells (as target; 5,000 per well) and T lymphocytes (effector) were co-incubated at ratios of 20:1 and 40:1 (effector:target, E:T) in 200 ul of RPMI 1640 containing 4% FBS. This coincubation was performed in triplicate for 6 h at 37°C in a humidified atmosphere with 5% CO2. The cytotoxicity was measured by the lactate dehydrogenase (LDH) release assay (Non-Radioactive Cytotoxicity Assay, Promega). The absorbance at 490 nm was recorded by using a microplate reader (Bio-tech Instruments Inc. USA). The negative control sample (target spontaneous) was prepared identically, but did not contain T lymphocytes; the effector spontaneous sample contained no target cells. Tumor cells were completely lysed by adding 30 μllysis solution (10×) to a triplicate set of wells containing 200 μl of culture medium (target maximum). Setting volume correction control was to correct for the volume increase caused by the addition of lysis solution (10×). The percentage of cells killed was calculated according to the following formula: cytotoxic rate %= (experimental-effector spontaneous-target spontaneous) /(target maximum-target spontaneous) ×100.
Cell-free supernatants from T-cell and tumor cell co-culture were harvested at 6 h for the presence of IL-4 and interferon (IFN-γ). These cytokines were quantified by ELISA kits (BOSTER, China). All samples were tested in duplicate, according to the manufacturer’s instructions.
Statistical analysis
Data are presented as‾x±s. Statistical analysis software used the SPSS 15.0 (SPSS Inc., Chicago, IL, USA). Differences among multiple samples (LDH release assay and cytokine ELISA) were analyzed by nonparametric test (Friedman Test and Wilcoxon Signed Ranks Test). When data met the normal distribution, the differences between paired samples were analyzed by the paired t-test. When data did not meet the normal distribution, the differences between paired samples were analyzed by the two related samples non-parametric test, in the surface markers of DC and T cell assays. A value of P<0.05 was considered as statistical significance.
RESULTS
HER2 expression in breast cancer cell lines
According to the IHC scoring system of HER2 expression, MDA-MB-231, MCF-7, MDA-MB-453 and SK-BR-3 cell lines were found to express HER2 at score 0, 1+, 2+ and 3+, respectively (Figure 1). These results are consistent with reported previously[19], and confirm that MDA-MB-453 and SK-BR-3 are HER2-positive cell lines, MDA-MB-231 and MCF-7 are HER2-negative cell lines.
Figure 1.

HER2 protein expression in breast cancer cell lines (IHC, x400), using the HER2-specific monoclonal antibody HER2/neu (4B5). A. SK-BR-3, the majority of the cells showed a strong complete membrane staining corresponding to score 3+ focally also a cytoplasmic reaction was seen; B. MDA-MB-453, more than 10% cells showed a weak to moderate complete membrane staining corresponding to 2+; C. MCF-7 or D. MDA-MB-231 had no detectable HER2 protein expression
The process of DC maturation also involves a redistribution of major histocompatibility complex (MHC) molecules from intracellular endocytic compartments to surface, increasing in the surface expression of co-stimulatory molecules, and surface expression of adhesion molecules and chemokine receptors. We determined the surface phenotypes of untreated DCs (nonAAV-DC) and rhAAV/HER2- transfected DCs (AAV-DC) by FCM (Figure 2). The results, shown in Table 1, demonstrated that the mature DCs, cultured with GM-CSF, IL-4, TNF-α in both groups, commonly high expressed HLA-DR, CD86, CD11c, CD1a. And AAV-DC group expressed significantly higher levels of CD80 and CD83 (P<0.05).
Figure 2.
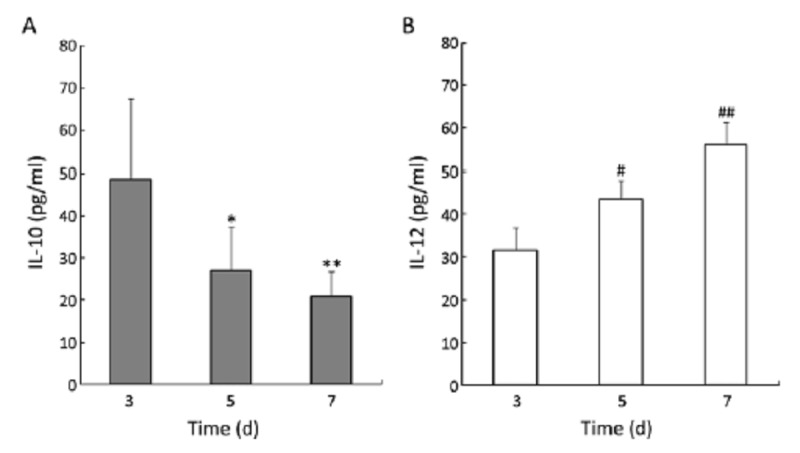
Secretion of IL-10 and IL-12 by DCs infected with rhAAV/HER2. The culture supernatants were collected from 8 donors to analysis IL-10 and IL-12 secreted by rhAAV/HER2 transfected DCs using ELISA assay. A. IL-10, the results, 48.65±18.89 pg/ml (day 3), 27.13±10.50 pg/ml (day 5) and 21.05±5.73 pg/ml (day 7), indicated DCs secreted less IL-10 (*P<0.05 compared with day 3, **P<0.05 compared with day 5); B. IL-12, the results for IL-12, 31.63±5.32 pg/ml (day 3), 43.65±4.23 pg/ml (day 5) and 56.01±5.24 pg/ml (day 7), demonstrated DCs secreted more IL-12 (#P<0.05 compared with day 3, ##P<0.05 compared with day 5)
Table 1. Cell surface markers of DCs.
| Groups | CD86 | HLA-DR | CD80 | CD1A | CD11C | CD83 |
|---|---|---|---|---|---|---|
| AAV-DC | (95.58±5.40)% | (97.48±2.22)% | (35.78±11.20)% | (36.03±28.20)% | (93.28±3.60)% | (59.48±5.55)% |
| nonAAV-DC | (90.73±6.70)% | (87.53±9.60)% | (20.78±9.00)% | (52.15±24.80)% | (87.30±9.60)% | (35.60±8.30)% |
| P | 0.136 | 0.176 | 0.01 | 0.014 | 0.156 | 0.021 |
Samples were obtained from 4 donors (5 independent tests)
Phenotype analysis of activated T cells
The mature DCs were harvested and mixed with the PBL and then cultured with AIM-V containing 10% FBS, IL-2 and IL-7 for 7 d. We could see the proliferation and activation of a large number of lymphocytes, and lymphocytes changed from circular to slightly irregular in shape, and aggregated into loose clusters.
In order to identify the components of cell populations generated from human peripheral blood DCs transfected with rhAAV/HER2, we used FCM analysis to determine the immunophenotype of the rhAAV/HER2 transfected (AAV-T) group and the non-rhAAV/HER2 transfected (nonAAV-T) group. As shown in Table 2, there were predominantly CD3+ T lymphocytes (>90%), and only small percentage of CD19+ (B-lymphocytes), CD3-CD56+CD16+ (NK-cells), CD3+CD56+CD16+ (NK/T-like cells) in both groups, and no significant difference existed between the two groups (P>0.05). The AAV-T group contained a significant higher proportion of (51.74±10.77)% in the AAV-T group, and (44.58±20.34)% in nonAAV-T group. CD28 was also widely expressed in both groups (>75%), and there was no significant difference between the two groups (P>0.05).
Table 2. Phenotype of lymohocytes stimulated by different DCs.
| Phenotype | AAV-T | nonAAV-T | P |
|---|---|---|---|
| CD3+ | (95.12±2.41)% | (96.16±4.79)% | 0.686 |
| CD3+CD4+ | (68.76±14.58)% | (67.74±1.82)% | 0.5 |
| CD3+CD8+ | (26.82±8.55)% | (21.38±9.00)% | 0.138 |
| CD3−CD56+CD16+ | (2.42±1.37)% | (2.72±3.43)% | 0.416 |
| CD3+CD56+CD16+ | (2.68±1.33)% | (1.60±1.05)% | 0.066 |
| CD19+ | (1.14±0.71)% | (1.16±0.79)% | 0.588 |
| CD25+ | (51.74±10.77)% | (44.58±20.34)% | 0.104 |
| CD4+CD25+ | (32.08±11.37)% | (33.12±16.46)% | 0.498 |
| CD28+ | (79.18±7.34)% | (78.10±12.05)% | 0.18 |
| CD8+CD28- | (15.68±8.42)% | (14.46±5.74)% | 0.892 |
| CD8+CD28+ | (15.27±10.94)% | (7.32±4.86)% | 0.043 |
Samples were obtained from 4 donors (5 independent tests)
Sensitivity of HER2-positive cell lines to trastuzumabin vitro
Observation after 84 h of incubation (Figure 3) showed that trastuzumab still did not have any growth inhibiting effect on MDA-MB-453 cells, nor in HER2- negative cell line MDA-MB-231. Trastuzumab produced a significant action on the SK-BR-3. The IC50, indicating the concentration required for 50% inhibition of the cell growth, was achieved (about 100 ng/ml). These results are similar to other studies[20,21], and confirm that SK-BR-3 is a trastuzumab-sensitive cell line, while MDA-MB-453 is a model of intrinsic trastuzumab resistance in vitro.
Figure 3.
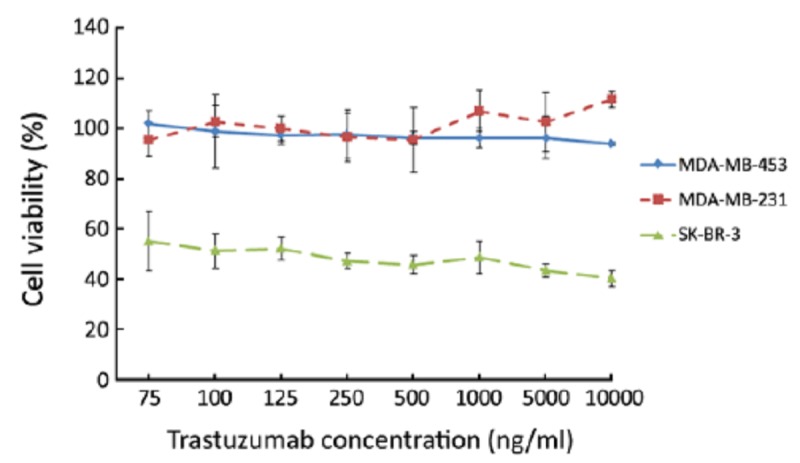
Growth inhibitory effects of trastuzumab on HER2-positive cell lines. After 84 h of incubation, trastuzumab did not have growth inhibiting effect on MDA-MB-453 cells and HER2-negative cell line MDA-MB-231; trastuzumab produced a more significant growth inhibitory effect on SK-BR-3 and the IC50 was about 100 ng/ml
HER2-Specific T cells recognize and kill HER2-positive cells in vitro
We selected SK-BR-3 (A*11, B*40, B*18) and MDA-MB-453 (A*01, B*08) as target cells. In a standard 6 h LDH release assay, as shown in Figure 4A, there was always an increase in killing activity of HER2-specific T cells (AAV-T) against SK-BR-3, in comparison with non transduced T (non-T) cells against SK-BR-3 (P<0.05), also in comparison with HER2-specific T cells against HER2-negative breast cancer cell line MDA-MB-231(A*24, A*68, B*15, B*35) or MCF-7 (A*02, B*18, B*44) (P<0.05). The cytotoxic rates of T cells were always less than 10% in the last twocontrol groups, confirming the HER2 specificity. Similar results were obtained from the tests for MDA-MB-453 (Figure 5B). The HER2-specific T cells could effectively kill MDA-MB-453 at (78.36±10.68)% (E:T=40:1). The cytotoxic rate was higher than the HER2-negative breast cancer cell targeted group and the non-T group, and the differences were statistically significant (P<0.05).
Figure 4.
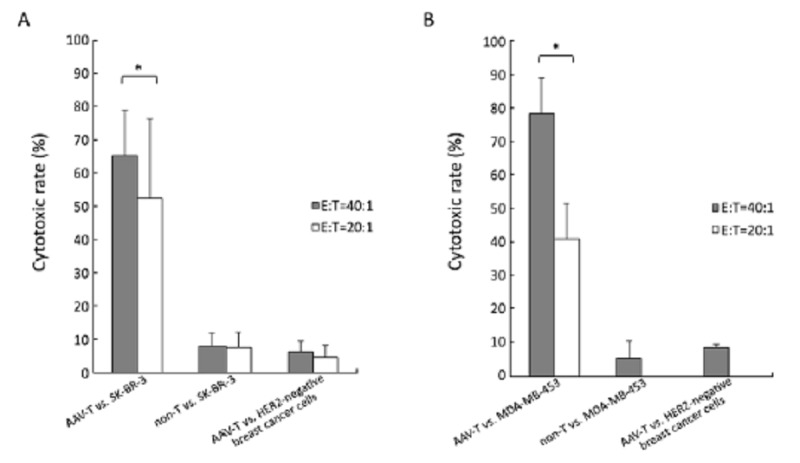
HER2-specific T lymphocytes responded against different breast cancer cell lines. A. SK-BR-3, there was always an increase in cytolytic activity of HER2-specific T cells (AAV-T), (69.86±13.41)% (E:T=40:1) and (47.16±21.63)% (E:T=20:1), in comparison with non-T against SK-BR-3 (P<0.05), also in comparison with AAV-T against HER2- negative breast cancer cell line MDA-MB-231 or MCF-7 (P<0.05), confirming HER2 specificity. The cytotoxic of T cells were always less than 10% in the last two control groups; B. MDA-MB-453, the AAV-T could effectively kill MDA-MB-453 at (78.36±10.68)% (E:T=40:1). The cytotoxic rate was higher than the HER2-negative breast cancer cell targeted group [(8.39±1.03)%] and the non-T group [(5.25±5.23)%], the differences were both statistically significant (P<0.05). The increased E:T ratios, from 20:1 to 40:1, resulted in the increased killing activity of HER2-specific T cells in both SK-BR-3 and MDA-MB-453 (*P<0.05)
Figure 5.
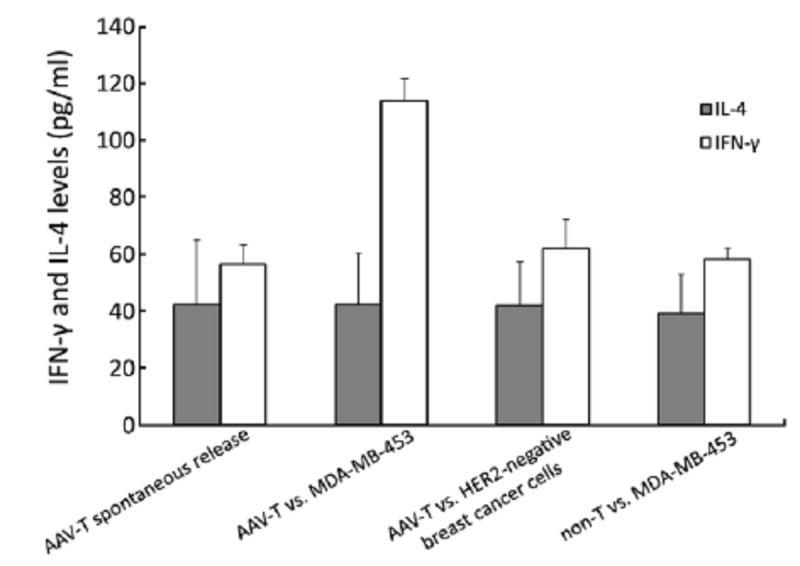
IFN-γ and IL-4 levels in the supernatant of T lymphocytes co-cultured with breast cancer cells. The IFN-γ level of the group of HER2-specific T cells (AAV-T) against MDA-MB-453, was significantly higher than the spontaneous release of T lymphocytes group, the non-T cells group and the group of AAV-T cells against HER2-negative cells (P<0.05). The levels of IL-4 among the four groups were similar (P>0.05)
As shown in Figure 4, the increased effector T cell to target ratios, from 20:1 to 40:1, could boost killing activities of the HER2-specific T cells in both SK-BR-3 (t=2.664, f=5, P<0.05) and MDA-MB-453(t=20.106, f=4, P<0.001). Considering the quantity of antigen-specific T-lymphocytes generated from 12 ml blood was limited, the E:T ratio in this study was set at 40:1 mainly.
To determine the cytokine profile of the T cells generated from rhAAV/HER2-loaded DCs and untreated DCs, we carried out ELISA of cell-free supernatants from T cells and tumor cells co-cultured for the presence of IL-4 and IFN-γ. As shown in Figure 5, the IFN-γ level of the AAV-T against MDA-MB-453 group was significantly higher than the spontaneous release of T lymphocytes group, the non-T group and the group of AAV-T against HER2-negative cells, and the differences were statistically significant (P<0.01). The differences among the last three groups were not statistically significant (P>0.05). These results were in accord with the killing results of each group. The levels of IL-4 among the four groups were similar, and the differences among the groups were not statistically significant (P>0.05). All the results suggested that the HER2-specific T lymphocytes secreted strong type 1 associated cytokines.
DISCUSSION
The developments of trastuzumab has greatly improved the outlook for women with HER2-positive breast cancer, the majority of patients develop resistance to trastuzumab within one year of treatment initiation, and approximately 15% of patients diagnosed with early HER2-positive disease are de novo resistant to trastuzumab and relapse in spite of trastuzumab therapy[22].Many studies on mechanisms of trastuzumab resistance revealed a clew that HER2 protein, as a distinct target, remains intact or exists in part, and is still widely expressed in the trastuzumab- resistant tumor cells. Therefore, continuing anti-HER2 therapy in progressing on trastuzumab therapy is still a promising strategy to inhibit the resistant tumor cells including anti-HER2 immunotherapy. Our results confirmed that SK-BR-3 was a trastuzumab-sensitive cell line, while MDA-MB-453 was a model of intrinsic trastuzumab resistance in vitro, and we also found that HER2, as an immune-target, was widely expressed on the cell surface of two cell lines.
Some studies compared the trastuzumab binding capacities of the cell lines with the growth inhibitory effect of trastuzumab, found MDA-MB-453 with the lowest trastuzumab binding capacities was among the most trastuzumab-resistant cell lines, SK-BR-3 as the one of the most trastuzumab-sensitive, expressed trastuzumab binding receptors many-fold compared to MDA-MB-453[23]. Similarly, the expression of HER2 on glioblastoma multiform (GBM) is lower in comparison with breast cancer, rendering HER2 monoclonal antibodies ineffective. Nabil’s study found that HER2-specific T cells generated by transduction with a retroviral vector encoding a HER2-specific chimeric antigen receptor could killed primary HER2-positive GBMs[24]. HER2-specific T cells allow targeting of the relatively low levels of HER2 expressed by GBMs, because the overall avidity of receptors arrayed on a T cell is greater than the avidity of a bivalent antibody, and engagement of even a limited number of T cell receptor (TCR) molecules is sufficient to trigger a cytotoxic effector response[25,26]. This may also explained why HER2- specific T cells generated from DCs modified by rhAAV/HER2 could effectively and specifically kill both HER2-positive cell lines SK-BR-3 and MDA-MB- 453, although the intensity of HER2 expression on MDA-MB-453 (IHC score 2+) was generally lower than on SK-BR-3 (IHC score 3+).
Immune system in the body plays a role in surveillance of tumors, can identify and eliminate tumors. Tumors possessed many mechanisms to escape immune recognition and attack. Some studies found that the significant T cell responses to tumor-associated antigens (TAAs), such as carcinoembryonic antigen (CEA) and HER2/neu, could be detected in breast cancer patients naive to immunotherapy, but could not result in spontaneous remission of the cancer. Meantime, they had a distinct phenotype and cytokine signature different from that produced in response to cytomegalovirus (CMV) or influenza virus (normal status of T cell responses) in the same patients, showing a higher proportion of IL-2-producing CD8+ T cells, and a lower proportion of IFN-γ-producing CD4+ and/or CD8+ T cells[27]. Antigen capture in the absence of activation stimuli may lead to the induction of T cell tolerance, as a result of antigen presentation by immature DCs in the absence of co-stimulation. Studies had shown that the reduced DC functions, including the circulating DCs and tumor-infiltrating DCs, could be one of the major causes of the observed defect in cellular immunity in patients with advanced breast cancer, and spontaneous apoptosis of blood DCs could be seen in patients with breast cancer[28-31]. But the defective T cell and DC functions in patients with advanced breast cancer could be overcome by stimulation with DCs generated from precursors in vitro using GM-CSF and IL-4. The ability to grow and differentiate DC ex vivo allowed their genetic manipulation to enhance immune activation against tumor antigens[13].
In this study, we used rhAAV as gene transfer vectors to carry the whole cDNA sequence of HER2 that was divided into three partial insertion sequences encoding the 153-653 amino acids (HER2-L), the 403-796 amino acids (HER2-M) and 797-1,255 amino acids (HER2-R), respectively. This kind of viral delivery of the full gene encoding the full protein could result in post-translational modifications, and provide multiple epitopes being expressed by the DCs, and may facilitate the subsequent epitope spreading.
During their conversion from immature to mature cells, the monocyte-derived DCs underwent a number of phenotypical and functional changes: 1) formation of dendrites; 2) high expression of CD11c, a member of integrins reflecting DCs capture antigens by phagocytosis; 3) high expression of costimulatory molecules, CD80 (B7.1), CD86 (B7.2), and HLA-DR. CD80 and CD86 are co-receptors in T-cell activation, and the level of CD80 was significantly higher than untransfected DCs; 4) CD83 is an important indicator of mature DCs, and the level of CD83 was also significantly higher than those without virus transfection; and 5) secretion of IL-12 gradually increased and secretion of IL-10 levels gradually reduced. IL-12 is a signal that helps send naive CD4+ T cells towards a Th1 phenotype and produce more helper T1 (Th1) cytokines like IFN-γ. The ultimate consequence is priming and activation of the immune system for attack against the antigens which the dendritic cell presents on its surface. In this study, the HER2-specific T lymphocytes could effectively kill the tumor cells expressing HER2 protein.
After mature DCs mixed with lymphocytes and stimulated with cytokines, we could see a significant proliferation of lymphocytes. By phenotypic analysis, we found the final harvest cells were heterogeneous cell populations. There were predominantly CD3+ T lymphocytes (>90%), and very low proportions of B-lymphocytes, NK-cells and NK/T-like cells. CD25 (a high affinity receptor subunit of IL-2, involved in T cell proliferation) and CD28 (interaction with the membrane proteins of the B7 family of DCs to provide T cell costimulatory signal) were high expressed on T lymphocytes. The AAV-T group contained a significant higher proportion of CD8+CD28+ T lymphocytes (CTL), in contrast to the non-T group. CTLs are generated by immune activation of T cytotoxic cells. These effector cells have lytic capability and are critical in the recognition and elimination of tumor cells. Functional CTL could be active in two ways: 1) DC process antigen to MHC class II pathway for CD4+Th cell activation, while they are unique in the ability to also present antigen through MHC class I for CD8+ cytotoxic T cell recognition and activation; 2) DC expressing high levels of costimulatory molecules could directly stimulate CD8+T producing IL-2 and promote CD8+T itself differentiation into CTL and proliferation without Th cells. We speculated the two ways were both involved in CTL activation and proliferation in this study.
In summary, the study showed that HER2-specific T lymphocytes generated from DCs modified by rhAAV/HER2 could kill HER2-positive breast cancer cell lines in a HER2-dependent manner, and resulted in high inhibition rates on both the intrinsic trastuzumab-resistant cell line MDA-MB-453 and trastuzumab-sensitive cell line SK-BR-3. These results imply that this immunotherapy might be a potential treatment to tumor recurrence and trastuzumab resistance in HER2-positive breast cancer.
REFERENCES
- 1.Jemal A, Bray F, Center MM, et al. Global cancer statistics. CA Cancer J Clin 2011;61:69-90 [DOI] [PubMed] [Google Scholar]
- 2.Slamon DJ, Clark GM, Wong SG, et al. Human breast cancer: correlation of relapse and survival with amplification of the HER2/neu oncogene. Science 1987;235:177-82 [DOI] [PubMed] [Google Scholar]
- 3.Slamon DJ, Godolphin W, Jones LA, et al. Studies of the HER2/neu proto-oncogene in human breast and ovarian cancer. Science 1989;244:707-12 [DOI] [PubMed] [Google Scholar]
- 4.Perou CM, Sorlie T, Eisen MB, et al. Molecular portraits of human breast tumours. Nature 2000;406:747-52 [DOI] [PubMed] [Google Scholar]
- 5.Hynes NE, Lane HA. ERBB receptors and cancer: the complexity of targeted inhibitors. Nat Rev Cancer 2005;5:341-54 [DOI] [PubMed] [Google Scholar]
- 6.Kim R, Tanabe K, Uchida Y, et al. The role of HER2 oncoprotein in drug-sensitivity in breast cancer (review) Oncol Rep 2002;9:3-9 [PubMed] [Google Scholar]
- 7.Dowsett M.Overexpression of HER2 as a resistance mechanism to hormonal therapy for breast cancer. EndocrRelat Cancer 2001;8:191-5 [DOI] [PubMed] [Google Scholar]
- 8.Harbeck N.Breast cancer: Increasing therapy options for HER2-positive early breast cancer. Nat Rev Clin Oncol 2011;9:10-2 [DOI] [PubMed] [Google Scholar]
- 9.Mukohara T.Mechanisms of resistance to anti-human epidermal growth factor receptor 2 agents in breast cancer. Cancer Sci 2011;102:1-8 [DOI] [PubMed] [Google Scholar]
- 10.Jones KL, Buzdar AU. Evolving novel anti-HER2 strategies. Lancet Oncol 2009;10:1179-87 [DOI] [PubMed] [Google Scholar]
- 11.Peoples GE, Goedegebuure PS, Smith R, et al. Breast and ovarian cancer-specific cytotoxic T lymphocytes recognize the same HER2/ neu-derived peptide. Proc Natl Acad Sci U S A 1995;92:432-6 [DOI] [PMC free article] [PubMed] [Google Scholar]
- 12.Ladjemi MZ, Jacot W, Chardèt T, et al. Anti-HER2 vaccines: new prospects for breast cancer therapy. Cancer Immunol Immunother 2010;59:1295-312 [DOI] [PMC free article] [PubMed] [Google Scholar]
- 13.Melief CJ. Cancer immunotherapy by dendritic cells. Immunity 2008;29:372-83 [DOI] [PubMed] [Google Scholar]
- 14.Ribas A.Genetically modified dendritic cells for cancer immunotherapy. Curr Gene Ther 2005;5:619-28 [DOI] [PubMed] [Google Scholar]
- 15.Daya S, Berns KI. Gene therapy using adeno-associated virus vectors. Clin Microbiol Rev 2008;21:583-93 [DOI] [PMC free article] [PubMed] [Google Scholar]
- 16.Yu Y, Pilgrim P, Zhou W, et al. rAAV/HER2/neu loading of dendritic cells for a potent cellular-mediated MHC class I restricted immune response against ovarian cancer. Viral Immunol 2008;21:435-42 [DOI] [PubMed] [Google Scholar]
- 17.Mahadevan M, Liu Y, You C, et al. Generation of robust cytotoxic T lymphocytes against prostate specific antigen by transduction of dendritic cells using protein and recombinant adeno-associated virus. Cancer Immunol Immunother 2007;56:1615-24 [DOI] [PMC free article] [PubMed] [Google Scholar]
- 18.Wolff AC, Hammond ME, Schwartz JN, et al. American Society ofClinical Oncology/College of American Pathologists guideline recommendations for human epidermal growth factor receptor 2 testing in breast cancer. J ClinOncol 2007;25:118-45 [DOI] [PubMed] [Google Scholar]
- 19.Charafe-Jauffret E, Ginestier C, Iovino F, et al. Breast cancer cell lines contain functional cancer stem cells with metastatic capacity and a distinct molecular signature. Cancer Res 2009;69:1302-13 [DOI] [PMC free article] [PubMed] [Google Scholar]
- 20.Korkaya H, Paulson A, Iovino F, et al. HER2 regulates the mammary stem/progenitor cell population driving tumorigenesis and invasion. Oncogene 2008;27:6120-30 [DOI] [PMC free article] [PubMed] [Google Scholar]
- 21.Nahta R, Esteva FJ. In vitro effects of trastuzumab and vinorelbine in trastuzumab-resistant breast cancer cells. Cancer Chemother Pharmacol 2004;53:186-90 [DOI] [PubMed] [Google Scholar]
- 22.Bedard PL, Cardoso F, Piccart-Gebhart MJ. Stemming resistance to HER2 targeted therapy. J Mammary Gland Biol Neoplasia 2009;14:55-66 [DOI] [PubMed] [Google Scholar]
- 23.Köninki K, Barok M, Tanner M, et al. , Multiple molecular mechanisms underlying trastuzumab and lapatinib resistance in JIMT-1 breast cancer cells. Cancer Lett 2010;294:211-9 [DOI] [PubMed] [Google Scholar]
- 24.Ahmed N, Salsman VS, Kew Y, et al. HER2-specific T cells target primary glioblastoma stem cells and induce regression of autologous experimental tumors. Clin Cancer Res 2010;16:474-85 [DOI] [PMC free article] [PubMed] [Google Scholar]
- 25.Sykulev Y, Joo M, Vturina I, et al. Evidence that a single peptide-MHC complex on a target cell can elicit a cytolytic T cell response. Immunity 1996;4:565-71 [DOI] [PubMed] [Google Scholar]
- 26.Unanue ER, Harding CV, Luescher IF, et al. Antigen-binding function of class II MHC molecules. Cold Spring Harb Symp Quant Biol 1989;54Pt 1:383-92 [DOI] [PubMed] [Google Scholar]
- 27.Inokuma M, dela Rosa C, Schmitt C, et al. Functional T cell responses to tumor antigens in breast cancer patients have a distinct phenotype and cytokine signature. J Immunol 2007;179:2627-33 [DOI] [PubMed] [Google Scholar]
- 28.Pinzon-Charry A, Maxwell T, McGuckin MA, et al. Spontaneous apoptosis of blood dendritic cells in patients with breast cancer. Breast Cancer Res 2006;8:R5. [DOI] [PMC free article] [PubMed] [Google Scholar]
- 29.Zhang Y, Ma B, Zhou Y, et al. Dendritic cells fused with allogeneic breast cancer cell line induce tumor antigen-specific CTL responses against autologous breast cancer cells. Breast Cancer Res Treat 2007;105:277-86 [DOI] [PubMed] [Google Scholar]
- 30.Gabrilovich DI, Corak J, Ciernik IE, et al. Decreased antigen presentation by dendritic cells in patients with breast cancer. Clin Cancer Res 1997;3:483-90 [PubMed] [Google Scholar]
- 31.Lespagnard L, Gancberg D, Rouas G, et al. Tumor-infiltrating dendritic cells in adenocarcinomas of the breast: a study of 143 neoplasms with a correlation to usual prognostic factors and to clinical outcome. Int J Cancer 1999;84:309-14 [DOI] [PubMed] [Google Scholar]