

Abstract
Objective
Annual cancer incidence and mortality in 2008 were provided by National Central Cancer Registry in China, which data were collected from population-based cancer registries in 2011.
Methods
There were 56 registries submitted their data in 2008. After checking and evaluating the data quality, total 41 registries’ data were accepted and pooled for analysis. Incidence and mortality rates by area (urban or rural areas) were assessed, as well as the age- and sex-specific rates, age-standardized rates, proportions and cumulative rate.
Results
The coverage population of the 41 registries was 66,138,784 with 52,158,495 in urban areas and 13,980,289 in rural areas. There were 197,833 new cancer cases and 122,136 deaths in cancer with mortality to incidence ratio of 0.62. The morphological verified rate was 69.33%, and 2.23% of cases were identified by death certificate only. The crude cancer incidence rate in all areas was 299.12/100,000 (330.16/100,000 in male and 267.56/100,000 in female) and the age-standardized incidence rates by Chinese standard population (ASIRC) and world standard population (ASIRW) were 148.75/100,000 and 194.99/100,000, respectively. The cumulative incidence rate (0–74 years old) was of 22.27%. The crude incidence rate in urban areas was higher than that in rural areas. However, after adjusted by age, the incidence rate in urban was lower than that in rural. The crude cancer mortality was 184.67/100,000 (228.14/100,000 in male and 140.48/100,000 in female), and the age-standardized mortality rates by Chinese standard population (ASMRC) and by world population were 84.36/100,000 and 114.32/100,000, respectively. The cumulative mortality rate (0–74 years old) was of 12.89%. Age-adjusted mortality rates in urban areas were lower than that in rural areas. The most common cancer sites were lung, stomach, colon-rectum, liver, esophagus, pancreas, brain, lymphoma, breast and cervix which accounted for 75% of all cancer incidence. Lung cancer was the leading cause of cancer death, followed by gastric cancer, liver cancer, esophageal cancer, colorectal cancer and pancreas cancer, which accounted for 80% of all cancer deaths. The cancer spectrum varied by areas and sex in rural areas, cancers from digestive system were more common, such as esophageal cancer, gastric cancer and liver cancer, while incidence rates of lung cancer and colorectal cancer were much higher in urban areas. In addition, breast cancer was the most common cancer in urban women followed by liver cancer, gastric cancer and colorectal cancer.
Conclusion
Lung cancer, gastric cancer, colorectal cancer, liver cancer, esophageal cancer and female breast cancer contributed to the increased incidence of cancer, which should be paid more attention to in further national cancer prevention and control program. Different cancer control strategies should be carried out due to the varied cancer spectrum in different groups.
Key words: Cancer registry; Incidence; Mortality; Epidemiology, China
INTRODUCTION
Population-based cancer registries collect the data on cancer new cases and deaths from covered population to describe and surveille the cancer incidence, mortality and survival. The data from cancer registration can not only be utilized for plan, implement and evaluation on cancer prevention and control but also for scientific research. Since 2006 when Disease Prevention and Control Bureau, Ministry of Health of China started to publish cancer data annually, National Central Cancer Registry (NCCR) of China has been responsible for collecting data from all local registries, calculating the statistical items accurately, analyzing the data of cancer incident cases and deaths from registration areas, and then released the updated cancer statistics in annual cancer report. All the information has been very useful in scientific researches, clinical trials and decision of cancer prevention and control strategies.
MATERIALS AND METHODS
Data Source
There were 56 cancer registries from 19 provinces submitted cancer registration data in 2008, 8 registries more than last year. For total 56 registries, 38 registries were from local Centers for Disease Control and Prevention and 18 were from cancer institutes; 26 registries were located in urban areas and 30 were located in rural areas.
The coverage population of all 56 registries was 82,433,497 (41,621,780 men and 40,811,717 women), which accounted for 6.21% of whole national population by the end of 2008. The total cancer incident cases were 227,555 (127,765 for male and 99,790 for female) and deaths were 139,240 (87,349 for male and 51,891 for female), respectively.
Quality Control
Proportion of morphological verification (MV%), percentage of cancer cases identified with death certification only (DCO%), mortality to incidence ratio (M/I), percentage of uncertified cancer (UB%) and percentage of cancer with undefined or unknown primary site (secondary) (O&U%) were used to evaluate the completeness, validity and reliability of cancer statistics. According to NCCR acceptable criterion, the MV% should be higher than 66%, DCO% less than 15% and MI between 0.6 and 0.8.
The one of advantages of cancer registration data was timely report of cancer. However, for the completeness, validity and reliability of cancer statistics, the time gap between data updating and analyzing might exist[1]. NCCR ruled that every registry should upload the cancer registry data of 2008 before July 15th 2011, which was 30 months after cancer diagnosis.
Statistical Analysis
The quality of data was assessed based on “Guideline of Chinese Cancer Registration”[2] and referred to the criteria for “Cancer Incidence in Five Continents Volume IX”[3] by The International Agency for Research on Cancer (IARC)/The International Agency for Cancer Registry (IACR)[4-6]. Once the cancer registration data met the criteria of quality on completeness, comparability and validity, it would be accepted for final analysis.
Crude incidence and mortality rates in both rural and urban areas were calculated stratified by cancer type, sex, areas (urban or rural) and age-group (0, 1−4, 5−9, …, 80−84, 85 years old and above), age-standardized to the 1982 Chinese population and world Segi’s population. IARC-crgTools issued by IARC/ IACR[4-6] were used for data check and evaluation[7].
RESULTS
Data Pooling and Quality Evaluation
In 2008, 41 cancer registries’ data, including 19 from urban areas and 22 from rural areas, met the criteria for data quality and then were pooled for national annual report. The population covered by the 41 cancer registries was 66,138,784 (33,340,597 in male and 32,798,187 in female), with 52,158,495 in urban (78.86%) and 13,980,289 in rural (21.14%). The total new cancer cases and deaths were 197,833 and 122,136, respectively. Detailed information in each cancer registry is shown in Table 1.
Table 1. Distribution for total population, new case and death number in each registry in 2008.
| ID | Cancer registry | Category |
Population |
New cancer cases |
Cancer deaths |
||||||
|---|---|---|---|---|---|---|---|---|---|---|---|
| 1: urban 2: rural | Both sexes | Male | Female | Both sexes | Male | Female | Both sexes | Male | Female | ||
| 1 | Beijing | 1 | 7,513,532 | 3,796,097 | 3,717,435 | 22,536 | 11,504 | 11,032 | 13,097 | 7,617 | 5,480 |
| 2 | Shexian | 2 | 393,068 | 204,175 | 188,893 | 1,269 | 801 | 468 | 936 | 616 | 320 |
| 3 | Cixian | 2 | 629,362 | 320,489 | 308,873 | 1,839 | 1,091 | 748 | 1,300 | 807 | 493 |
| 4 | Yangcheng | 2 | 382,667 | 193,237 | 189,430 | 1,227 | 673 | 554 | 810 | 471 | 339 |
| 5 | Shenyang | 1 | 3,486,819 | 1,724,993 | 1,761,826 | 10,779 | 5,582 | 5,197 | 6,791 | 4,033 | 2,758 |
| 6 | Dalian | 1 | 2,286,743 | 1,145,030 | 1,141,713 | 8,964 | 4,642 | 4,322 | 4,684 | 2,906 | 1,778 |
| 7 | Anshan | 1 | 1,474,115 | 734,861 | 739,254 | 4,670 | 2,434 | 2,236 | 2,666 | 1,601 | 1,065 |
| 8 | Benxi | 1 | 958,034 | 477,602 | 480,432 | 2,422 | 1,295 | 1,127 | 1,516 | 937 | 579 |
| 9 | Dandong | 1 | 754,604 | 373,054 | 381,550 | 2,313 | 1,253 | 1,060 | 1,488 | 889 | 599 |
| 10 | Harbin-Daoli | 1 | 703,798 | 343,577 | 360,221 | 1,623 | 873 | 750 | 870 | 503 | 367 |
| 11 | Harbin-Nangang | 1 | 1,037,786 | 519,913 | 517,873 | 2,113 | 1,104 | 1,009 | 1,689 | 994 | 695 |
| 12 | Shanghai | 1 | 6,167,941 | 3,087,207 | 3,080,734 | 24,320 | 12,726 | 11,594 | 15,880 | 9,344 | 6,536 |
| 13 | Suzhou | 1 | 6,287,735 | 3,105,480 | 3,182,255 | 20,737 | 12,222 | 8,515 | 12,030 | 7,748 | 4,282 |
| 14 | Qidong | 2 | 1,116,272 | 550,234 | 566,038 | 3,754 | 2,317 | 1,437 | 2,802 | 1,827 | 975 |
| 15 | Haimen | 2 | 1,019,352 | 465,991 | 553,361 | 3,486 | 2,036 | 1,450 | 2,584 | 1,689 | 895 |
| 16 | Lianyungang | 1 | 808,784 | 412,365 | 396,419 | 1,791 | 1,007 | 784 | 1,143 | 688 | 455 |
| 17 | Huai’an-Chuzhou | 1 | 1,187,430 | 612,067 | 575,363 | 2,524 | 1,522 | 1,002 | 1,744 | 1,119 | 625 |
| 18 | Jinhu | 2 | 363,983 | 183,173 | 180,810 | 878 | 532 | 346 | 600 | 377 | 223 |
| 19 | Sheyang | 2 | 964,852 | 493,646 | 471,206 | 2,659 | 1,569 | 1,090 | 2,071 | 1,303 | 768 |
| 20 | Jianhu | 2 | 805,234 | 410,247 | 394,987 | 2,164 | 1,367 | 797 | 1,683 | 1,075 | 608 |
| 21 | Dafeng | 2 | 724,502 | 363,491 | 361,011 | 1,967 | 1,148 | 819 | 1,685 | 1,029 | 656 |
| 22 | Yangzhong | 2 | 273,434 | 135,115 | 138,319 | 1,061 | 556 | 505 | 850 | 506 | 344 |
| 23 | Taixing | 2 | 1,197,000 | 650,429 | 546,571 | 2,470 | 1,661 | 809 | 2,092 | 1,393 | 699 |
| 24 | Hangzhou | 1 | 6,737,379 | 3,408,365 | 3,329,014 | 19,657 | 10,987 | 8,670 | 11,484 | 7,401 | 4,083 |
| 25 | Jiaxing | 1 | 505,149 | 252,057 | 253,092 | 1,641 | 889 | 752 | 875 | 542 | 333 |
| 26 | Jiashan | 2 | 381,688 | 189,660 | 192,028 | 1,378 | 794 | 584 | 917 | 591 | 326 |
| 27 | Haining | 2 | 652,028 | 322,373 | 329,655 | 1,325 | 737 | 588 | 966 | 600 | 366 |
| 28 | Ma’anshan | 1 | 627,561 | 321,347 | 306,214 | 1,647 | 1,024 | 623 | 1,105 | 751 | 354 |
| 29 | Tongling | 1 | 411,795 | 211,367 | 200,428 | 926 | 555 | 371 | 694 | 473 | 221 |
| 30 | Changle | 2 | 670,256 | 352,984 | 317,272 | 1,494 | 898 | 596 | 825 | 562 | 263 |
| 31 | Linqu | 2 | 802,520 | 409,307 | 393,213 | 1,715 | 1,034 | 681 | 1,244 | 806 | 438 |
| 32 | Feicheng | 2 | 734,828 | 358,310 | 376,518 | 2,337 | 1,427 | 910 | 1,455 | 989 | 466 |
| 33 | Linzhou | 2 | 1,022,559 | 522,617 | 499,942 | 2,422 | 1,463 | 959 | 1,564 | 921 | 643 |
| 34 | Wuhan | 1 | 4,833,008 | 2,493,854 | 2,339,154 | 12,464 | 6,858 | 5,606 | 6,753 | 4,301 | 2,452 |
| 35 | Guangzhou | 1 | 3,926,921 | 1,997,570 | 1,929,351 | 13,298 | 7,191 | 6,107 | 6,319 | 3,982 | 2,337 |
| 36 | Sihui | 2 | 410,893 | 210,919 | 199,974 | 773 | 493 | 280 | 435 | 301 | 134 |
| 37 | Zhongshan | 1 | 1,457,901 | 728,359 | 729,542 | 3,050 | 1,805 | 1,245 | 2,048 | 1,372 | 676 |
| 38 | Fusui | 2 | 438,342 | 232,800 | 205,542 | 641 | 451 | 190 | 526 | 397 | 129 |
| 39 | Yanting | 2 | 607,497 | 314,950 | 292,547 | 2,280 | 1,462 | 818 | 1,805 | 1,150 | 655 |
| 40 | Gejiu | 2 | 389,952 | 196,206 | 193,746 | 548 | 330 | 218 | 299 | 216 | 83 |
| 41 | Wuwei-Liangzhou | 1 | 991,460 | 515,079 | 476,381 | 2,671 | 1,764 | 907 | 1,811 | 1,235 | 576 |
| Total | 66,138,784 | 33,340,597 | 32,798,187 | 197,833 | 110,077 | 87,756 | 122,136 | 76,062 | 46,074 | ||
The MV%, DCO%, and M/I ratio for the national pooled data was 69.33%, 2.23% and 0.62, respectively. The MV%, DCO%, and M/I ratio in cancer registries of urban areas were 70.53%, 2.49% and 0.59, respectively, whereas in rural areas, that were 64.22%, 1.12% and 0.73. The quality for each cancer registry in both urban and rural areas is presented in Table 2.
Table 2. Quality evaluation for China cancer registers in 2008.
| All areas |
Urban |
Rural |
|||||||
|---|---|---|---|---|---|---|---|---|---|
| MV% | DCO% | M/I | MV% | DCO% | M/I | MV% | DCO% | M/I | |
| Oral and pharyngeal | 84.54 | 1.33 | 0.45 | 83.74 | 1.52 | 0.44 | 90.38 | 0.00 | 0.58 |
| Nasopharynx | 75.09 | 1.62 | 0.56 | 74.83 | 1.93 | 0.56 | 76.44 | 0.00 | 0.60 |
| Esophagus | 78.63 | 1.95 | 0.78 | 73.50 | 2.26 | 0.78 | 83.91 | 1.63 | 0.77 |
| Stomach | 80.67 | 2.03 | 0.70 | 78.79 | 2.61 | 0.68 | 84.85 | 0.75 | 0.74 |
| Colon-rectum | 81.83 | 1.44 | 0.47 | 81.25 | 1.59 | 0.46 | 86.70 | 0.18 | 0.55 |
| Liver | 31.35 | 4.05 | 0.92 | 36.49 | 5.06 | 0.92 | 17.91 | 1.42 | 0.91 |
| Gallbladder | 50.97 | 3.20 | 0.76 | 52.08 | 3.37 | 0.75 | 41.67 | 1.72 | 0.79 |
| Pancreas | 41.53 | 4.78 | 0.88 | 43.24 | 5.34 | 0.88 | 31.71 | 1.54 | 0.93 |
| Throat | 81.61 | 2.17 | 0.55 | 82.79 | 2.31 | 0.54 | 73.46 | 1.23 | 0.65 |
| Lung | 50.84 | 3.45 | 0.84 | 54.37 | 3.87 | 0.84 | 32.96 | 1.34 | 0.84 |
| Other organs in chest | 60.97 | 2.72 | 0.54 | 63.61 | 2.84 | 0.52 | 35.48 | 1.61 | 0.69 |
| Bone | 56.70 | 4.33 | 0.76 | 58.63 | 5.04 | 0.68 | 50.00 | 1.87 | 1.03 |
| Skin melanoma | 93.02 | 0.84 | 0.59 | 92.83 | 0.65 | 0.64 | 94.12 | 1.96 | 0.33 |
| Breast | 91.92 | 0.44 | 0.22 | 92.03 | 0.46 | 0.21 | 90.86 | 0.27 | 0.31 |
| Cervix | 91.53 | 0.65 | 0.24 | 91.38 | 0.73 | 0.22 | 92.08 | 0.35 | 0.31 |
| uterus | 88.22 | 1.12 | 0.29 | 88.30 | 1.24 | 0.27 | 87.66 | 0.26 | 0.46 |
| Ovary | 82.64 | 0.82 | 0.42 | 82.57 | 0.92 | 0.42 | 83.27 | 0.00 | 0.43 |
| Prostate | 74.64 | 0.95 | 0.37 | 74.85 | 1.02 | 0.36 | 71.71 | 0.00 | 0.49 |
| Didymus | 87.27 | 0.91 | 0.17 | 86.41 | 0.97 | 0.16 | 100.00 | 0.00 | 0.43 |
| Kidney | 78.81 | 1.06 | 0.31 | 79.73 | 1.09 | 0.30 | 61.11 | 0.46 | 0.42 |
| Bladder | 80.24 | 1.01 | 0.35 | 80.65 | 1.10 | 0.33 | 76.61 | 0.20 | 0.50 |
| Brain | 52.66 | 3.08 | 0.57 | 57.22 | 3.22 | 0.53 | 29.70 | 2.33 | 0.78 |
| Thyroid gland | 89.33 | 0.32 | 0.07 | 89.32 | 0.32 | 0.07 | 89.50 | 0.25 | 0.12 |
| Lymphoma | 92.87 | 0.54 | 0.55 | 93.39 | 0.60 | 0.53 | 89.19 | 0.17 | 0.69 |
| Leukemia | 94.57 | 1.50 | 0.69 | 94.88 | 1.69 | 0.67 | 92.96 | 0.49 | 0.79 |
| Other cancers | 68.50 | 2.64 | 0.53 | 68.26 | 2.54 | 0.53 | 70.58 | 3.55 | 0.57 |
| Total | 69.33 | 2.23 | 0.62 | 70.53 | 2.49 | 0.59 | 64.22 | 1.12 | 0.73 |
Main Results Of Cancer (ICD10: C00−C97) In China Registries, 2008
Incidence Rate Of All Cancers In Registration Areas
The crude incidence rate of all cancers in registration areas was 299.12/100,000 in 2008 (330.16/ 100,000 in males and 267.56/100,000 in females). The age-standardized incidence rate was 148.75/100,000 and 194.99/100,000 by China (ASIRC) and World population (ASIRW), respectively. Among the patients aged 0–74 years, the cumulative incidence rate was 22.27%. The crude cancer incidence rate for both males and females in urban areas was higher than that in rural areas. While, the age-standardized rates and cumulative incidence rate in urban areas were lower than that in rural areas for all and males. But for females, the age-standardized rates and cumulative incidence rate were higher in urban than in rural areas (Table 3).
Table 3. The incidence of cancer (ICD10: C00−C97) register in China in 2008.
| Areas | Genders | Cancer cases | Crude incidence (1/105) | ASIRC* (1/105) | ASIRW** (1/105) | Cumulative rate 0.74 (%) |
|---|---|---|---|---|---|---|
| All areas | Both | 197,833 | 299.12 | 148.75 | 194.99 | 22.27 |
| Male | 110,077 | 330.16 | 167.11 | 223.68 | 25.81 | |
| Female | 87,756 | 267.56 | 132.69 | 170.43 | 18.98 | |
| Urban | Both | 160,146 | 307.04 | 148.64 | 194.52 | 21.92 |
| Male | 87,237 | 332.20 | 162.71 | 218.04 | 24.80 | |
| Female | 72,909 | 281.52 | 136.89 | 175.18 | 19.30 | |
| Rural | Both | 37,687 | 269.57 | 151.02 | 198.33 | 23.83 |
| Male | 22,840 | 322.58 | 186.77 | 247.55 | 30.08 | |
| Female | 14,847 | 215.18 | 117.19 | 152.34 | 17.74 |
*Age-standardized incidence rate (China population); **Age-standardized incidence rate (World population).
Age-Specific Incidence Rate in Cancer Registration Areas
Table 4 shows the age-specific incidence rates for all cancer sites by sex and region. Cancer incidence was relatively lower before 39 years old, then increased dramatically after 40 years old and finally peaked after 85 years old (Table 4, Figure 1). The pattern was similar between urban and rural areas. However, the incidence peaked in the age group of 80 years and then decreased after 85 years in rural area, while kept increased and peaked after 85 years old in urban areas.
Table 4. Age-specific incidence rate for all cancers (ICD10: C00−C97) in cancer registration areas in 2008 (1/105).
| Age groups | All areas |
Urban |
Rural |
||||||
|---|---|---|---|---|---|---|---|---|---|
| Both | Male | Female | Both | Male | Female | Both | Male | Female | |
| Total | 299.12 | 330.16 | 267.56 | 307.04 | 332.20 | 281.52 | 269.57 | 322.58 | 215.18 |
| 0– | 20.91 | 23.01 | 18.54 | 25.90 | 28.50 | 23.03 | 6.97 | 8.08 | 5.67 |
| 1– | 13.19 | 14.47 | 11.75 | 15.32 | 17.02 | 13.46 | 7.04 | 7.32 | 6.70 |
| 5– | 10.61 | 9.65 | 11.68 | 13.59 | 12.14 | 15.20 | 3.04 | 3.39 | 2.64 |
| 10– | 7.55 | 7.23 | 7.90 | 8.71 | 8.76 | 8.66 | 4.94 | 3.81 | 6.18 |
| 15– | 12.73 | 12.77 | 12.69 | 13.98 | 13.63 | 14.35 | 8.68 | 10.04 | 7.20 |
| 20– | 16.21 | 14.16 | 18.40 | 16.79 | 14.26 | 19.52 | 13.42 | 13.69 | 13.15 |
| 25– | 29.26 | 23.82 | 34.90 | 32.39 | 26.22 | 38.81 | 16.55 | 14.03 | 19.14 |
| 30– | 48.35 | 36.43 | 60.43 | 53.26 | 38.26 | 68.46 | 33.06 | 30.73 | 35.41 |
| 35– | 92.13 | 72.02 | 112.35 | 97.17 | 72.45 | 122.02 | 74.58 | 70.51 | 78.69 |
| 40– | 159.76 | 130.96 | 189.34 | 159.64 | 122.03 | 198.25 | 160.23 | 164.30 | 156.04 |
| 45– | 241.29 | 212.68 | 270.96 | 249.05 | 210.68 | 288.97 | 208.78 | 221.11 | 196.15 |
| 50– | 394.95 | 404.10 | 385.57 | 391.50 | 386.71 | 396.41 | 410.89 | 483.87 | 335.09 |
| 55– | 539.31 | 607.46 | 470.76 | 514.03 | 558.99 | 469.07 | 653.36 | 822.34 | 478.50 |
| 60– | 695.32 | 844.42 | 548.53 | 658.98 | 786.43 | 534.82 | 840.17 | 1,069.62 | 604.61 |
| 65– | 925.51 | 1,158.75 | 705.19 | 904.85 | 1,119.22 | 705.03 | 1,004.85 | 1,305.66 | 705.82 |
| 70– | 1,266.38 | 1,611.62 | 953.37 | 1,253.15 | 1,571.79 | 964.18 | 1,327.36 | 1,795.38 | 903.59 |
| 75– | 1,518.47 | 1,987.50 | 1,109.88 | 1,519.78 | 1,969.10 | 1,123.74 | 1,512.03 | 2,081.18 | 1,044.00 |
| 80– | 1,603.61 | 2,164.98 | 1,173.61 | 1,634.46 | 2,197.32 | 1,193.49 | 1,456.77 | 1,998.95 | 1,084.09 |
| 85– | 1,755.15 | 2,566.22 | 1,269.67 | 1,893.11 | 2,761.18 | 1,360.73 | 1,116.07 | 1,579.73 | 868.57 |
Figure 1.
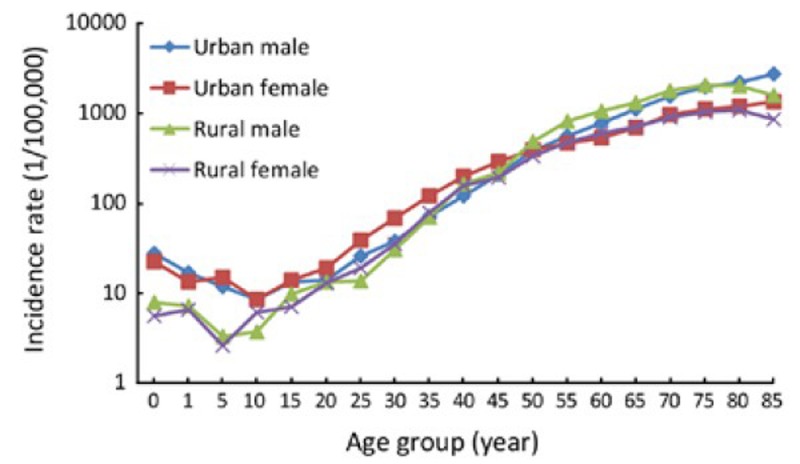
Age-specific cancer incidence rates in urban and rural areas, 2008
Comparing the age-specific incidence rate between urban and rural areas, we found that, in males, the cancer incidence before 39 years and after 80 years was higher in urban areas than that in rural areas, but lower in the age-group of 40−79 years. However, in females, the incidence before 49 years and after 70 years was higher in urban than that in rural areas, while that was opposite in the age group of 50−69 years (Table 4, Figure 1).
Mortality in Cancer Registration Areas
The crude mortality in cancer registration areas was 184.67/100,000 (228.14/100,000 in male and 140.48/ 100,000 in female). The age-standardized rates by Chinese population and World population were 84.36/100,000 and 114.32/100,000, respectively. The cumulative mortality (0−74 years) rate was 12.89%. Rural areas had higher cancer mortality of 196.34/ 100,000 than that of urban areas (181.54/100,000), though the incidence in rural was lower than that in urban. After age standardization, the mortality rate in rural was still higher than that in urban (Table 5).
Table 5. Cancer mortality in cancer registration areas in 2008.
| Areas | Sex | Deaths | Mortality rate (1/105) | ASIRC (1/105) | ASIRW (1/105) | Cumulative rate 0.74 (%) |
|---|---|---|---|---|---|---|
| All areas | Both | 122,136 | 184.67 | 84.36 | 114.32 | 12.89 |
| Male | 76,062 | 228.14 | 109.78 | 149.91 | 16.88 | |
| Female | 46,074 | 140.48 | 60.67 | 81.92 | 9.08 | |
| Urban | Both | 94,687 | 181.54 | 79.21 | 107.76 | 11.92 |
| Male | 58,436 | 222.53 | 102.17 | 140.13 | 15.47 | |
| Female | 36,251 | 139.97 | 57.92 | 78.50 | 8.56 | |
| Rural | Both | 27,449 | 196.34 | 106.05 | 141.69 | 16.98 |
| Male | 17,626 | 248.94 | 141.40 | 190.00 | 22.74 | |
| Female | 9,823 | 142.36 | 72.50 | 96.58 | 11.35 |
Age-Specific Mortality Rate in Cancer Registration Areas
Table 6 shows the age-specific mortality rates for all cancers by sex and area. The cancer mortality was relatively lower before 49 years. The rate was dramatically increasing after 50 years, and reached peak after 85 years. The mortality rate was highest in the age-group of 80–84 years in rural areas. The acceleration trend of age-specific mortality was shown in both urban and rural, with dramatical increase after 45 years in male and after 50 years in female, respectively.
Table 6. Age-specific mortality in cancer registration areas in 2008 (1/105).
| Age groups | All areas |
Urban |
Rural |
||||||
|---|---|---|---|---|---|---|---|---|---|
| Both | Male | Female | Both | Male | Female | Both | Male | Female | |
| Total | 184.67 | 228.14 | 140.48 | 181.54 | 222.53 | 139.97 | 196.34 | 248.94 | 142.36 |
| 0– | 7.35 | 6.08 | 8.78 | 8.43 | 5.94 | 11.19 | 4.36 | 6.47 | 1.89 |
| 1– | 5.02 | 4.66 | 5.42 | 4.68 | 3.98 | 5.44 | 6.00 | 6.55 | 5.36 |
| 5– | 3.12 | 3.12 | 3.13 | 3.53 | 3.53 | 3.54 | 2.07 | 2.09 | 2.06 |
| 10– | 3.70 | 4.26 | 3.10 | 3.87 | 4.79 | 2.89 | 3.32 | 3.08 | 3.59 |
| 15– | 4.90 | 5.44 | 4.34 | 5.11 | 5.66 | 4.53 | 4.24 | 4.74 | 3.70 |
| 20– | 5.59 | 6.32 | 4.81 | 4.91 | 5.54 | 4.23 | 8.88 | 10.21 | 7.52 |
| 25– | 6.69 | 6.99 | 6.37 | 6.33 | 6.48 | 6.18 | 8.14 | 9.11 | 7.13 |
| 30– | 13.80 | 15.57 | 12.01 | 12.32 | 13.47 | 11.15 | 18.41 | 22.12 | 14.66 |
| 35– | 29.65 | 34.64 | 24.63 | 26.95 | 30.52 | 23.36 | 39.04 | 48.97 | 29.04 |
| 40– | 60.51 | 71.97 | 48.73 | 53.33 | 61.63 | 44.81 | 87.32 | 110.58 | 63.40 |
| 45– | 99.85 | 124.84 | 73.93 | 97.44 | 121.03 | 72.90 | 109.95 | 140.92 | 78.24 |
| 50– | 185.53 | 239.74 | 129.92 | 173.23 | 223.03 | 122.29 | 242.38 | 316.42 | 165.48 |
| 55– | 270.24 | 353.26 | 186.72 | 241.38 | 314.49 | 168.28 | 400.39 | 525.14 | 271.30 |
| 60– | 394.50 | 527.86 | 263.22 | 348.27 | 461.23 | 238.23 | 578.78 | 786.54 | 365.47 |
| 65– | 592.62 | 789.46 | 406.67 | 547.58 | 722.75 | 384.29 | 765.56 | 1,037.38 | 495.35 |
| 70– | 902.47 | 1,188.46 | 643.19 | 854.84 | 1,115.64 | 618.32 | 1,122.06 | 1,524.42 | 757.74 |
| 75– | 1,256.99 | 1,668.56 | 898.45 | 1,233.20 | 1,620.73 | 891.63 | 1,373.64 | 1,912.06 | 930.89 |
| 80– | 1,508.86 | 2,022.38 | 1,115.51 | 1,519.41 | 2,028.15 | 1,120.83 | 1,458.67 | 1,992.74 | 1,091.56 |
| 85– | 1,511.03 | 2,152.95 | 1,126.80 | 1,588.72 | 2,245.73 | 1,185.79 | 1,151.14 | 1,683.46 | 866.99 |
In general, the age-specific mortality in urban areas was lowerer than that in rural in most of age-groups. The age-specific mortality in urban was about 20% lower than that in rural in the age-group of 20−79 years. Exception can be observed in the age-group of 10−14 years and after 80 years in which the mortality in urban was higher than that in rural. The mortality fluctuated violently before 20 year-old (Table 6, Figure 2).
Figure 2.

Age-specific cancer mortality rates in urban and rural areas, 2008
Major Cancer in Cancer Registration Areas 2008
Cancer Incidence Rates For the 10 Most Common Cancers in Cancer Registration Areas, 2008
Lung cancer was the most common cancer in cancer registration areas, followed by stomach cancer, colorectal cancer, liver cancer and breast cancer. The 10 most common cancers accounted for 75.94% of all new cases with 83.68% in male and 76.71% in female, respectively. Lung cancer was the most frequently diagnosed cancers in male followed by stomach cancer, liver cancer, colon-rectum cancer and esophageal cancer in male. And breast cancer was the most frequently diagnosed cancers followed by lung cancer, colon-rectum cancer, stomach cancer and liver cancer in female (Table 7).
Table 7. Top 10 cancer incidence rates in cancer registration areas in 2008.
| Rank | Site | Incidence rate (1/105) | % | ASIRC* (1/105) |
|---|---|---|---|---|
| Both | ||||
| 1 | Lung | 54.75 | 18.30 | 24.98 |
| 2 | Stomach | 37.88 | 12.66 | 17.89 |
| 3 | Colon-rectum | 31.39 | 10.49 | 14.62 |
| 4 | Liver | 28.17 | 9.42 | 13.99 |
| 5 | Breast | 23.82 | 7.96 | 12.74 |
| 6 | Esophagus | 20.85 | 6.97 | 9.88 |
| 7 | Pancreas | 8.55 | 2.86 | 3.83 |
| 8 | Bladder | 7.49 | 2.50 | 3.29 |
| 9 | Lymphoma | 7.21 | 2.41 | 4.04 |
| 10 | Brain | 7.03 | 2.35 | 4.47 |
| Top 10 | 227.15 | 75.94 | 109.73 | |
| Male | ||||
| 1 | Lung | 73.12 | 22.15 | 35.02 |
| 2 | Stomach | 51.63 | 15.64 | 25.41 |
| 3 | Liver | 40.99 | 12.41 | 21.30 |
| 4 | Colon-rectum | 33.93 | 10.28 | 16.59 |
| 5 | Esophagus | 28.66 | 8.68 | 14.26 |
| 6 | Bladder | 11.41 | 3.46 | 5.30 |
| 7 | Prostate | 11.00 | 3.33 | 4.57 |
| 8 | Pancreas | 9.26 | 2.81 | 4.42 |
| 9 | Lymphoma | 8.28 | 2.51 | 4.74 |
| 10 | Kidney | 8.01 | 2.42 | 4.13 |
| Top 10 | 276.29 | 83.68 | 135.74 | |
| Female | ||||
| 1 | Breast | 47.64 | 17.81 | 25.26 |
| 2 | Lung | 36.08 | 13.49 | 15.66 |
| 3 | Colon-rectum | 28.80 | 10.76 | 12.78 |
| 4 | Stomach | 23.91 | 8.94 | 10.82 |
| 5 | Liver | 15.14 | 5.66 | 6.81 |
| 6 | Esophagus | 12.92 | 4.83 | 5.69 |
| 7 | Cervix | 12.24 | 4.58 | 6.87 |
| 8 | Thyroid gland | 10.49 | 3.92 | 6.55 |
| 9 | Uterus | 9.52 | 3.56 | 5.00 |
| 10 | Ovary | 8.50 | 3.18 | 4.76 |
| Top 10 | 205.26 | 76.71 | 100.21 | |
*Age-standardized incidence rate (China population).
Cancer Mortality Rates for the 10 Most Common Cancers in Cancer Registration Areas, 2008
Lung cancer was the leading cause of death in cancer registration areas followed by stomach cancer, liver cancer, esophageal cancer and colon-rectum cancer. The 10 most common cancer of death causes accounted for 83.54% of all cancer death. In male, lung cancer was the leading cause followed by liver cancer, stomach cancer, esophageal cancer and colon-rectum cancer; while in female, lung cancer was still the leading cause followed by stomach cancer, liver cancer, colon-rectum cancer and breast cancer (Table 8).
Table 8. The 10 most common cancer mortality rates in cancer registration areas in 2008.
| Rank | Site | Mortality rate (1/105) | % | ASIRC* (1/105) |
|---|---|---|---|---|
| Both | ||||
| 1 | Lung | 46.07 | 24.95 | 20.09 |
| 2 | Stomach | 26.58 | 14.39 | 11.83 |
| 3 | Liver | 25.84 | 13.99 | 12.61 |
| 4 | Esophagus | 16.24 | 8.79 | 7.34 |
| 5 | Colon-rectum | 14.82 | 8.02 | 6.18 |
| 6 | Pancreas | 7.56 | 4.09 | 3.32 |
| 7 | Breast | 5.23 | 2.83 | 2.52 |
| 8 | Leukemia | 3.99 | 2.16 | 2.71 |
| 9 | Brain | 3.99 | 2.16 | 2.34 |
| 10 | lymphoma | 3.96 | 2.14 | 1.96 |
| Top 10 | 154.27 | 83.54 | 70.88 | |
| Male | ||||
| 1 | Lung | 62.47 | 27.38 | 28.96 |
| 2 | Liver | 37.40 | 16.39 | 19.23 |
| 3 | Stomach | 35.76 | 15.67 | 16.90 |
| 4 | Esophagus | 22.44 | 9.84 | 10.84 |
| 5 | Colon-rectum | 15.64 | 6.85 | 6.99 |
| 6 | Pancreas | 8.10 | 3.55 | 3.83 |
| 7 | lymphoma | 4.64 | 2.04 | 2.36 |
| 8 | Brain | 4.43 | 1.94 | 2.66 |
| 9 | Leukemia | 4.39 | 1.92 | 2.98 |
| 10 | Prostate | 4.07 | 1.78 | 1.50 |
| Top 10 | 199.33 | 87.37 | 96.24 | |
| Female | ||||
| 1 | Lung | 29.39 | 20.93 | 11.91 |
| 2 | Stomach | 17.25 | 12.28 | 7.13 |
| 3 | Liver | 14.08 | 10.03 | 6.13 |
| 4 | Colon-rectum | 13.98 | 9.95 | 5.44 |
| 5 | Breast | 10.41 | 7.41 | 4.90 |
| 6 | Esophagus | 9.94 | 7.07 | 4.02 |
| 7 | Pancreas | 7.01 | 4.99 | 2.83 |
| 8 | Gallbladder | 4.12 | 2.93 | 1.58 |
| 9 | Leukemia | 3.60 | 2.56 | 2.44 |
| 10 | Brain | 3.55 | 2.52 | 2.03 |
| Top 10 | 113.33 | 80.67 | 48.41 | |
*Age-standardized mortality rate (China population).
Incidence of the 10 Most Common Cancer in Urban Areas, 2008
In urban areas, lung cancer was the most frequently diagnosed cancers, followed by colon-rectum cancer, stomach cancer, breast cancer and liver cancer. The 10 most common cancer accounted for 73.91% (82.12% in male and 76.02% in female) of all cancers. The most common sites of cancer were lung, stomach, colon-rectum, liver and esophagus in male, while were breast, lung, colon-rectum, stomach and liver in female (Table 9).
Table 9. The 10 most common cancer incidence rates in urban areas in 2008.
| Rank | Site | Incidence rate (1/105) | % | ASIRC* (1/105) |
|---|---|---|---|---|
| Both | ||||
| 1 | Lung | 57.96 | 18.88 | 25.44 |
| 2 | Colon-rectum | 35.53 | 11.57 | 15.99 |
| 3 | Stomach | 33.12 | 10.79 | 14.97 |
| 4 | Breast | 27.37 | 8.91 | 14.31 |
| 5 | Liver | 25.84 | 8.42 | 12.32 |
| 6 | Esophagus | 13.41 | 4.37 | 6.01 |
| 7 | Pancreas | 9.22 | 3.00 | 3.98 |
| 8 | Prostate | 8.55 | 2.78 | 3.63 |
| 9 | Lymphoma | 8.03 | 2.62 | 4.45 |
| 10 | Kidney | 7.91 | 2.58 | 3.90 |
| Top 10 | 226.94 | 73.91 | 105.01 | |
| Male | ||||
| 1 | Lung | 76.66 | 23.08 | 35.28 |
| 2 | Stomach | 44.81 | 13.49 | 21.04 |
| 3 | Colon-rectum | 38.57 | 11.61 | 18.22 |
| 4 | Liver | 37.81 | 11.38 | 18.92 |
| 5 | Esophagus | 19.88 | 5.98 | 9.40 |
| 6 | Bladder | 13.07 | 3.93 | 5.87 |
| 7 | Prostate | 13.01 | 3.92 | 5.19 |
| 8 | Pancreas | 10.10 | 3.04 | 4.66 |
| 9 | Kidney | 9.68 | 2.92 | 4.87 |
| 10 | Lymphoma | 9.23 | 2.78 | 5.23 |
| Top 10 | 272.82 | 82.12 | 128.67 | |
| Female | ||||
| 1 | Breast | 54.69 | 19.43 | 28.35 |
| 2 | Lung | 38.99 | 13.85 | 16.33 |
| 3 | Colon-rectum | 32.45 | 11.53 | 13.92 |
| 4 | Stomach | 21.26 | 7.55 | 9.31 |
| 5 | Liver | 13.71 | 4.87 | 5.87 |
| 6 | Uterus | 12.19 | 4.33 | 6.79 |
| 7 | Thyroid gland | 12.11 | 4.30 | 7.52 |
| 8 | Cervix | 10.56 | 3.75 | 5.40 |
| 9 | Ovary | 9.70 | 3.45 | 5.35 |
| 10 | Pancreas | 8.33 | 2.96 | 3.34 |
| Top 10 | 214.01 | 76.02 | 102.19 | |
*Age-standardized incidence rate (China population).
Mortality of the 10 Most Common Cancer in Urban Areas, 2008
Lung cancer was the leading cause of cancer death in urban registration areas for both men and women. The top 10 cancers accounted for 81.87% (85.75% for male and 79.66% for female) of all mortality induced by malignant tumors. Other cancer types with high mortality in men were liver cancer, stomach cancer, colorectal cancer and esophageal cancer. In women, colorectal cancer was the second cause of cancer death, followed by stomach cancer, liver cancer and breast cancer (Table 10).
Table 10. The 10 most common cancer mortality rates in urban areas in 2008.
| Rank | Site | Mortality rate (1/105) | % | ASIRC* (1/105) |
|---|---|---|---|---|
| Both | ||||
| 1 | Lung | 48.76 | 26.86 | 20.33 |
| 2 | Liver | 23.81 | 13.12 | 11.08 |
| 3 | Stomach | 22.64 | 12.47 | 9.53 |
| 4 | Colon-rectum | 16.44 | 9.06 | 6.57 |
| 5 | Esophagus | 10.51 | 5.79 | 4.49 |
| 6 | Pancreas | 8.09 | 4.45 | 3.43 |
| 7 | Breast | 5.77 | 3.18 | 2.67 |
| 8 | lymphoma | 4.24 | 2.34 | 2.04 |
| 9 | Gallbladder | 4.23 | 2.33 | 1.66 |
| 10 | Leukemia | 4.14 | 2.28 | 2.72 |
| Top 10 | 148.63 | 81.87 | 64.52 | |
| Male | ||||
| 1 | Lung | 65.62 | 29.49 | 29.09 |
| 2 | Liver | 34.41 | 15.46 | 16.93 |
| 3 | Stomach | 30.46 | 13.69 | 13.62 |
| 4 | Colon-rectum | 17.47 | 7.85 | 7.47 |
| 5 | Esophagus | 15.61 | 7.01 | 7.15 |
| 6 | Pancreas | 8.68 | 3.90 | 3.96 |
| 7 | lymphoma | 4.98 | 2.24 | 2.47 |
| 8 | Bladder | 4.69 | 2.11 | 1.63 |
| 9 | Leukemia | 4.59 | 2.06 | 2.99 |
| 10 | Brain | 4.31 | 1.94 | 2.54 |
| Top 10 | 190.81 | 85.75 | 87.86 | |
| Female | ||||
| 1 | Lung | 31.66 | 22.62 | 12.27 |
| 2 | Colon-rectum | 15.39 | 11.00 | 5.76 |
| 3 | Stomach | 14.71 | 10.51 | 5.76 |
| 4 | Liver | 13.07 | 9.34 | 5.37 |
| 5 | Breast | 11.48 | 8.20 | 5.20 |
| 6 | Pancreas | 7.49 | 5.35 | 2.92 |
| 7 | Esophagus | 5.35 | 3.82 | 1.97 |
| 8 | Gallbladder | 4.65 | 3.32 | 1.71 |
| 9 | Ovary | 4.03 | 2.88 | 1.89 |
| 10 | Leukemia | 3.68 | 2.63 | 2.46 |
| Top 10 | 111.51 | 79.66 | 45.30 | |
*Age-standardized mortality rate (China population).
Incidence of the 10 Most Common Cancer in Rural Areas, 2008
Table 11 shows the 10 most common cancer incidence rate in rural areas. Stomach cancer was the most frequently diagnosed cancers, followed by esophagus cancer, lung cancer, liver cancer and colorectal cancer. The 10 most common cancers accounted for 86.24% (92.27% in male and 83.89% in female) of all registered new cases. The most common sites of cancer were stomach, esophagus, lung, liver and colon-rectum in male, while were esophagus, stomach, lung, breast and liver cancer in female.
Table 11. The 10 most common cancer incidence rates in rural areas 2008.
| Rank | Site | Incidence rate (1/105) | % | ASIRC* (1/105) |
|---|---|---|---|---|
| Both | ||||
| 1 | Stomach | 55.66 | 20.65 | 30.46 |
| 2 | Esophagus | 48.60 | 18.03 | 26.51 |
| 3 | Lung | 42.80 | 15.88 | 22.96 |
| 4 | Liver | 36.87 | 13.68 | 20.98 |
| 5 | Colon-rectum | 15.92 | 5.91 | 8.70 |
| 6 | Pancreas | 10.56 | 3.92 | 6.27 |
| 7 | Brain | 6.14 | 2.28 | 3.67 |
| 8 | Leukemia | 6.02 | 2.23 | 3.15 |
| 9 | Breast | 5.51 | 2.05 | 3.61 |
| 10 | Lymphoma | 4.37 | 1.62 | 3.45 |
| Top 10 | 232.47 | 86.24 | 129.77 | |
| Male | ||||
| 1 | Stomach | 76.95 | 23.85 | 43.97 |
| 2 | Lung | 61.23 | 18.98 | 34.99 |
| 3 | Liver | 59.97 | 18.59 | 33.77 |
| 4 | Esophagus | 52.78 | 16.36 | 31.13 |
| 5 | Colon-rectum | 16.74 | 5.19 | 9.59 |
| 6 | Pancreas | 6.17 | 1.91 | 3.40 |
| 7 | Brain | 5.92 | 1.83 | 4.02 |
| 8 | Leukemia | 5.28 | 1.64 | 2.86 |
| 9 | Lymphoma | 4.73 | 1.47 | 2.94 |
| 10 | Bladder | 4.65 | 1.44 | 3.55 |
| Top 10 | 294.41 | 91.27 | 170.23 | |
| Female | ||||
| 1 | Esophagus | 35.65 | 16.57 | 35.65 |
| 2 | Stomach | 33.83 | 15.72 | 33.83 |
| 3 | Lung | 25.17 | 11.70 | 25.17 |
| 4 | Liver | 21.17 | 9.84 | 21.17 |
| 5 | Colon-rectum | 20.54 | 9.54 | 20.54 |
| 6 | Breast | 15.09 | 7.01 | 15.09 |
| 7 | Pancreas | 12.45 | 5.79 | 12.45 |
| 8 | Cervix | 5.87 | 2.73 | 5.87 |
| 9 | Brain | 5.64 | 2.62 | 5.64 |
| 10 | Leukemia | 5.10 | 2.37 | 5.10 |
| Top 10 | 180.51 | 83.89 | 180.51 | |
*Age-standardized incidence rate (China population).
Mortality of the 10 Most Common Cancer in Rural Areas, 2008
Stomach cancer was the leading cause of cancer death in rural registration areas for both men and women. The 10 most common cancers of death accounted for 89.92% (93.11% in male and 87.03% in female) of all cancer mortality. The other cancer types with high mortality were lung cancer, liver cancer, esophageal cancer and colorectal cancer in male, and lung cancer, liver cancer, colorectal cancer, and breast cancer in female (Table 12).
Table 12. The 10 most common cancer mortality rates in rural areas 2008.
| Rank | Site | Mortality rate (1/105) | % | ASIRC* (1/105) |
|---|---|---|---|---|
| Both | ||||
| 1 | Stomach | 41.29 | 21.03 | 21.71 |
| 2 | Esophagus | 37.60 | 19.15 | 19.64 |
| 3 | Lung | 36.03 | 18.35 | 18.85 |
| 4 | Liver | 33.38 | 17.00 | 18.93 |
| 5 | Colon-rectum | 8.76 | 4.46 | 4.42 |
| 6 | Pancreas | 5.59 | 2.85 | 2.86 |
| 7 | Brain | 4.31 | 2.20 | 2.81 |
| 8 | Leukemia | 3.46 | 1.76 | 2.68 |
| 9 | Breast | 3.23 | 1.64 | 1.84 |
| 10 | Lymphoma | 2.89 | 1.47 | 1.64 |
| Top 10 | 176.54 | 89.92 | 95.38 | |
| Male | ||||
| 1 | Stomach | 55.42 | 22.26 | 30.89 |
| 2 | Lung | 50.79 | 20.40 | 28.10 |
| 3 | Liver | 48.49 | 19.48 | 28.55 |
| 4 | Esophagus | 47.78 | 19.19 | 26.67 |
| 5 | Colon-rectum | 8.84 | 3.55 | 4.83 |
| 6 | Pancreas | 5.97 | 2.40 | 3.27 |
| 7 | Brain | 4.89 | 1.96 | 3.20 |
| 8 | Leukemia | 3.63 | 1.46 | 2.92 |
| 9 | Lymphoma | 3.38 | 1.36 | 1.94 |
| 10 | Bladder | 2.61 | 1.05 | 1.30 |
| Top 10 | 231.80 | 93.11 | 131.67 | |
| Female | ||||
| 1 | Esophagus | 27.16 | 19.08 | 12.95 |
| 2 | Stomach | 26.78 | 18.81 | 13.08 |
| 3 | Lung | 20.88 | 14.67 | 10.26 |
| 4 | Liver | 17.88 | 12.56 | 9.32 |
| 5 | Colon-rectum | 8.67 | 6.09 | 4.05 |
| 6 | Breast | 6.41 | 4.50 | 3.59 |
| 7 | Pancreas | 5.20 | 3.65 | 2.45 |
| 8 | Cervix | 3.90 | 2.74 | 2.20 |
| 9 | Brain | 3.72 | 2.62 | 2.42 |
| 10 | Leukemia | 3.29 | 2.31 | 2.44 |
| Top 10 | 123.90 | 87.03 | 62.78 | |
*Age-standardized mortality rate (China population).
DISCUSSION
Cancer Burden in Cancer Registration Areas
In 2008, the crude incidence rate for all cancers in registration areas was 299.12/100,000 with the ASIRC of 148.75/100,000. The incidence was higher in urban areas (307.04/100,000 and 148.64/100,000 for crude rate and ASIRC) than in rural areas (269.57/100,000 and 151.02/100,000 for crude rate and ASIRC). The incidence in urban areas was higher than that in rural areas. But the ASIRC, ASIRW and the accumulated rate were higher in rural areas than in urban areas for all and males, but opposite for females.
The crude mortality in cancer registration areas was 184.67/100,000 and the mortality rate was higher in rural areas (196.34/100,000) than in urban areas (181.54/100,000). But after standardization by Chinese population, the morality was 79.21/100,000 in urban areas, which was lower than that in rural areas (106.06/100,000).
Lung cancer, stomach cancer, colorectal cancer, liver cancer, breast cancer, esophagus cancer, pancreas cancer, brain cancer and lymphoma were the most common cancer in cancer registration areas, which accounted for more than 75% new cases, and were the major causes (more than 80%) of cancer death in China in 2008.
The incidence and mortality varied greatly by sex and region. The 5 most common sites of cancer in male in urban areas were lung, stomach, colon-rectum, liver cancer and esophagus, with lung cancer and liver cancer being the most leading causes of cancer death; while, in rural areas the most common sites of cancer were stomach and esophagus, followed by lung, liver and colon-rectum, with the stomach and esophagus cancer being the leading causes for cancer death. In female, the 5 most common sites of cancer were lung, colon-rectum, stomach and liver. The incidence of female breast cancer ranked firstly for female cancers in urban areas. The other 10 most common cancers in female were cervix cancer, uterus cancer and ovary cancer and thyroid gland cancer. The most common cancers in rural in female were esophagus cancer and stomach cancer, followed by liver cancer, breast cancer, cervix cancer and uterus cancer. Esophagus cancer and stomach cancer were the most common cancers in female in rural areas.
Comparison with Results of Third National Survey for Cause of Death
The results of Third National Survey for Cause of Death showed that the mortality rate and its ASMRC in all the cancer registries was 135.88/100,000 and 91.24/100,000, respectively, with the mortality rate and its ASMRC were 150.18/100,000 and 91.41/100,000 in urban, while 128.65/100,000 and 91.19/100,000 in rural, respectively. Lung cancer was the leading cause of death in all the cancer registries, with the mortality of 30.83/100,000. The mortality for other cancer was 26.26/100,000 for liver cancer, 24.71/100,000 for stomach cancer, 15.71/100,000 for esophagus cancer and 7.25/100,000 for colorectal cancer[8].
Our results showed a higher crude mortality rate comparing with the results of Third National Survey for Cause of Death, as well as the mortality rate and its ASMRC in rural areas. But the ASMRC mortality was lower in our survey. The 5 most common fetal cancers were as same as the results of Third National Survey for Cause of Death, with a little bit change of the rank of cancer.
Representative and Quality of Data in NCCR
Total 56 cancer registries reported cancer registration data to NCCR in 2011 with 8 registries more than last year. Cancer registration data from 41 cancer registries were pooled into the National Data for Annual Report finally. However, the quality of data are still needed to improved, such as establishing a complete of life statistics and registration system, minimizing the number of omission and reiteration of new cases, reducing the missing report of death cases and improving the MV% and the fluctuation of both incidence and mortality.
Compared to the cancer incidence in 2006 and 2007, the prevalence of cancer in China was increasing dramatically[9-10]. Several issues might contribute to this phenomenon. The aged tendency of population probably was associated with the nature increase of cancer incidence. On the other hand, the reduced miss report of cancer might affected it, which resulting from more emphasizes of Ministry of Health on cancer register in 2008, more and more manpower, physical resource and financial resource invested by all levels of governments, and professional training on cancer register and so on.
It is admitted that the study population were mainly from 56 register areas of China. So the representative of our report still needs to be evaluated. The 78.86% of study population were from urban areas, which mainly represented a typical character of cancer burden in urban areas. The incidence and mortality in rural areas only represented the characters of cancer in high-risk cancer areas and could not reflect the characters of some certain cancers, such as esophagus cancer, stomach cancer, liver cancer and naso- pharyngeal cancer. The national incidence and mortality of these cancers in rural areas are significantly higher than they should be, which is in accordance with the result of Third National Survey for Cause of Death.
Long-Term Process of Development of New Tumor Registries
The work of cancer registries is an important part of the surveillance of chronic disease, and meets the need of prevention and control of cancer. It is imperative to make the cancer register more and more flawless. According to the Plan for Chinese Cancer Prevention and Control (2004−2010) from Ministry of Health, 52 cancer registries were newly established. Since 2008, there have been 95 cancer registries in every 31 provinces in China, and the population increased to more than 120,000,000, which was 8.0% of the whole Chinese population, and been 195 cancer registries by the end of 2011. The coverage population increased to more than 190,000,000 (120,000,000 in urban areas and 70,000,000 in rural) which accounted for 14% of the whole population in 2011. The population in rural registries and improvement of the representative of data from rural areas should be further increased.
Cancer register is professional, which involves in experts from health administration, oncology, pathology, medical statistics and epidemiology etc. It will take at least 5 years to build a new register to make a skillful and steady work on data collection and procession. So cancer register provide basic measures for cancer prevention and control.
Suggestions for Cancer Prevention and Control in China
Our results showed that the profile of cancer incidence and mortality in urban areas was different from rural areas. Such disparities would reflect regional differences in the prevalence and distribution of major risk factors, detection practices and availability of treatment services. Therefore, different strategies should be put out according to different areas and sex.
In urban areas, the prevalence of lung cancer, colorectal cancer and female breast cancer has increased quickly since these years. The westernization of lifestyle and air pollution may explain part of the change of cancer spectrum. Programs of enhancing the screening of cancer in high risk population and improvement of diagnose and treatment of early cancer should be placed at the important aspect in urban.
While in rural areas, the cancers related to digestive system such as stomach cancer, cervical cancer and liver cancer remained the leading causes of cancer deaths in rural areas of China. More emphasis should be put to standardize the cancer treatment to improve the survival rate and mortality rate in rural poor.
We also found that the incidence and mortality varied greatly by sex. Lung cancer was the most common cancer and the leading cause of cancer death in male in urban. In female, the incidence of breast cancer was the highest, while the mortality for breast cancer ranked 5th due to the effective therapy for breast cancer. More emphasis should be placed for female cancer, such as cervix cancer, ovary cancer and thyroid gland cancer for female.
Acknowledgment
We gratefully acknowledged the cooperation of all the population-based cancer registries in providing cancer statistics, data collection, sorting, verification and database creation. The authors assume full responsibility for analyses and interpretation of these data.
REFERENCES
- 1.Bray F, Parkin DM. Evaluation of data quality in the cancer registry: principles and methods. Part I: comparability, validity and timeliness. Eur J Cancer 2009; 45:747-55 [DOI] [PubMed] [Google Scholar]
- 2.National Central Cancer Registry. Guideline for cancer registration in China (in Chinese). Beijing: Peking Union Medical College Publication House; 2004. [Google Scholar]
- 3.Curado MP, Edwards B, Shin HR, et al. Cancer incidence in five continents. Vol. IX. IARC Scientific Publications No. 160. Lyon: IARC; 2008. [Google Scholar]
- 4.Parkin DM, Chen VW, Ferlay J, et al. Comparability and quality control in cancer registration. IARC Technical Report No. 19. Lyon: IARC; 1994.
- 5.Felay J, Burkhard C, Whelan SD, et al. Check and conversion programs for cancer registries. IARC Technical Report No. 42. Lyon: IARC; 2005.
- 6.Chen JG. The evaluation on data quality for cancer register. Chin Cancer (in Chinese)1999; 8:100-4 [Google Scholar]
- 7.Felay J. The IARC crgTools program. Lyon: IARC; 2006. http://www.iacr.com.fr/iarccrgtools.htm
- 8.Ministry of Health. The third national survey for cause of death (in Chinese). Beijing: Peking Union Medical College Publication House; 2008. [Google Scholar]
- 9.Zhang SW, Lei ZL, LI GL, et al. Incidence and mortality from China cancer registries in 2005. Zhong Guo Zhong Liu (in Chinese)2009; 18:973-9 [Google Scholar]
- 10.Zhao P, Chen WQ. Annual report of China cancer 2008 (in Chinese). Beijing: Military Medical Sciences Press; 2009. [Google Scholar]