

Abstract
Objective
The National Central Cancer Registry (NCCR) collected cancer registration data in 2009 from local cancer registries in 2012, and analyzed to describe cancer incidence and mortality in China.
Methods
On basis of the criteria of data quality from NCCR, data submitted from 104 registries were checked and evaluated. There were 72 registries’ data qualified and accepted for cancer registry annual report in 2012. Descriptive analysis included incidence and mortality stratified by area (urban/rural), sex, age group and cancer site. The top 10 common cancers in different groups, proportion and cumulative rates were also calculated. Chinese population census in 1982 and Segi’s population were used for age-standardized incidence/mortality rates.
Results
All 72 cancer registries covered a total of 85,470,522 population (57,489,009 in urban and 27,981,513 in rural areas). The total new cancer incident cases and cancer deaths were 244,366 and 154,310, respectively. The morphology verified cases accounted for 67.23%, and 3.14% of incident cases only had information from death certifications. The crude incidence rate in Chinese cancer registration areas was 285.91/100,000 (males 317.97/100,000, females 253.09/100,000), age-standardized incidence rates by Chinese standard population (ASIRC) and by world standard population (ASIRW) were 146.87/100,000 and 191.72/100,000 with the cumulative incidence rate (0-74 age years old) of 22.08%. The cancer incidence and ASIRC were 303.39/100,000 and 150.31/100,000 in urban areas whereas in rural areas, they were 249.98/100,000 and 139.68/100,000, respectively. The cancer mortality in Chinese cancer registration areas was 180.54/100,000 (224.20/100,000 in males and 135.85/100,000 in females), age-standardized mortality rates by Chinese standard population (ASMRC) and by world standard population (ASMRW) were 85.06/100,000 and 115.65/100,000, and the cumulative incidence rate (0-74 age years old) was 12.94%. The cancer mortality and ASMRC were 181.86/100,000 and 80.86/100,000 in urban areas, whereas in rural areas, they were 177.83/100,000 and 94.40/100,000 respectively. Lung cancer, gastric cancer, colorectal cancer, liver cancer, esophageal cancer, pancreas cancer, encephaloma, lymphoma, female breast cancer and cervical cancer, were the most common cancers, accounting for 75% of all cancer cases in urban and rural areas. Lung cancer, gastric cancer, liver cancer, esophageal cancer, colorectal cancer, pancreatic cancer, breast cancer, encephaloma, leukemia and lymphoma accounted for 80% of all cancer deaths. The cancer spectrum showed difference between urban and rural areas, males and females. The main cancers in rural areas were cancers of the stomach, followed by esophageal cancer, lung cancer, liver cancer and colorectal cancer, whereas the main cancer in urban areas was lung cancer, followed by liver cancer, gastric cancer and colorectal cancer.
Conclusions
The coverage of cancer registration population has been increasing and data quality is improving. As the basis of cancer control program, cancer registry plays an important role in making anti-cancer strategy in medium and long term. As cancer burdens are different between urban and rural areas in China, prevention and control should be implemented based on practical situation.
Key Words: Cancer registry, incidence, mortality, epidemiology, China
Introduction
Population-based cancer registry collects the data on cancer incident cases and deaths from covered population to describe and surveillance the cancer epidemics in certain areas. The cancer registration data are not only applied for cancer control planning, implementation and evaluation on cancer prevention and control but also for scientific research (1). Since 2006, when Disease Prevention and Control Bureau, Ministry of Health of China started to publish cancer statistics annually, National Central Cancer Registry (NCCR) of China has been responsible for collecting data from all local registries, calculating the statistical items accurately, analyzing the data of cancer incident cases and deaths from registration areas, and then releasing the updated data in Cancer Registry Annual Report (2). The cancer statistics data have been broadly utilized in scientific researches, clinical trials and decision of cancer prevention and control strategies.
Materials and methods
Data source
There were 104 cancer registries from 26 provinces submitted cancer registration data in 2009, including 46 urban registries and 58 rural registries. The coverage population of all 104 registries was 109,476,347 (55,654,485 men and 53,821,862 women), accounting for 8.20% of whole national population by the end of 2009. The total cancer incident cases were 284,470 (160,958 for male and 123,512 for female) and deaths were 174,879 (110,311 for male and 64,568 for female), respectively.
Quality control
Proportion of morphological verification (MV%), percentage of cancer cases identified with death certification only (DCO%), mortality to incidence ratio (M/I), percentage of uncertified cancer (UB%) and percentage of cancer with undefined or unknown primary site (secondary) (O&U%) were used to evaluate the completeness, validity and reliability of cancer registration data. According to NCCR acceptable criterion, the following standards should be reached: MV% higher than 66%, DCO% less than 15% and M/I ratio between 0.6 and 0.8.
One of the advantages of cancer registration data was timely report of cancer. However, for the completeness, validity and reliability of cancer statistics (3), the time gap between data updating and analyzing might exist. NCCR ruled that every registry should upload the cancer registry data of 2009 before July 1, 2012, which was 30 months after cancer diagnosis.
Statistical analysis
The quality of data was assessed based on “Guideline of Chinese Cancer Registration” and referred to the criteria for “Cancer Incidence in Five Continents Volume IX” (4) by the International Agency for Cancer Registry (IACR), the International Agency for Research on Cancer (IARC). Once the cancer registration data met the criteria of quality on completeness, comparability and validity, it would be accepted as qualified data for analysis.
Crude incidence and mortality rates were calculated stratified by cancer type, sex, area (urban/rural) and age (grouped by 0, 1-4, 5-9, … 80-84, 85 years old and above), age-standardized to the 1982 Chinese population and world Segi’s population. Proportion and cumulative rate were also calculated. Database software, including MS-FoxPro, MS-Excel, SAS and IARC issued by IARC/IACR (5) were used for data check, evaluation and analysis.
Results
Data pooling and quality evaluation
Total 72 registries, including 31 from urban and 41 from rural areas, met the criteria for data quality and then were pooled for national database in 2009. The population coverage of valid database was 85,470,522 (43,231,554 in male and 42,238,968 in female), with 57,489,009 in urban areas (67.26%) and 27,981,513 in rural areas (32.74%). The total cancer incident cases and deaths were 244,366 and 137,462, respectively (Table 1).
Table 1. Distribution for total population, new case and death number in each registry in 2009.
| Cancer registry | Category 1. urban; 2. rural | Total population |
New case number |
Cancer death |
||||||||
|---|---|---|---|---|---|---|---|---|---|---|---|---|
| Both sexes | Male | Female | Both sexes | Male | Female | Both sexes | Male | Female | ||||
| Beijing | 1 | 7,645,186 | 3,859,586 | 3,785,600 | 23,339 | 11,784 | 11,555 | 13,544 | 969 | 5,575 | ||
| Qianxi | 2 | 361,312 | 182,138 | 179,174 | 767 | 503 | 264 | 421 | 313 | 108 | ||
| Shexian | 2 | 394,944 | 205,168 | 189,776 | 1,286 | 802 | 484 | 957 | 634 | 323 | ||
| Cixian | 2 | 634,333 | 322,621 | 311,712 | 1,866 | 1,064 | 802 | 1,302 | 825 | 477 | ||
| Baoding | 1 | 948,612 | 478,051 | 470,561 | 2,143 | 1,104 | 1,039 | 1,302 | 695 | 607 | ||
| Yangquan | 1 | 683,165 | 346,023 | 337,142 | 1,403 | 807 | 596 | 913 | 582 | 331 | ||
| Yangcheng | 2 | 383,165 | 192,119 | 191,046 | 1,272 | 728 | 544 | 785 | 504 | 281 | ||
| Chifeng | 1 | 1,203,006 | 613,725 | 589,281 | 2,051 | 1,186 | 865 | 1,325 | 797 | 528 | ||
| Shenyang | 1 | 3,497,815 | 1,722,976 | 1,774,839 | 10,801 | 5,598 | 5,203 | 6,891 | 4,051 | 2,840 | ||
| Dalian | 1 | 2,266,224 | 1,136,772 | 1,129,452 | 9,313 | 4,903 | 4,410 | 4,743 | 2,959 | 1,784 | ||
| Zhuanghe | 2 | 915,660 | 461,826 | 453,834 | 2,314 | 1,310 | 1,004 | 1,539 | 972 | 567 | ||
| An'shan | 1 | 1,471,775 | 731,916 | 739,859 | 4,724 | 2,434 | 2,290 | 2,958 | 1,791 | 1,167 | ||
| Benxi | 1 | 955,409 | 475,113 | 480,296 | 2,459 | 1,376 | 1,083 | 1,638 | 1,023 | 615 | ||
| Dandong | 1 | 767,011 | 378,794 | 388,217 | 2,389 | 1,282 | 1,107 | 1,636 | 974 | 662 | ||
| Donggang | 2 | 640,853 | 323,798 | 317,055 | 1,432 | 885 | 547 | 1,141 | 691 | 450 | ||
| Dehui | 2 | 943,395 | 479,486 | 463,909 | 1,975 | 1,062 | 913 | 1,182 | 687 | 495 | ||
| Yanji | 2 | 440,957 | 215,260 | 225,697 | 766 | 447 | 319 | 464 | 315 | 149 | ||
| Daoli District, Harbin | 1 | 713,264 | 351,071 | 362,193 | 1,953 | 1,069 | 884 | 1,056 | 638 | 418 | ||
| Nangang District, Harbin | 1 | 1,020,233 | 508,921 | 511,312 | 2,389 | 1,246 | 1,143 | 1,660 | 1,005 | 655 | ||
| Shangzhi | 2 | 616,046 | 314,864 | 301,182 | 1,254 | 724 | 530 | 653 | 410 | 243 | ||
| Shanghai | 1 | 6,181,334 | 3,084,496 | 3,096,838 | 25,366 | 13,321 | 12,045 | 16,933 | 9,840 | 7,093 | ||
| Jintan | 2 | 545,000 | 262,407 | 282,593 | 1,561 | 987 | 574 | 1,242 | 838 | 404 | ||
| Suzhou | 1 | 2,392,087 | 1,183,716 | 1,208,371 | 8,381 | 4,838 | 3,543 | 4,504 | 2,835 | 1,669 | ||
| Haian | 2 | 936,785 | 463,612 | 473,173 | 2,638 | 1,583 | 1,055 | 2,108 | 1,332 | 776 | ||
| Qidong | 2 | 1,114,951 | 548,805 | 566,146 | 3,516 | 2,172 | 1,344 | 2,928 | 1,899 | 1,029 | ||
| Haimen | 2 | 1,016,228 | 501,407 | 514,821 | 3,612 | 2,077 | 1,535 | 2,617 | 1,709 | 908 | ||
| Lianyungang | 1 | 886,862 | 452,358 | 434,504 | 1,994 | 1,108 | 886 | 1,306 | 825 | 481 | ||
| Donghai | 2 | 1,117,858 | 579,751 | 538,107 | 2,083 | 1,283 | 800 | 1,506 | 979 | 527 | ||
| Guanyun | 2 | 1,015,229 | 534,502 | 480,727 | 1,995 | 1,204 | 791 | 1,596 | 1,068 | 528 | ||
| Chuzhou District, Huai’an |
1 | 1,174,877 | 609,088 | 565,789 | 2,828 | 1,728 | 1,100 | 1,925 | 1,179 | 746 | ||
| Huaiyin District, Huai'an | 1 | 900,027 | 465,502 | 434,525 | 2,013 | 1,342 | 671 | 1,399 | 937 | 462 | ||
| Xuyi | 2 | 759,450 | 388,180 | 371,270 | 1,764 | 1,097 | 667 | 1,077 | 678 | 399 | ||
| Jinhu | 2 | 352,292 | 176,689 | 175,603 | 967 | 572 | 395 | 688 | 424 | 264 | ||
| Sheyang | 2 | 965,817 | 494,682 | 471,135 | 3,052 | 1,734 | 1,318 | 2,213 | 1,388 | 825 | ||
| Jianhu | 2 | 805,465 | 410,369 | 395,096 | 2,150 | 1,312 | 838 | 1,681 | 1,099 | 582 | ||
| Dafeng | 2 | 724,147 | 363,326 | 360,821 | 2,014 | 1,167 | 847 | 1,597 | 975 | 622 | ||
| Yangzhong | 2 | 272,046 | 134,758 | 137,288 | 1,043 | 576 | 467 | 873 | 532 | 341 | ||
| Hangzhou | 1 | 6,753,509 | 3,403,893 | 3,349,616 | 22,625 | 12,690 | 9,935 | 11,592 | 7,571 | 4,021 | ||
| Jiaxing | 1 | 509,367 | 253,819 | 255,548 | 1,564 | 853 | 711 | 912 | 573 | 339 | ||
| Jiashan | 2 | 382,475 | 189,692 | 192,783 | 1,349 | 774 | 575 | 958 | 638 | 320 | ||
| Haining | 2 | 653,957 | 322,969 | 330,988 | 1,666 | 915 | 751 | 994 | 638 | 356 | ||
| Shangyu | 2 | 771,321 | 383,462 | 387,859 | 2,127 | 1,345 | 782 | 1,466 | 981 | 485 | ||
| Xianju | 2 | 490,070 | 255,438 | 234,632 | 1,282 | 813 | 469 | 998 | 675 | 323 | ||
| Feixi | 2 | 858,895 | 449,882 | 409,013 | 1,955 | 1,346 | 609 | 1,269 | 920 | 349 | ||
| Maanshan | 1 | 633,477 | 323,834 | 309,643 | 1,721 | 1,038 | 683 | 1,143 | 770 | 373 | ||
| Tongling | 1 | 433,545 | 221,375 | 212,170 | 1,046 | 644 | 402 | 697 | 471 | 226 | ||
| Changle | 2 | 673,717 | 355,091 | 318,626 | 1,474 | 872 | 602 | 828 | 569 | 259 | ||
| Xiamen | 1 | 1,160,135 | 583,873 | 576,262 | 3,851 | 2,255 | 1,596 | 2,145 | 1,448 | 697 | ||
| Zhanggong District, Ganzhou | 1 | 420,759 | 212,159 | 208,600 | 904 | 560 | 344 | 567 | 366 | 201 | ||
| Linqu | 2 | 817,857 | 417,434 | 400,423 | 2,043 | 1,245 | 798 | 1,443 | 958 | 485 | ||
| Wenshang | 2 | 762,828 | 388,454 | 374,374 | 1,405 | 873 | 532 | 1,130 | 724 | 406 | ||
| Feicheng | 2 | 733,501 | 358,739 | 374,762 | 2,298 | 1,387 | 911 | 1,488 | 989 | 499 | ||
| Yanshi | 2 | 602,266 | 306,192 | 296,074 | 1,117 | 583 | 534 | 748 | 429 | 319 | ||
| Linzhou | 2 | 1,080,241 | 557,392 | 522,849 | 2,744 | 1,462 | 1,282 | 1,701 | 1,057 | 644 | ||
| Xiping | 2 | 858,002 | 434,899 | 423,103 | 1,628 | 926 | 702 | 1,258 | 767 | 491 | ||
| Wuhan | 1 | 4,832,174 | 2,484,622 | 2,347,552 | 12,590 | 6,978 | 5,612 | 6,961 | 4,504 | 2,457 | ||
| Yunmeng | 2 | 524,801 | 261,237 | 263,564 | 942 | 558 | 384 | 767 | 503 | 264 | ||
| Hengdong | 2 | 713,458 | 373,923 | 339,535 | 1,217 | 732 | 485 | 728 | 456 | 272 | ||
| Guangzhou | 1 | 3,968,216 | 2,014,580 | 1,953,636 | 13,062 | 7,169 | 5,893 | 8,133 | 5,093 | 3,040 | ||
| Sihui | 2 | 413,363 | 211,351 | 202,012 | 947 | 563 | 384 | 601 | 400 | 201 | ||
| Zhongshan | 1 | 1,468,391 | 732,333 | 736,058 | 2,937 | 1,783 | 1,154 | 1,881 | 1,289 | 592 | ||
| Liuzhou | 1 | 1,038,208 | 533,050 | 505,158 | 2,435 | 1,396 | 1,039 | 1,357 | 862 | 495 | ||
| Fusui | 2 | 444,332 | 236,000 | 208,332 | 759 | 525 | 234 | 529 | 391 | 138 | ||
| Jiulongpo District, Chongqing | 1 | 798,618 | 402,961 | 395,657 | 1,458 | 914 | 544 | 1,220 | 841 | 379 | ||
| Qingyang District, Chengdu | 1 | 534,701 | 277,154 | 257,547 | 1,434 | 845 | 589 | 880 | 583 | 297 | ||
| Ziliujing District, Zigong | 1 | 357,600 | 179,873 | 177,727 | 916 | 597 | 319 | 462 | 330 | 132 | ||
| Yanting | 2 | 610,103 | 31,699 | 293,604 | 2,317 | 1,481 | 836 | 1,850 | 1,177 | 673 | ||
| Jingtai | 2 | 233,609 | 119,953 | 113,656 | 395 | 228 | 167 | 244 | 159 | 85 | ||
| Liangzhou District, Wuwei | 1 | 990,583 | 524,276 | 466,307 | 2,837 | 1,886 | 951 | 2,024 | 1,382 | 642 | ||
| Xining | 1 | 882,839 | 439,175 | 443,664 | 1,492 | 971 | 521 | 844 | 585 | 259 | ||
| Xinyuan | 2 | 271,944 | 138,895 | 133,049 | 568 | 330 | 238 | 300 | 192 | 108 | ||
The overall indicators of MV%, DCO%, and M/I ratio were 67.23%, 3.14% and 0.63, respectively. They were 68.96%, 3.03% and 0.60 in urban registries, compared to 62.91%, 3.43% and 0.71 in rural. The quality evaluation for each cancer registry was presented in Table 2.
Table 2. Quality evaluation for China cancer registers in 2009.
| Cancer site | All areas |
Urban |
Rural |
||||||||
|---|---|---|---|---|---|---|---|---|---|---|---|
| MV% | DCO% | M/I | MV% | DCO% | M/I | MV% | DCO% | M/I | |||
| Oral and pharngeal | 82.02 | 1.93 | 0.42 | 82.92 | 1.80 | 0.41 | 78.55 | 2.42 | 0.44 | ||
| Nasopharynx | 71.99 | 3.05 | 0.55 | 72.37 | 2.91 | 0.55 | 70.65 | 3.54 | 0.56 | ||
| Esophagus | 75.29 | 2.62 | 0.76 | 70.94 | 3.59 | 0.75 | 78.59 | 1.88 | 0.77 | ||
| Stomach | 76.14 | 2.95 | 0.71 | 73.18 | 3.24 | 0.70 | 79.93 | 2.58 | 0.73 | ||
| Colon, rectum | 80.26 | 2.02 | 0.48 | 80.23 | 2.03 | 0.48 | 80.39 | 2.00 | 0.51 | ||
| Liver | 34.10 | 5.91 | 0.91 | 38.11 | 6.08 | 0.91 | 27.46 | 5.63 | 0.91 | ||
| Gallbladder | 47.64 | 4.39 | 0.79 | 47.41 | 4.73 | 0.81 | 48.56 | 3.02 | 0.72 | ||
| Pancreas | 37.96 | 4.71 | 0.91 | 38.39 | 4.57 | 0.91 | 36.62 | 5.16 | 0.91 | ||
| Throat | 76.69 | 2.93 | 0.52 | 78.86 | 2.54 | 0.47 | 67.96 | 4.49 | 0.72 | ||
| Lung | 50.76 | 4.88 | 0.85 | 55.03 | 4.71 | 0.86 | 38.68 | 5.35 | 0.84 | ||
| Other organs in chest | 59.19 | 2.79 | 0.53 | 60.69 | 2.87 | 0.54 | 52.76 | 2.45 | 0.49 | ||
| Bone | 53.86 | 6.50 | 0.72 | 57.66 | 6.24 | 0.65 | 47.58 | 6.94 | 0.84 | ||
| Skin melanoma | 86.62 | 0.64 | 0.52 | 85.41 | 0.27 | 0.54 | 91.49 | 2.13 | 0.41 | ||
| Breast | 87.88 | 0.87 | 0.24 | 88.46 | 0.75 | 0.23 | 85.19 | 1.40 | 0.29 | ||
| Cervix | 86.72 | 1.19 | 0.25 | 86.49 | 1.05 | 0.24 | 87.23 | 1.50 | 0.28 | ||
| Uterus | 84.17 | 1.89 | 0.33 | 87.51 | 1.46 | 0.27 | 73.78 | 3.22 | 0.49 | ||
| Ovary | 79.40 | 1.55 | 0.43 | 80.19 | 1.65 | 0.45 | 76.38 | 1.16 | 0.38 | ||
| Prostate | 71.17 | 1.70 | 0.42 | 72.07 | 1.45 | 0.40 | 63.08 | 3.97 | 0.65 | ||
| Testis | 82.57 | 0.00 | 0.19 | 82.23 | 0.00 | 0.17 | 84.09 | 0.00 | 0.25 | ||
| Kidney | 76.61 | 1.22 | 0.33 | 78.56 | 1.14 | 0.32 | 59.92 | 1.95 | 0.45 | ||
| Bladder | 77.97 | 1.84 | 0.39 | 79.62 | 1.84 | 0.38 | 70.15 | 1.83 | 0.47 | ||
| Brain | 51.01 | 3.41 | 0.60 | 57.40 | 2.90 | 0.54 | 34.48 | 4.75 | 0.76 | ||
| Thyroid | 89.73 | 0.37 | 0.08 | 90.13 | 0.34 | 0.08 | 87.51 | 0.58 | 0.11 | ||
| Lymphoma | 92.32 | 0.95 | 0.56 | 92.90 | 0.81 | 0.53 | 89.55 | 1.61 | 0.70 | ||
| Leukemia | 93.72 | 1.50 | 0.75 | 94.38 | 1.45 | 0.71 | 91.68 | 1.68 | 0.88 | ||
| Other cancers | 66.46 | 3.38 | 0.50 | 66.84 | 2.80 | 0.46 | 64.79 | 5.92 | 0.63 | ||
| Total | 67.23 | 3.14 | 0.63 | 68.96 | 3.03 | 0.60 | 62.91 | 3.43 | 0.71 | ||
Incidence and mortality of overall cancers
Incidence rate
The crude incidence rate of all cancers in registration areas was 285.91/100,000 (317.97/100,000 in males and 253.09/100,000 in females). The age-standardized incidence rate was 146.87/100,000 and 191.72/100,000 by Chinese population (ASIRC) and World population (ASIRW), respectively. Among the patients aged 0-74 years, the cumulative incidence rate was 22.08%. The crude cancer incidence rate and age-standardized rates in urban areas were higher than those of rural areas. Although the crude incidence in male was much higher in urban areas than in rural areas, the ASRs were similar (Table 3).
Table 3. The incidence of cancer (ICD10:C00-C97) register in China in 2009.
| Areas | Genders | Cancer cases | Crude incidence (1/105) | ASIRC* (1/105) | ASIRW** (1/105) | Cumulative rate 0-74(%) |
|---|---|---|---|---|---|---|
| All areas | Both | 244,366 | 285.91 | 146.87 | 191.72 | 22.08 |
| Male | 137,462 | 317.97 | 165.92 | 220.33 | 25.68 | |
| Female | 106,904 | 253.09 | 129.49 | 166.04 | 18.64 | |
| Urban | Both | 174,418 | 303.39 | 150.31 | 195.74 | 22.23 |
| Male | 95,705 | 330.19 | 165.50 | 219.84 | 25.25 | |
| Female | 78,713 | 276.15 | 137.09 | 175.03 | 19.44 | |
| Rural | Both | 69,948 | 249.98 | 139.68 | 182.88 | 21.76 |
| Male | 41,757 | 293.10 | 166.94 | 220.94 | 26.65 | |
| Female | 28,191 | 205.25 | 113.07 | 146.24 | 16.83 |
*Age-standardized incidence rate (China population); **Age-standardized incidence rate (World population)
Age-specific incidence rate
Cancer incidence was relatively lower before 39 years old, then increased dramatically after 40 years old and finally peaked after 80 years and then slightly decreased after 85 years old (Table 4, Figure 1). The pattern was similar between urban and rural areas. Comparing the age-specific incidence rate between urban and rural areas, the cancer incidence in male before 39 years old and after 80 years old was higher in urban areas than that in rural areas, but lower in the age group of 40-74 years. However, in females, the incidences were higher in urban areas than that in rural areas in every age group except for age group 60 (Table 4, Figure 1).
Table 4. Age-specific incidence rate for all cancers (ICD10:C00-C97) in cancer registration areas in 2009 (1/105).
| Age groups | All areas |
Urban |
Rural |
||||||||
|---|---|---|---|---|---|---|---|---|---|---|---|
| Both | Male | Female | Both | Male | Female | Both | Male | Female | |||
| Total | 285.91 | 317.97 | 253.09 | 303.39 | 330.19 | 276.15 | 249.98 | 293.10 | 205.25 | ||
| 0- | 14.84 | 13.45 | 16.39 | 19.52 | 17.41 | 21.84 | 7.21 | 7.13 | 7.29 | ||
| 1- | 13.72 | 15.93 | 11.25 | 17.08 | 19.76 | 14.14 | 8.26 | 9.85 | 6.42 | ||
| 5- | 7.06 | 7.42 | 6.66 | 8.68 | 8.69 | 8.66 | 4.79 | 5.65 | 3.82 | ||
| 10- | 7.79 | 8.53 | 6.98 | 9.31 | 10.13 | 8.43 | 5.69 | 6.35 | 4.95 | ||
| 15- | 11.35 | 11.88 | 10.79 | 11.63 | 11.85 | 11.40 | 10.84 | 11.93 | 9.66 | ||
| 20- | 16.45 | 14.69 | 18.32 | 17.53 | 15.25 | 19.98 | 13.85 | 13.31 | 14.40 | ||
| 25- | 26.97 | 20.97 | 33.20 | 30.99 | 23.11 | 39.19 | 17.92 | 16.10 | 19.79 | ||
| 30- | 47.96 | 36.44 | 59.68 | 56.32 | 40.51 | 72.35 | 32.79 | 29.08 | 36.59 | ||
| 35- | 87.07 | 69.42 | 104.94 | 93.01 | 70.83 | 115.36 | 75.27 | 66.62 | 84.09 | ||
| 40- | 154.53 | 129.54 | 180.03 | 160.50 | 127.28 | 194.29 | 142.54 | 134.06 | 151.24 | ||
| 45- | 242.12 | 219.47 | 265.60 | 258.82 | 225.01 | 294.03 | 204.43 | 206.89 | 201.89 | ||
| 50- | 394.78 | 410.88 | 378.17 | 397.66 | 397.39 | 397.94 | 387.43 | 444.91 | 327.38 | ||
| 55- | 544.27 | 618.08 | 469.99 | 532.91 | 590.48 | 475.99 | 571.44 | 682.07 | 455.18 | ||
| 60- | 708.64 | 852.04 | 564.77 | 676.21 | 803.12 | 551.87 | 778.69 | 953.84 | 593.72 | ||
| 65- | 906.78 | 1,138.27 | 680.68 | 910.72 | 1,129.70 | 702.82 | 898.92 | 1,154.64 | 634.66 | ||
| 70- | 1,245.46 | 1,583.13 | 935.09 | 1,264.31 | 1,578.32 | 980.66 | 1,200.13 | 1,594.34 | 822.40 | ||
| 75- | 1,511.13 | 1,965.73 | 1,107.20 | 1,564.46 | 2,019.92 | 1,155.87 | 1,372.63 | 1,822.38 | 982.80 | ||
| 80- | 1,635.25 | 2,178.17 | 1,204.36 | 1,745.02 | 2,311.08 | 1,284.78 | 1,357.54 | 1,825.34 | 1,008.41 | ||
| 85- | 1,397.50 | 2,008.61 | 1,010.75 | 1,531.08 | 2,192.74 | 1,101.64 | 1,049.00 | 1,500.23 | 781.80 | ||
Figure 1.
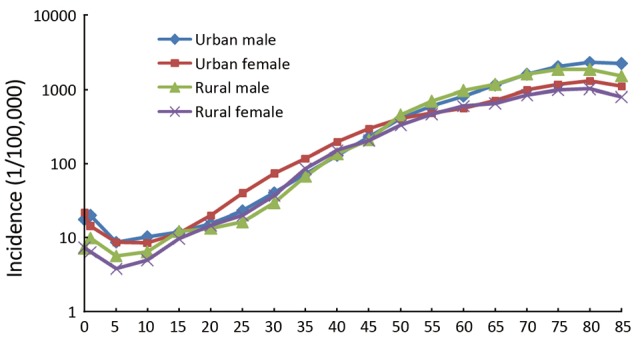
Age-specific cancer incidence rates in urban and rural areas, 2009
Mortality
The crude mortality in cancer registration areas was 180.54/100,000 (224.20/100, 000 in male and 135.85/100,000 in female). The age-standardized rates by Chinese population and World population were 85.06/100,000 and 115.65/100,000, respectively. The cumulative mortality (0-74 years) rate was 12.94%. Urban areas had higher cancer mortality of 181.86/100,000 than that of rural areas (177.83/100,000), and mortalities close in males. After age standardization, the mortality rate in rural areas was higher than that in urban areas both in males and females (Table 5).
Table 5. Cancer mortality in cancer registration areas in 2009.
| Area | Sex | Deaths | Mortality rate (1/105) | ASMRC* (1/105) | ASMRW** (1/105) | Cumulative rate 0-74 (%) |
|---|---|---|---|---|---|---|
| All areas | Both | 154,310 | 180.54 | 85.06 | 115.65 | 12.94 |
| Male | 96,927 | 224.20 | 110.89 | 151.69 | 16.94 | |
| Female | 57,383 | 135.85 | 60.53 | 82.18 | 9.06 | |
| Urban | Both | 104,551 | 181.86 | 80.86 | 110.57 | 12.12 |
| Male | 64,768 | 223.45 | 104.57 | 143.96 | 15.71 | |
| Female | 39,783 | 139.57 | 58.61 | 80.00 | 8.69 | |
| Rural | Both | 49,759 | 177.83 | 94.40 | 126.73 | 14.78 |
| Male | 32,159 | 225.73 | 124.60 | 168.01 | 19.62 | |
| Female | 17,600 | 128.14 | 64.93 | 87.08 | 9.89 |
*Age-standardized mortality rate (China population); **Age-standardized mortality rate (World population)
Age-specific mortality
The cancer mortality was relatively lower before 50 years old. The rate was dramatically increasing after 50 years old, and reached peak after 85 years old (Table 6 and Figure 2). The mortality rate was highest in the age group of 80-84 years in rural areas. The age-specific mortality in urban areas was lower than that in rural in most of age groups. In males, the mortality in urban was higher than in rural only for age group over 80 years and it occurred in females for age over 70 years.
Table 6. Age-specific mortality in cancer registration areas in 2009 (1/105).
| Age group | All areas |
Urban |
Rural |
|||||||||
|---|---|---|---|---|---|---|---|---|---|---|---|---|
| Both | Male | Female | Both | Male | Female | Both | Male | Female | ||||
| Total | 180.54 | 224.20 | 135.85 | 181.86 | 223.45 | 139.57 | 177.83 | 225.73 | 128.14 | |||
| 0- | 4.84 | 4.28 | 5.46 | 5.99 | 4.98 | 7.10 | 2.97 | 3.17 | 2.73 | |||
| 1- | 5.34 | 5.54 | 5.12 | 5.67 | 5.87 | 5.46 | 4.80 | 5.01 | 4.55 | |||
| 5- | 3.29 | 3.74 | 2.80 | 3.27 | 3.62 | 2.89 | 3.33 | 3.90 | 2.69 | |||
| 10- | 3.55 | 4.16 | 2.89 | 3.90 | 4.81 | 2.91 | 3.08 | 3.28 | 2.86 | |||
| 15- | 4.94 | 6.26 | 3.53 | 4.25 | 5.54 | 2.91 | 6.21 | 7.58 | 4.72 | |||
| 20- | 5.41 | 6.52 | 4.24 | 4.86 | 5.96 | 3.68 | 6.74 | 7.90 | 5.55 | |||
| 25- | 7.11 | 7.73 | 6.47 | 6.44 | 6.92 | 5.94 | 8.62 | 9.56 | 7.66 | |||
| 30- | 13.82 | 15.88 | 11.72 | 13.54 | 14.93 | 12.13 | 14.32 | 17.60 | 10.97 | |||
| 35- | 29.75 | 34.14 | 25.30 | 28.00 | 31.35 | 24.61 | 33.23 | 39.65 | 26.68 | |||
| 40- | 59.81 | 72.29 | 47.06 | 53.54 | 63.25 | 43.66 | 72.40 | 90.39 | 53.92 | |||
| 45- | 99.07 | 124.35 | 72.85 | 96.53 | 120.24 | 71.84 | 104.80 | 133.68 | 75.14 | |||
| 50- | 187.82 | 242.65 | 131.28 | 176.03 | 228.63 | 122.06 | 217.83 | 278.00 | 154.95 | |||
| 55- | 277.05 | 366.06 | 187.46 | 250.07 | 330.76 | 170.30 | 341.52 | 447.88 | 229.74 | |||
| 60- | 403.54 | 532.88 | 273.77 | 357.27 | 473.64 | 243.24 | 503.47 | 656.16 | 342.23 | |||
| 65- | 582.92 | 783.63 | 386.89 | 548.80 | 732.17 | 374.73 | 650.90 | 881.89 | 412.18 | |||
| 70- | 905.10 | 1,182.75 | 649.90 | 871.53 | 1,114.49 | 652.06 | 985.79 | 1,341.92 | 644.56 | |||
| 75- | 1,252.48 | 1,662.80 | 887.89 | 1,248.09 | 1,632.73 | 903.04 | 1,263.89 | 1,742.36 | 849.16 | |||
| 80- | 1,576.77 | 2,087.30 | 1,171.58 | 1,621.38 | 2,119.42 | 1,216.45 | 1,463.91 | 2,002.06 | 1,062.26 | |||
| 85+ | 1,634.30 | 2,297.25 | 1,214.74 | 1,768.54 | 2,475.90 | 1,309.44 | 1,284.07 | 1,804.02 | 976.18 | |||
Figure 2.
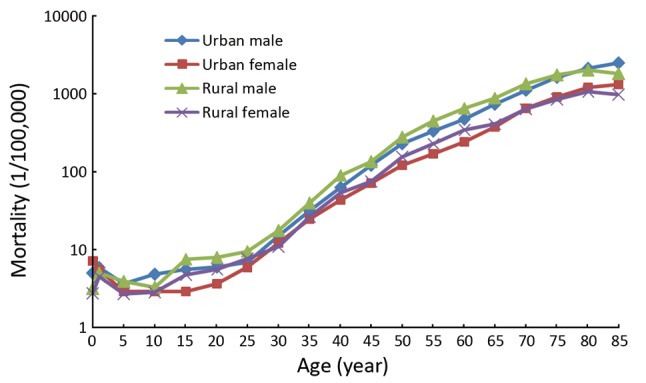
Age-specific cancer mortality rates in urban and rural areas, 2009
Incidence and mortality for major cancers
Cancer incidence rates for the 10 most common cancers
Lung cancer was the most common cancer in cancer registration areas, followed by stomach cancer, colorectal cancer, liver cancer and esophageal cancer. The 10 most common cancers accounted for 76.39% of all new cases with 84.14% in males and 77.57% in females, respectively. Lung cancer was the most frequently diagnosed cancers in males followed by stomach cancer, liver cancer, colon-rectum cancer and esophageal cancer. And breast cancer was the most frequently diagnosed cancers followed by lung cancer, colorectal cancer, stomach cancer and liver cancer in females (Table 7).
Table 7. Top 10 cancer incidence rates in cancer registration areas in 2009.
| Rank | Both |
Male |
Female |
|||||||||||
|---|---|---|---|---|---|---|---|---|---|---|---|---|---|---|
| Site | Incidence rate (1/105) | % | ASIRC* (1/105) |
Site | Incidence rate (1/105) | % | ASIRC* (1/105) |
Site | Incidence rate (1/105) | % | ASIRC* (1/105) | |||
| 1 | Lung (C33-34) | 53.57 | 18.74 | 25.34 | Lung (C33-34) | 70.40 | 22.14 | 34.75 | Breast (C50) | 42.55 | 16.81 | 23.16 | ||
| 2 | Stomach (C16) | 36.21 | 12.67 | 17.85 | Stomach (C16) | 49.61 | 15.60 | 25.37 | Lung (C33-34) | 36.34 | 14.36 | 16.41 | ||
| 3 | Colon, rectum (C18-21) | 29.44 | 10.30 | 14.21 | Liver (C22) | 41.99 | 13.21 | 22.49 | Colon, rectum (C18-21) |
26.42 | 10.44 | 12.29 | ||
| 4 | Liver (C22) | 28.71 | 10.04 | 14.78 | Colon, rectum (C18-21) | 32.38 | 10.18 | 16.23 | Stomach (C16) | 22.50 | 8.89 | 10.62 | ||
| 5 | Esophagus (C15) | 22.14 | 7.74 | 10.88 | Esophagus (C15) | 30.44 | 9.57 | 15.62 | Liver (C22) | 15.11 | 5.97 | 7.11 | ||
| 6 | Breast (C50) | 21.21 | 7.42 | 11.64 | Prostate (C61) | 9.92 | 3.12 | 4.34 | Esophagus (C15) | 13.64 | 5.39 | 6.27 | ||
| 7 | Pancreas (C25) | 7.28 | 2.55 | 3.35 | Bladder (C67) | 9.78 | 3.08 | 4.70 | Cervix (C53) | 12.96 | 5.12 | 7.42 | ||
| 8 | Lymphoma (C81-85, 88, 90, 96) | 6.68 | 2.34 | 3.75 | Pancreas (C25) | 8.24 | 2.59 | 4.01 | Thyroid (C73) | 10.09 | 3.99 | 6.50 | ||
| 9 | Bladder (C67) | 6.61 | 2.31 | 3.03 | Lymphoma | 7.71 | 2.42 | 4.46 | Uterus (C54-55) | 8.77 | 3.46 | 4.69 | ||
| 10 | Thyroid (C73) | 6.56 | 2.29 | 4.21 | Kidney (C64-66, 68) |
7.07 | 2.22 | 3.82 | Ovary (C56) | 7.95 | 3.14 | 4.54 | ||
| Top 10 | 218.40 | 76.39 | 109.05 | Top 10 | 267.55 | 84.14 | 135.81 | Top 10 | 196.32 | 77.57 | 99.01 | |||
*Age-standardized incidence rate (China population)
Cancer mortality rates for the 10 most common cancers
Lung cancer was the leading cause of death in cancer registration areas followed by stomach cancer, liver cancer, esophageal cancer and colorectal cancer. The 10 most common cancer of death cause accounted for 84.27% of all cancer death. In males, lung cancer was the leading cause followed by liver cancer, stomach cancer, esophageal cancer and colorectal cancer; while in females, lung cancer was still the leading cause followed by stomach cancer, liver cancer, colon-rectum cancer and breast cancer (Table 8).
Table 8. The 10 most common cancer mortality rates in cancer registration areas in 2009.
| Rank | Both |
Male |
Female |
|||||||||||
|---|---|---|---|---|---|---|---|---|---|---|---|---|---|---|
| Site | Mortality rate (1/105) | % | ASMRC* (1/105) | Site | Mortality rate (1/105) | % | ASMRC* (1/105) | Site | Mortality rate (1/105) | % | ASMRC* (1/105) |
|||
| 1 | lung | 45.57 | 25.24 | 20.61 | Lung | 61.00 | 27.21 | 29.15 | Lung | 29.77 | 21.91 | 12.58 | ||
| 2 | Liver | 26.04 | 14.42 | 13.06 | Liver | 37.96 | 16.93 | 19.91 | Stomach | 16.91 | 12.45 | 7.19 | ||
| 3 | Stomach | 25.88 | 14.33 | 11.86 | Stomach | 34.64 | 15.45 | 16.79 | Liver | 13.84 | 10.19 | 6.28 | ||
| 4 | Esophagus | 16.77 | 9.29 | 7.75 | Esophagus | 23.29 | 10.39 | 11.42 | Colon, rectum |
12.69 | 9.34 | 5.09 | ||
| 5 | Colon, rectum |
14.23 | 7.88 | 6.15 | Colon, rectum |
15.73 | 7.02 | 7.28 | Breast | 10.24 | 7.54 | 4.94 | ||
| 6 | Pancreas | 6.61 | 3.66 | 2.98 | Pancreas | 7.45 | 3.32 | 3.59 | Esophagus | 10.11 | 7.44 | 4.22 | ||
| 7 | Breast | 5.13 | 2.84 | 2.52 | lymphoma | 5.00 | 2.23 | 3.43 | Pancreas | 5.75 | 4.23 | 2.41 | ||
| 8 | Leukemia | 4.28 | 2.37 | 2.88 | Leukemia | 4.59 | 2.05 | 2.37 | Gallbladder | 3.79 | 2.79 | 1.50 | ||
| 9 | Brain | 3.87 | 2.15 | 2.29 | Prostate | 4.19 | 1.87 | 1.58 | Brain | 3.55 | 2.61 | 1.99 | ||
| 10 | Lymphoma | 3.75 | 2.08 | 1.86 | Brain | 4.19 | 1.87 | 5.59 | Leukemia | 3.55 | 2.61 | 2.34 | ||
| Top 10 | 152.14 | 84.27 | 71.96 | Top 10 | 198.04 | 88.33 | 98.11 | Top 10 | 110.20 | 81.12 | 48.55 | |||
*Age-standardized mortality rate (China population)
Cancer incidence of the 10 most common cancers in urban areas
In urban areas, lung cancer was the most frequently diagnosed cancers, followed by colorectal cancer, stomach cancer, breast cancer and liver cancer. The 10 most common cancer accounted for 73.93% (82.26% in males and 75.93% in females) of all cancers. The most common sites of cancer were lung, stomach, colon-rectum, liver and esophagus in males, while were breast, lung, colon-rectum, stomach and liver in females (Table 9).
Table 9. The 10 most common cancer incidence rates in urban areas in 2009.
| Rank | Both |
Male |
Female |
|||||||||||
|---|---|---|---|---|---|---|---|---|---|---|---|---|---|---|
| Site | Incidence rate (1/105) | (%) | ASIRC* (1/105) | Site | Incidence rate (1/105) | (%) | ASIRC* (1/105) |
Site | Incidence rate (1/105) | (%) | ASIRC* (1/105) | |||
| 1 | Lung | 58.81 | 19.38 | 26.46 | Lung | 77.14 | 23.36 | 36.32 | Breast | 51.91 | 18.80 | 27.32 | ||
| 2 | Colon, rectum | 35.78 | 11.79 | 16.51 | Stomach | 40.93 | 12.40 | 19.91 | Lung | 40.17 | 14.55 | 17.22 | ||
| 3 | Stomach | 30.20 | 9.95 | 14.15 | Liver | 39.42 | 11.94 | 20.32 | Colon, rectum | 32.15 | 11.64 | 14.29 | ||
| 4 | Liver | 26.63 | 8.78 | 13.13 | Colon, rectum | 39.35 | 11.92 | 18.89 | Stomach | 19.28 | 6.98 | 8.69 | ||
| 5 | breast | 25.94 | 8.55 | 13.79 | Esophagus | 21.24 | 6.43 | 10.46 | Liver | 13.62 | 4.93 | 6.05 | ||
| 6 | Esophagus | 14.21 | 4.68 | 6.65 | Prostate | 13.31 | 4.03 | 5.57 | Cervix | 13.35 | 4.83 | 7.58 | ||
| 7 | Thyroid | 8.25 | 2.72 | 5.21 | Bladder | 12.00 | 3.63 | 5.51 | Thyroid | 12.57 | 4.55 | 7.97 | ||
| 8 | Lymphoma | 8.21 | 2.70 | 4.47 | Kidney | 9.47 | 2.87 | 4.94 | Uterus | 9.83 | 3.56 | 5.09 | ||
| 9 | Pancreas | 8.19 | 2.70 | 3.59 | Lymphoma | 9.39 | 2.84 | 5.31 | Ovary | 9.37 | 3.39 | 5.15 | ||
| 10 | Bladder | 8.11 | 2.67 | 3.55 | Pancreas | 9.36 | 2.83 | 4.33 | Brain | 7.44 | 2.69 | 4.53 | ||
| Top 10 | 224.31 | 73.93 | 107.50 | Top 10 | 271.61 | 82.26 | 131.58 | Top 10 | 209.68 | 75.93 | 103.90 | |||
*Age-standardized incidence rate (China population)
Cancer mortality of the 10 most common cancers in urban areas
Lung cancer was the leading cause of cancer death in urban registration areas for both men and women. The top 10 cancers accounted for 82.38% (86.86% for males and 79.97% for females) of all mortality induced by malignant tumors. Other cancer types with high mortality in men were liver cancer, stomach cancer, colorectal cancer and esophageal cancer. In women, colorectal cancer was the second cause of cancer death, followed by stomach cancer, liver cancer and breast cancer (Table 10)
Table 10. The 10 most common cancer mortality rates in urban areas in 2009.
| Rank | Both |
Male |
Female |
|||||||||||
|---|---|---|---|---|---|---|---|---|---|---|---|---|---|---|
| Site | Mortality rate (1/105) | (%) | ASMRC* (1/105) | Site | Mortality rate (1/105) | (%) | ASMRC* (1/105) |
Site | Mortality rate (1/105) | (%) | ASMRC* (1/105) |
|||
| 1 | Lung | 50.32 | 27.67 | 21.49 | Lung | 67.11 | 30.03 | 30.39 | Lung | 33.24 | 23.81 | 13.20 | ||
| 2 | Liver | 24.15 | 13.28 | 11.51 | Liver | 35.43 | 15.85 | 17.76 | Colon, rectum | 15.22 | 10.90 | 5.75 | ||
| 3 | Stomach | 21.15 | 11.63 | 9.07 | Stomach | 27.87 | 12.47 | 12.66 | Stomach | 14.31 | 10.26 | 5.74 | ||
| 4 | Colon, rectum | 17.09 | 9.40 | 6.98 | Colon, rectum | 18.94 | 8.48 | 8.31 | Liver | 12.69 | 9.09 | 5.39 | ||
| 5 | Esophagus | 10.59 | 5.82 | 4.65 | Esophagus | 15.80 | 7.07 | 7.39 | Breast | 11.94 | 8.55 | 5.41 | ||
| 6 | Pancreas | 7.42 | 4.08 | 3.19 | Pancreas | 8.43 | 3.77 | 3.87 | Pancreas | 6.40 | 4.58 | 2.54 | ||
| 7 | Breast | 5.99 | 3.29 | 2.78 | Leukemia | 5.33 | 2.39 | 3.45 | Esophagus | 5.30 | 3.80 | 2.04 | ||
| 8 | Leukemia | 4.56 | 2.50 | 2.91 | Lymphoma | 5.32 | 2.38 | 2.62 | Gallbladder | 4.57 | 3.28 | 1.71 | ||
| 9 | Lymphoma | 4.37 | 2.40 | 2.05 | Prostate | 5.30 | 2.37 | 1.86 | Ovary | 4.19 | 3.00 | 1.97 | ||
| 10 | Gallbladder | 4.18 | 2.30 | 1.68 | Bladder | 4.56 | 2.04 | 1.72 | Leukemia | 3.76 | 2.70 | 2.38 | ||
| Top 10 | 149.82 | 82.38 | 66.30 | Top 10 | 194.10 | 86.86 | 90.02 | Top 10 | 111.62 | 79.97 | 46.12 | |||
*Age-standardized mortality rate (China population)
Cancer incidence of the 10 most common cancers in rural areas
Table 11 showed the 10 most common cancer incidence rate in rural areas. Stomach cancer was the most frequently diagnosed cancers, followed by lung cancer, esophagus cancer, liver cancer and colorectal cancer. The 10 most common cancers accounted for 84.73% (90.25% in males and 82.71% in females) of all registered new cases. The most common sites of cancer were stomach, lung, esophagus, liver and colon-rectum in males, while were stomach, lung, esophagus, breast and liver cancer in females.
Table 11. The 10 most common cancer incidence rates in rural areas 2009.
| Rank | Both |
Male |
Female |
|||||||||||
|---|---|---|---|---|---|---|---|---|---|---|---|---|---|---|
| Site | Incidence rate (1/105) | (%) | ASIRC* (1/105) |
Site | Incidence rate (1/105) | (%) | ASIRC* (1/105) |
Site | Incidence rate (1/105) | (%) | ASIRC* (1/105) |
|||
| 1 | Stomach | 48.57 | 19.43 | 26.31 | Stomach | 67.27 | 22.95 | 37.56 | Stomach | 29.17 | 14.21 | 15.12 | ||
| 2 | Lung | 42.80 | 17.12 | 22.69 | Lung | 56.68 | 19.34 | 31.08 | Lung | 28.39 | 13.83 | 14.49 | ||
| 3 | Esophagus | 38.44 | 15.38 | 20.57 | Esophagus | 49.18 | 16.78 | 27.22 | Esophagus | 27.31 | 13.31 | 13.97 | ||
| 4 | Liver | 32.98 | 13.19 | 18.52 | Liver | 47.24 | 16.12 | 27.33 | Breast | 23.12 | 11.27 | 13.69 | ||
| 5 | Colon, rectum |
16.40 | 6.56 | 8.89 | Colon, rectum |
18.20 | 6.21 | 10.17 | Liver | 18.19 | 8.86 | 9.57 | ||
| 6 | Breast | 11.51 | 4.60 | 6.84 | Pancreas | 5.97 | 2.04 | 3.26 | Colon, rectum |
14.53 | 7.08 | 7.63 | ||
| 7 | Cervix | 5.96 | 2.38 | 3.54 | Brain | 5.66 | 1.93 | 3.90 | Cervix | 12.14 | 5.92 | 7.18 | ||
| 8 | Brain | 5.49 | 2.20 | 3.67 | Bladder | 5.29 | 1.80 | 2.86 | Uterus | 6.55 | 3.19 | 3.77 | ||
| 9 | Pancreas | 5.41 | 2.16 | 2.81 | Leukemia | 4.77 | 1.63 | 4.00 | Brain | 5.32 | 2.59 | 3.43 | ||
| 10 | Leukemia | 4.25 | 1.70 | 3.41 | Lymphoma | 4.28 | 1.46 | 2.67 | Ovary | 5.02 | 2.45 | 3.15 | ||
| Top 10 | 211.81 | 84.73 | 117.25 | Top 10 | 264.53 | 90.25 | 150.04 | Top 10 | 169.76 | 82.71 | 92.01 | |||
aAge-standardized incidence rate (China population)
Cancer mortality of the 10 most common cancers in rural areas
Lung cancer was the leading cause of cancer death in rural registration areas for both men and women. The 10 most common cancers of death accounted for 88.76% (92.10% in males and 85.89% in females) of all cancer mortality. The other cancer types with high mortality were liver cancer, stomach cancer, colorectal cancer and esophageal cancer in males, and lung cancer, colorectal cancer, stomach cancer, liver cancer and breast cancer in females (Table 12).
Table 12. The 10 most common cancer mortality rates in rural areas 2009.
| Rank | Both |
Male |
Female |
||||||||||||||
|---|---|---|---|---|---|---|---|---|---|---|---|---|---|---|---|---|---|
| Site | Mortality rate (1/105) | (%) | ASMRC* (1/105) |
Site | Mortality rate (1/105) | (%) | ASMRC* (1/105) |
Site | Mortality rate (1/105) | (%) | ASMRC* (1/105) |
||||||
| 1 | Lung | 35.81 | 20.14 | 18.49 | Lung | 48.58 | 21.52 | 26.16 | Lung | 22.56 | 17.61 | 11.09 | |||||
| 2 | Stomach | 35.60 | 20.02 | 18.25 | Stomach | 48.41 | 21.45 | 26.07 | Stomach | 22.31 | 17.41 | 10.63 | |||||
| 3 | Liver | 29.91 | 16.82 | 16.54 | Liver | 43.11 | 19.10 | 24.65 | Esophagus | 20.09 | 15.68 | 9.39 | |||||
| 4 | Esophagus | 29.47 | 16.57 | 14.91 | Esophagus | 38.51 | 17.06 | 20.57 | Liver | 16.23 | 12.66 | 8.34 | |||||
| 5 | Colon, rectum | 8.34 | 4.69 | 4.17 | Colon, rectum | 9.20 | 4.07 | 4.88 | Colon, rectum | 7.46 | 5.82 | 3.50 | |||||
| 6 | Pancreas | 4.94 | 2.78 | 2.51 | Pancreas | 5.45 | 2.41 | 2.93 | Breast | 6.71 | 5.24 | 3.80 | |||||
| 7 | Brian | 4.19 | 2.36 | 2.62 | Brian | 4.74 | 2.10 | 3.02 | Pancreas | 4.41 | 3.44 | 2.10 | |||||
| 8 | Leukemia | 3.72 | 2.09 | 2.82 | Leukemia | 4.32 | 1.91 | 3.35 | Brain | 3.63 | 2.83 | 2.23 | |||||
| 9 | Breast | 3.36 | 1.89 | 1.92 | Lymphoma | 3.10 | 1.37 | 1.80 | Cervix | 3.42 | 2.67 | 1.88 | |||||
| 10 | Lymphoma | 2.48 | 1.40 | 1.40 | Bladder | 2.49 | 1.10 | 1.21 | Uterus | 3.23 | 2.52 | 1.73 | |||||
| Top 10 | 157.84 | 88.76 | 83.65 | Top 10 | 207.90 | 92.10 | 114.64 | Top 10 | 110.05 | 85.89 | 54.69 | ||||||
*Age-standardized mortality rate (China population)
Discussion
The year of 2009 is the first year launched National Program of Cancer Registry by the Ministry of Health in China. There were 52 new cancer registries established on the basis of existed 43 registries, supported by central finance through the program. According to the requirement of data submission from NCCR, total 95 registries should submit cancer registration data of 2009 in 2012. Till June of 2012, there were 104 cancer registries submitted data, a great increase compared to last year. In the year of 2012, total 222 registries runs cancer registration, covering 200 millions of population, making the recent goal achieved. It is supposed the number of registries is going to increase in the coming years. NCCR would focus on improving data quality, as well as expand the coverage in order to build up cancer surveillance system nationwide laying the foundations for cancer control.
To ensure accepted data valid, NCCR processes the data carefully based on the national criteria issued in program protocol. The incidence, mortality and population have to be reasonable compared with the levels in similar situation, for example, location, socioeconomic status and lifestyle. The indicators of completeness and invalidity, such as MV%, DCO%, M/I ratio, UB% and O&U% were evaluated for every registry’s data. Through the double evaluations in provincial and national level, 72 registries were identified qualified, and 32 were invalid. The valid data were pooled and analyzed to be the final result of annual report in 2009.
The statistics showing cancer incidence and mortality in 2009 were very close to the figures in 2008 (6). Although the included registries were quite different with the ones in last year, the overall incidence and mortality are reasonably stable, indicating that the pooled data was valid and could represent national cancer burden in national level. The representativeness of cancer registry in different groups, such as urban, rural, region, should be evaluated (7).
The cancer patterns are quite different between urban and rural areas in China (8). In urban areas, lung cancer, female breast cancer and colorectal cancer are major cancers with higher incidence rates than in rural areas. However, cancers from digestive system, such as, esophageal cancer, stomach cancer and liver cancer are common cancers in rural areas. Overall cancer incidence in urban areas is higher and mortality is lower than those in rural areas (8,9). The difference is due to limitation of medical resources, relative low level of cancer diagnosis and treatment, and lack of health education in counties. In urban areas, the cancer spectrum is tending to the characteristics of developed countries. The burdens of lung cancer, colorectal cancer and female breast cancer keep increasing. Cancer in rural areas still remains the cancer patterns of developing countries. Thus, the emphasis of cancer control should concern the differences and implement efficient strategies based on the results of cancer surveillance.
So far, Ministry of Health is working on action plan on prevention and control for non-communicable diseases in the twelfth 5 years. Cancer is one of the major diseases seriously threatening people’s health in China. The emphasis in rural areas would focus on professional training in primary care centers, health education/promotion, early diagnosis/treatment, especially, for common cancers in rural areas, such as esophageal cancer, stomach cancer, cervical cancer and liver cancer. In cities, behavioral intervention, such as tobacco control and healthy lifestyle, should be enhanced and cancer screening on high risk groups should be carried out in order to achieve the goal of reducing cancer mortality in the short period.
Acknowledgements
We gratefully acknowledged the cooperation of all the population-based cancer registries in providing cancer statistics, data collection, sorting, verification and database creation. The authors assume full responsibility for analyses and interpretation of these data.
Disclosure: The authors declare no conflicts of interest.
References
- 1.Parkin DM. The evolution of the population-based cancer registry. Nat Rev Cancer 2006;6:603-12 [DOI] [PubMed] [Google Scholar]
- 2.National Office for Cancer Prevention and Control, National Center for Cancer Registry, Disease Prevnetion and Control Bureau, MOH. Chinese Cancer Registry Annual Report (2010). Beijing: Military Medical Science Press, 2011. [Google Scholar]
- 3.Larsen IK, Småstuen M, Johannesen TB, et al. Data quality at the Cancer Registry of Norway: an overview of comparability, completeness, validity and timeliness. Eur J Cancer 2009;45:1218-31 [DOI] [PubMed] [Google Scholar]
- 4.Curado MP, Edwards B, Shin HR, et al. eds. Cancer Incidence in Five Continents. Vol. IX. IARC Scientific Publications No.160. Lyon: IARC, 2008. [Google Scholar]
- 5.Ferlay J. The IARC crgTools Programs. Lyon: IACR; 2006. Available online: http://www.iacr.com.fr/iarccrgtools.htm
- 6.National Office for Cancer Prevention and Control, National Center for Cancer Registry, Disease Prevnetion and Control Bureau, MOH. Chinese Cancer Registry Annual Report (2011). Beijing: Military Medical Science Press, 2011. [Google Scholar]
- 7.Li GL, Chen WQ. Representativeness of population-based cancer registration in China--comparison of urban and rural areas. Asian Pac J Cancer Prev 2009;10:559-64 [PubMed] [Google Scholar]
- 8.Chen WQ, Zheng RS, Zeng HM, et al. Trend analysis and projection of cancer incidence in China between 1989 and 2008. Zhonghua Zhong Liu Za Zhi 2012;34:517-24 [DOI] [PubMed] [Google Scholar]
- 9.Zeng HM, Zheng RS, Zhang SW, et al. Trend analysis of cancer mortality in China between 1989 and 2008. Zhonghua Zhong Liu Za Zhi 2012;34:525-31 [DOI] [PubMed] [Google Scholar]