

Abstract
Objective
To try to lower patient re-identification risks for biomedical research databases containing laboratory test results while also minimizing changes in clinical data interpretation.
Materials and methods
In our threat model, an attacker obtains 5–7 laboratory results from one patient and uses them as a search key to discover the corresponding record in a de-identified biomedical research database. To test our models, the existing Vanderbilt TIME database of 8.5 million Safe Harbor de-identified laboratory results from 61 280 patients was used. The uniqueness of unaltered laboratory results in the dataset was examined, and then two data perturbation models were applied—simple random offsets and an expert-derived clinical meaning-preserving model. A rank-based re-identification algorithm to mimic an attack was used. The re-identification risk and the retention of clinical meaning for each model's perturbed laboratory results were assessed.
Results
Differences in re-identification rates between the algorithms were small despite substantial divergence in altered clinical meaning. The expert algorithm maintained the clinical meaning of laboratory results better (affecting up to 4% of test results) than simple perturbation (affecting up to 26%).
Discussion and conclusion
With growing impetus for sharing clinical data for research, and in view of healthcare-related federal privacy regulation, methods to mitigate risks of re-identification are important. A practical, expert-derived perturbation algorithm that demonstrated potential utility was developed. Similar approaches might enable administrators to select data protection scheme parameters that meet their preferences in the trade-off between the protection of privacy and the retention of clinical meaning of shared data.
Keywords: Privacy, information dissemination, laboratory marker, electronic health records, confidentiality/legislation and jurisprudence, biomedical informatics, nlp, data-mining, clinical decision support, error management and prevention, evaluation, monitoring and surveillance, ADEs, ethical study methods, Statistical analysis of large datasets, methods for integration of information from disparate sources, distributed systems, assuring information system security and personal privacy, CDSS, internal medicine
Introduction
Electronic medical record systems (EMRs) can facilitate patient safety,1 improve quality,2 boost organizational productivity,3 4 and promote business process efficiency.5 Individuals and organizations increasingly use EMR-derived data for secondary purposes beyond direct care delivery, such as insurance claim processing, public health research, and pharmacovigilance.6 7 To investigate relationships among phenotype, genotype, and other biological markers, researchers combine EMR data with data derived from biological samples,8–12 creating biomedical research databases. This trend coincides with recent federal personalized medicine initiatives, including NIH programs supporting genome-wide association studies and whole-genome sequencing investigations.13–17
Many biomedical database projects deposit de-identified patient data combined with research-derived biological data (eg, genomic information) into shared research repositories. Investigators increasingly disseminate this data to authorized collaborators locally and at external sites.13–15 Member sites of the eMERGE (electronic MEdical Records and GEnomics) network,11 an NIH consortium, link EMR data (eg, diagnostic codes, medications, and laboratory test results17) and genetic information for research purposes. After de-identification, they subsequently deposit datasets in the database of genotype and phenotype (dbGaP),16 an NIH-managed resource that centralizes data from various genome-based studies.14 With approval from an institutional review board and NIH data access committee, scientists beyond the eMERGE network can download datasets from dbGAP.
Motivation to share de-identified, patient-level data18 competes with obligations to protect the privacy of patients.19 20 To enhance privacy while supporting biomedical research, regulators19 21 and ethicists22 recommend that patient data be de-identified before disclosure. However, as summarized below, investigations have shown that residual information in de-identified records can permit re-identification of named patients. In the context of biomedical research databases, successful re-identifications could disclose biological information about patients not present in their clinical records.
We investigated the extent to which patterns in the laboratory test results within biomedical research databases are unique and may enable patient re-identification. Additionally, we evaluated a computational approach to lowering patient re-identification risks in databases containing laboratory test results. Our approach strives to minimize changes of the clinical meaning (interpretation) of altered data. We recognize that the formal privacy protection models, such as differential privacy and k-anonymization,23 24 can provide explicit guarantees of privacy for biomedical data. Nevertheless, without significant amendments to their definitions, such models neglect expert knowledge about the clinical significance or interpretation of altered data. Thus, we adapted a privacy model based on additive random noise, which allowed us to focus on maintaining the clinical meaning of data. This study demonstrates the feasibility of an expert-derived data perturbation model to reduce re-identification risk for biomedical datasets while minimizing changes in data interpretation.
We recognize that laboratory test results constitute a relatively low risk for re-identification, since they are not disclosed publicly like other patient-specific data, such as demographic data. The potential to re-identify data through distinguishing patterns is insufficient for re-identification. A successful re-identification additionally requires a mechanism to link de-identified patterns to an identifying resource. The latter may exist in the public realm, such as voter registration lists, birth databases, and obituaries, as well as in the private realm, such as in patients' clinical charts in EMRs.25–29 When considering the risk of re-identification of health information, one should additionally consider replicability of the data (ie, the extent to which patient data consistently occurs in multiple resources) and resource availability (ie, the extent to which a recipient of de-identified data can access the information necessary to perform an identification).30 Nevertheless, the minimum necessary principle suggests that entities should disclose the minimum amount of personal health information necessary for the intended application.31 Thus, it is worthwhile to explore techniques to mitigate the re-identification risk of laboratory results in a manner that enables biomedical research.
Background
Regulations at the federal and state levels permit healthcare entities to share patients' data in a de-identified format19 for secondary purposes. The Privacy Rule of the Health Insurance Portability and Accountability Act (HIPAA) specifies several mechanisms for de-identification of patient data. HIPAA requires that either (1) 18 features be suppressed through the Safe Harbor standard, including explicit identifiers (eg, names or social security numbers), “quasi-identifiers” (eg, dates and geocodes), and unique keys (eg, medical device identifiers) or (2) an expert certifies that the dataset harbors a small risk of individually identifying the corresponding patients.19 This legislation came about after investigators demonstrated that commonly available quasi-identifiers, such as patients' birth dates, genders, and residential ZIP codes—and present in research records at the time—uniquely distinguished a significant portion of the US population.32
Current regulations do not mandate complete elimination of risk of re-identification of patients in biomedical research databases.33 Patterns which uniquely distinguish a patient may remain in data derived from EMRs, such as the set of hospitals visited by a patient,34 the billing codes assigned during a visit,35 36 the durations between hospital visits,37 and the prescription records of a patient.38 In population-based research, the family structure reported in a pedigree may also be unique.39 In genome-related databases, central to emerging biomedical research, fewer than 100 single nucleotide polymorphisms can uniquely characterize an individual.40 41 From genetic data, one might also infer familial relationships, ancestral origin, disease risk, and other patient characteristics.42–45
While the HIPAA Privacy Rule was an important initial step toward ensuring patient data privacy, the Health Information Technology for Economic and Clinical Health (HITECH) Act46 goes further. The HITECH legislation extends the privacy and security rule to business associates, requires public disclosure of data privacy breaches, toughens data privacy standards, and increases penalties on institutions violating the law.47–49 Importantly, HITECH extends the minimum necessary standard that requires releasing only the minimum amount of personal health information necessary for the purpose of use. Healthcare institutions facing this quandary might interpret this to mean they cannot release a full specific set of original clinical data to a shared biomedical research database.31 50
Our study developed a specialized expert-derived data perturbation algorithm for laboratory test results. Over several decades, a variety of formal disclosure control methods, including randomization, have been proposed. Disclosure control methods seek to minimize the inadvertent release of sensitive information (ie, re-identification through residual or inferred patterns) while maximizing the utility of the data—for example, maintaining overall statistical properties of the shared dataset or preserving truthfulness for individual-level records. Common disclosure control methods include, but are not limited to, generalization, suppression, and rounding.51 For protection at the patient level, studies adjust data to mitigate re-identification risks through generalization (eg, transformation of demographic features into less specific terms) or suppression, or controlled randomization (eg, transformation of specific values to different specific values).25 52–54 Recent statistical disclosure control studies have dealt with composite data characteristics such as skew and distribution.55 56 By specializing data randomization with expert-derived controls, this study attempts to maintain the clinical meaning of perturbed laboratory results.
Methods
Our project entailed two phases: (1) evaluation of the uniquely distinguishing nature of laboratory results data and (2) evaluation of perturbation methods to lower re-identification risks while minimizing alterations in the clinical meaning of the data.
Re-identification threat model
Our threat model, depicted in figure 1, follows the prosecutor model57 where an adversary—a clinician or researcher—has authorized access to a de-identified biomedical research database. We assume phenotype information in the de-identified database derives from still-existing records in primary-source EMRs. The de-identified database contains the test names, the temporal sequential order of the test results (excluding specific time stamps for each test), and the numerical test result values as they appear in the EMR system from which they were derived. The shared database also contains patient-specific, research-derived biological data (eg, genomic information) that is not a part of the patient's EMR record. The attacker has obtained, by legitimate or surreptitious means (from clinical records or other sources), a small amount of laboratory results data (5–7 individual test results) on a specific patient, which the attacker applies as a search key in the de-identified database.
Figure 1.
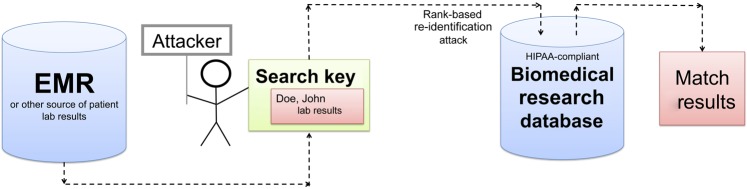
Illustration of the threat model in this study. The attacker leverages a known patient's laboratory panel as a search key to discover a corresponding record in a biomedical research database. EMR, Electronic medical record; HIPAA, Health Insurance Portability and Accountability Act.
The threat model assumes that the attacker has access to the entire biomedical research dataset to conduct the attack. To identify the closest match to the known search key that the attacker possesses, the attacker sorts all research dataset results for each laboratory test type into ascending rank order. For the search key, the attacker determines a vector comprising the relative rank of each search key test result within the corresponding dataset ranked results. After obtaining potential dataset matches that come closest in rank to ranks in the search key, the attacker evaluates the candidate matches based on the Euclidian (root mean square) distance between the search key raw data and each vector corresponding to the raw results in the dataset candidate matches. To compute useful distances, the attacker beforehand normalizes (ie, expresses each result as a multiple of the stated normal value for the test) the original raw laboratory data in the search key and normalizes the laboratory values corresponding to candidate matches. Candidates are ranked based on shortest distance to search key data. The question at hand is how accurate such rank-based attack results would be, and whether perturbing the data in some manner could decrease re-identification risks.
The search key may comprise a patient's set of 5–7 sequential results for a single laboratory test, or a single multicomponent result from a common laboratory test panel, such as a complete blood count. Consecutive results for a single test might come, for example, from a patient's log of glucose results for diabetes mellitus control or from the set of repeated prothrombin times (international normalized ratio for prothrombin time (PT-INR)) for a patient receiving warfarin. A single panel result might be conveyed in a letter sent from a physician to a patient, or obtained from an EMR.
Materials
The existing NIH-funded, institutional review board-approved Vanderbilt TIME database, containing Safe Harbor de-identified inpatient laboratory results formed a convenient test bed for our study.58 The database includes various individual test results, or panels such as the CBC (complete blood count) or CHEM7 (blood test measuring electrolytes, glucose, and renal function). A full CBC includes: hematocrit (or packed cell volume (PCV)), hemoglobin, mean corpuscular volume, red blood cell count, white blood cell count, platelet count. The CHEM7 includes: sodium, potassium, chloride, bicarbonate, blood urea nitrogen, creatinine, glucose results. Note that this study eliminated the hemoglobin results from its analyses of the CBC panels because in almost all cases the PCV (hematocrit) was 3.0 times the hemoglobin result.
The TIME study included 61 280 adult inpatients hospitalized between August 1999 and July 2003. The TIME dataset comprises 8.5 million laboratory results; of those are 211 777 CBC panels with 1 058 885 results and 239 253 CHEM7 panels with 1 674 771 results. Supplemental table 1 of the online appendix details TIME database characteristics. Current study re-identification attacks did not attempt to retrieve actual patient identities (eg, names, medical record numbers, or demographic information) from an EMR. Such information was not present in the TIME dataset. The TIME dataset used randomly generated pseudo-identifiers to identify patients. Our study only assessed if an attack could re-identify patients' pseudo-identifiers.
Re-identification risks of unaltered laboratory results
To gauge the re-identification risk of a system without protection, we calculated the uniqueness of each sequence of four, five, and six consecutive unaltered results for 10 commonly ordered individual and numerical tests, as well as for unaltered single CBC and CHEM7 panels. The 10 blood tests were: arterial pH, glucose, total calcium, absolute lymphocytes (LymAbs), PCV, PT-INR, total cholesterol, serum glutamic pyruvic transaminase (SGPT) – also known as alanine aminotransferase (ALT), creatine kinase, and albumin.
Algorithms to alter laboratory result values
We applied a “simple perturbation algorithm” to create random offsets for laboratory results. Separate analyses varied the perturbation rate p (ie, maximum perturbation percentage applied), where p ∈ {2, 5, 7, 10, 15, 20}. We identified a test-specific clinically established normal result, n, and determined a test-specific minimal increment size, s. We calculated the alteration amount (ie, offset), a, for a given laboratory result as a randomly selected value where (−pn/100) ≤ a ≤ (pn/100). The resulting offset, a, is rounded to the nearest value ±sN, where N is an integer. The offset added to the original laboratory result produces its perturbed value. For example, with perturbation rate p=5%, a normal glucose result n=100 mg/dl, and a minimal increment size of s =1 mg/dl, the simple perturbation algorithm applied to an initial glucose result of 212 mg/dl would produce an integer value between 207 and 217.
In an iterative test–evaluate–refine manner, an experienced clinician-informatician developed the “expert-derived perturbation algorithm” (full details in online appendix A). By constraining perturbations in a specific manner, the algorithm attempts to minimize changes in the clinical meaning of laboratory results. The algorithm follows from two observationally derived principles. First, the farther a laboratory result lies from its normal test range, the more uniquely identifiable that result is for a given patient. Fortunately, the farther a test is from normal, the greater the range of results into which it can be mapped without changing the clinical meaning of the result. For example, perturbing a life-threatening serum potassium (K) result from 12.0 mEq/l to 10.5 mEq/l (normal range 3.5–5.0 mEq/l) would not diminish its clinical meaning in the manner that altering a result of 4.0 mEq/l by the same absolute magnitude to become 2.5 mEq/l (an alarmingly low result) would. Second, most laboratory test results do not distribute symmetrically around their normal values. For example, a normal white blood cell result of 4000/mm3 can only be lowered by 4000 to the absolute minimum of 0. Conversely, patients with severe infections or leukemia can have values >50 000. Owing to this asymmetry, to preserve clinical meaning of test results, one should apply different perturbation offsets to low and high results.
The expert perturbation algorithm employs a binning strategy to define the clinical interpretation of a test result. For each named TIME dataset laboratory test, Vanderbilt's CLIA—certified testing laboratory—provided (a) the normal value for the test and (b) the upper and lower limits of the normal range. Using the judgment of clinician-members of our research team, we additionally determined (c) “very high” and “very low” thresholds for each test, indicative of implausible or dangerous results. We derived cut-off points for these thresholds, in part, by determining thresholds above or below which fewer results existed in the TIME dataset. A given test result falls into only one bin: (a) below very low; (b) between very low and the lower limit of normal; (c) within the normal range; (d) above the upper limit of normal to very high; and (e) above the very high threshold. The bin thresholds can be found in supplemental table 2 of the online appendix. The expert perturbation algorithm attempted to randomize original result values to their bin of origination. The expert algorithm included the same set of maximal percentage perturbations as the simple algorithm.
Assessing protection afforded by simple and expert perturbation
To gauge the protection strength of the perturbation algorithms, we used a rank-based re-identification algorithm according to the threat model described above. We applied the re-identification algorithm to the unaltered dataset and to perturbed datasets. For each perturbation algorithm, we calculated the number of times that (a) an unaltered panel's corresponding perturbed value was matched within the top 10 ranks; (b) the average rank of the match within the top 10 matches; and (c) the normalized root-mean-square distance between the unaltered panel and its corresponding perturbation. We tested for the significance of the rate of re-identification within the top 10 ranks between the simple and expert perturbation algorithms using the test of equal or given proportions with a 95% confidence level and two-sided alternative hypothesis.
Although we could not subject our data to any formal research protocol analyses, we used two proxies to assess the extent to which perturbation algorithms might influence the utility of altered laboratory results for scientific research studies. We first examined the frequency with which perturbed results moved to different range bins than the original values, using the proportion test. Second, we selected unperturbed sequences of five consecutive patient-specific tests results x 1, x 2, x 3, x 4, x 5 that were originally monotonically increasing or decreasing (ie, either x 1 ≤ x 2 ≤ x 3 ≤ x 4 ≤ x 5 or x 1 ≥ x 2 ≥ x 3 ≥ x 4 ≥ x 5). We assessed the rate at which each perturbation algorithm disrupted the monotonic nature of these result sequences. We evaluated the difference in the rates at which perturbed test results maintained their monotonic sequence nature. For the monotonic sequences, we also analyzed whether the perturbation algorithms changed the slope and Pearson correlation coefficient of a linear regression line through them. Not all monotonic sequences are linear, but linear regression provides a coarse method to analyze changes in monotonically varying data sequences. We grouped monotonic sequences for analysis based on the number of result bin boundaries spanned by initial and final sequence results (x1,x5) of the five-point series. One would expect perturbation disruptions in monotonicity to occur more often in sequences with relatively flat-sloped (ie, traversing only one bin) sequences than in steeply rising or declining sequences. The five-point sequences came from randomly selected TIME patients' serial CBC and CHEM7 results that met criteria for monotonicity.
We assessed how perturbation algorithms influenced the trade-off between re-identification risk and clinical meaning of the laboratory test results. Measuring change in clinical meaning via bin changes and assessing re-identification risk as rate of correct matches of search keys within the top 10 candidates, we summarized our results in a disclosure risk-data utility (RU) confidentiality map.59
Results
Distinguishability of unprotected laboratory results
Table 1 indicates the uniqueness of unaltered laboratory results for 10 representative tests using sequences of four, five, and six consecutive results, as well as for single CBC and CHEM7 panels. Sequences of five and six results were greater than 95% unique within the 61 280 patient dataset for glucose, calcium, LymAbs, cholesterol, SGPT, and creatine kinase. Sequences with six results were >98% unique for all tests except PCV and PT-INR. Any given CBC and CHEM7 panel had a 99% chance of being unique in the dataset.
Table 1.
Uniqueness for four, five, and six consecutive results of 10 representative laboratory tests and two panels (CBC and CHEM7)
| Individual laboratory tests | |||
| Number of consecutive laboratory tests and proportion unique (with number of items qualifying for analysis) | |||
| Test name | 4 | 5 | 6 |
| pH | 0.590 (N=83 941) | 0.937 (N=75 954) | 0.994 (N=69 175) |
| Gluc | 0.996 (N=133 259) | 1.000 (N=110 669) | 1.000 (N=93 693) |
| Ca | 0.723 (N=51 905) | 0.974 (N=41 140) | 0.998 (N=33 283) |
| LymAbs | 0.986 (N=27 591) | 0.998 (N=22 361) | 1.000 (N=18 615) |
| PCV | 0.195 (N=201 941) | 0.575 (N=172 619) | 0.886 (N=149 514) |
| PT-INR | 0.343 (N=47 768) | 0.559 (N=38 875) | 0.725 (N=32 188) |
| Chol | 1.000 (N=780) | 1.000 (N=613) | 1.000 (N=478) |
| SGPT | 0.996 (N=12 655) | 0.999 (N=9807) | 1.000 (N=7850) |
| CK | 0.963 (N=6509) | 0.979 (N=3659) | 0.986 (N=2219) |
| Alb | 0.649 (N=11 520) | 0.924 (N=8606) | 0.989 (N=6580) |
| Panel name | Laboratory panels | ||
| CBC (five components) | 0.988 (N=211 777) | ||
| CHEM7 (seven components) | 0.989 (N=239 253) | ||
Alb, albumin; Ca, calcium; CBC, complete blood count; CHEM7, blood test measuring electrolytes, glucose, and renal function; Chol, cholesterol; CK, creatine kinase; Gluc, glucose; LymAbs, absolute lymphocytes; PCV, hematocrit (packed cell volume); PT-INR, international normalized ratio for prothrombin time; SGPT, serum glutamic pyruvic transaminase.
Protection afforded by perturbation algorithms
Figure 2 illustrates the CBC and CHEM7 re-identification risks for the simple and expert perturbation algorithms. Supplemental table 3 of the online appendix shows corresponding original and perturbed average test values, first quartiles, third quartiles, maximums, and minimums. The average perturbed test results were close to the original means for both algorithms. Figure 2 shows how often the re-identification algorithm matched the actual search key values to their corresponding perturbed values within the top-10 matches. As the degree of perturbation increased, the re-identification rates decreased. For both perturbation algorithms, the top-10 match rates fell below 20% when the perturbation rate exceeded 5–7% for the CBC and exceeded 10–15% for the CHEM7. The expert and simple algorithm re-identification rates differed significantly (p value <2.2e-16) for test perturbation rates of ≥5, although the absolute magnitudes of the differences were small. Data underlying this graph appears in supplemental table 4 of the online appendix.
Figure 2.
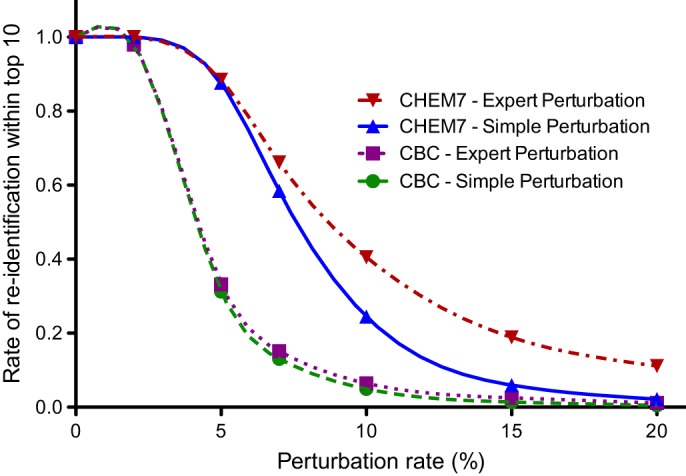
Top-10 match rate as a function of perturbation level for the protection algorithms. CBC, complete blood count; CHEM7, blood test measuring electrolytes, glucose, and renal function.
Preserving the clinical meaning of perturbed laboratory results
To assess changes in the clinical meaning of laboratory results introduced by perturbation, we analyzed the proportion of original results that moved to different result range bins from their initial bins. Figure 3 depicts the proportion of individual test results from CBC and CHEM7 panels moved by perturbation to an adjacent bin. As the perturbation level increased, the proportion of results that switched bins increased. The expert algorithm had fewer shifts than the simple algorithm (p value <2.2e-16) at perturbation rates of ≥2%. The bin crossover rate never exceeded 4% for expert perturbation or 26% for the simple perturbation algorithm. Perturbation displacements of two bins occurred only with the simple algorithm, and in <5% of instances. Data underlying this graph appears in supplemental table 5 of the online appendix.
Figure 3.
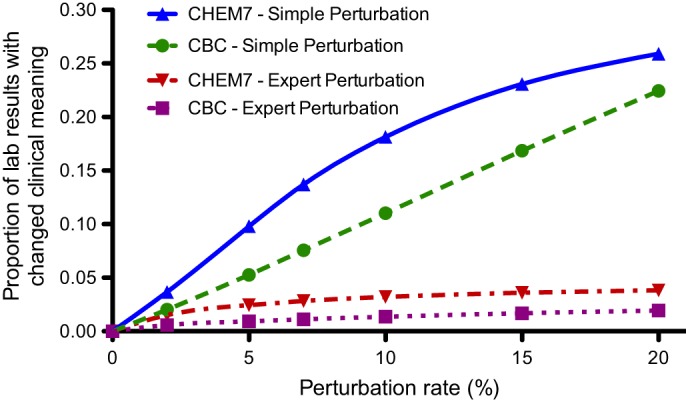
Proportion of CBC and CHEM7 laboratory results where a perturbation algorithm changed result range bins. CBC, complete blood count; CHEM7, blood test measuring electrolytes, glucose, and renal function.
We also assessed potential changes in clinical meaning of perturbed data by identifying sequences of monotonically increasing or decreasing results for a patient. We compared the slope and Pearson's R before and after perturbation. Table 2 shows results for PCV tests, which were representative of all tests. Supplemental table 6 of the online appendix contains results for all 12 components of the CBC and CHEM7 laboratory panels. The expert perturbation algorithm especially at higher perturbation rates, tended to more closely maintain the Pearson coefficient of correlation (R2) and the slope.
Table 2.
Impact of perturbation algorithms on slope and coefficient of correlation for five consecutive monotonic results for patients' hematocrit (PCV, packed cell volume) tests
| Laboratory test | Result sets (n) | Perturbation rate | Perturbation algorithm | Bins spanned | Original slope | Perturbation slope | Slope difference (%) | Original R | Perturbation R | R difference (%) |
| PCV | 1407 | 5 | Simple | 1 | −2.49 | −2.21 | 12 | −0.97 | −0.90 | 7.2 |
| PCV | 1407 | 5 | Expert | 1 | −2.49 | −2.28 | 8.4 | −0.97 | −0.91 | 6.5 |
| PCV | 1407 | 15 | Simple | 1 | −2.49 | −2.33 | 6.4 | −0.97 | −0.73 | 25 |
| PCV | 1407 | 15 | Expert | 1 | −2.49 | −2.66 | 6.6 | −0.97 | −0.78 | 19.2 |
| PCV | 951 | 5 | Simple | 2 | −3.42 | −3.06 | 11 | −0.96 | −0.92 | 5.1 |
| PCV | 951 | 5 | Expert | 2 | −3.42 | −3.11 | 9.1 | −0.96 | −0.92 | 4.9 |
| PCV | 951 | 15 | Simple | 2 | −3.42 | −3.15 | 7.8 | −0.96 | −0.80 | 17.3 |
| PCV | 951 | 15 | Expert | 2 | −3.42 | −3.33 | 2.8 | −0.96 | −0.83 | 14 |
| PCV | 98 | 5 | Simple | 3 | −5.35 | −5.03 | 6.0 | −0.95 | −0.90 | 5.2 |
| PCV | 98 | 5 | Expert | 3 | −5.35 | −4.82 | 9.9 | −0.95 | −0.89 | 5.7 |
| PCV | 98 | 15 | Simple | 3 | −5.35 | −4.86 | 9.0 | −0.95 | −0.86 | 8.6 |
| PCV | 98 | 15 | Expert | 3 | −5.35 | −5.44 | 1.7 | −0.95 | −0.87 | 7.7 |
Figure 4 presents analysis of the perturbation algorithm's disruptions of monotonic sequences. The expert perturbation algorithm maintained monotonic sequences more often than the simple algorithm. Figure 4 shows the influence of the number of bins spanned by the sequence. Statistically significant differences occurred at all tested perturbation rates of ≥7. Data underlying this graph appears in supplemental table 7 of the online appendix.
Figure 4.
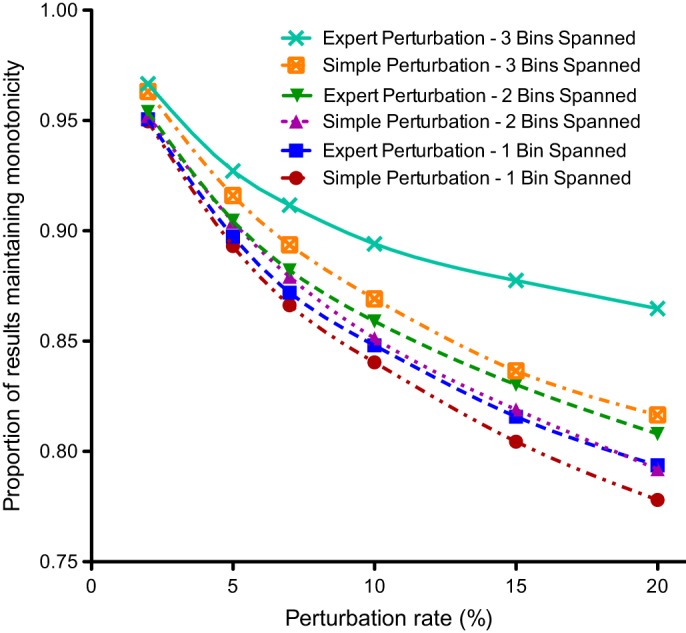
The proportion of consecutive laboratory pairs that retained their original monotonic trajectory after perturbation.
Comparing retention of clinical meaning and re-identification risk for two algorithms
Figure 5 is a disclosure RU confidentiality map. It illustrates how re-identification rates change in comparison rates of preservation of clinical meaning (in bin changes) for each algorithm at various perturbation levels. At each perturbation rate, the simple-to-expert algorithm differences in re-identification rates were small. In contrast, the expert algorithm maintained clinical meaning substantially better than the simple algorithm, especially at larger perturbation rates.
Figure 5.
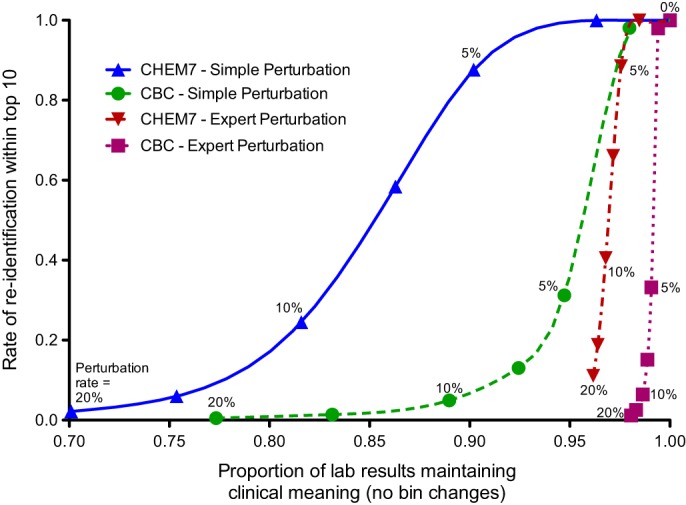
Disclosure risk-data utility map that compares the proportion of results that retain their clinical meaning after perturbation and the rate of correctly re-identifying a search key in a dataset. The points along the lines represent the perturbation rates of, from left to right, 20, 15, 10, 7, 5, and 2%. The rightmost point represents analysis of unaltered test panel results. CBC, complete blood count; CHEM7, blood test measuring electrolytes, glucose, and renal function.
Discussion
This study used 8.5 million test results from 61 280 inpatients to illustrate how biomedical research databases carry the potential for re-identification based on the laboratory results they include. Most sequences of five and six consecutive patient laboratory results were at least 95% unique; two common test panels' results, CBC and CHEM7, were over 99% unique. To address such risks, we developed and evaluated two laboratory test result protection algorithms—“baseline” simple perturbation and a clinical knowledge-derived expert perturbation scheme. The expert algorithm compensated for asymmetry and skews in the distributions of test result values and attempted to maintain the clinical meaning of the results.
For all perturbation rates, the expert algorithm exhibited slightly higher re-identification risk than the simple algorithm. However, for several metrics, the expert perturbation algorithm was disproportionately better in maintaining the meaning of test results (eg, figure 5).59 Authors envision future institutions using similar approaches to meet protection goals while maintaining the clinical meaning of the shared laboratory results. Our approach enables institutions to determine acceptable re-identification risk levels, specify acceptable data permutation limits, and then use an RU confidentiality map to determine in an informed manner what the trade-offs are.
Our investigation had several limitations. The study used laboratory results derived from a single tertiary-care medical center. Referral hospitals with exceptionally ill patients might have atypical laboratory result distributions. Others should replicate our study using different populations. Additionally, if a biomedical research database remains within the confines of one institution, administrators can, and typically do, set strict disciplinary policies and monitor data access by employees. When penalties are high, detection mechanisms sound, and attack rates low, the robustness of protection schemes need not be very high. Better protection is desirable, however, when institutions share data across local boundaries. Monitoring is more difficult then, since shared research dataset administrators know who downloads the dataset, but they cannot know how researchers remotely analyze downloaded data. Lacking an audit trail, one might not detect a re-identification attack. Furthermore, while the data perturbation algorithms proposed in this work provide increased re-identification risk protection compared with the absence of data perturbation, they do not guarantee protection. Additional studies should determine the degree of protection provided by algorithms similar to ours, and further research may allow better algorithms to evolve. In addition, future studies should employ a wider range of attack models. Re-identification risks do not solely derive from laboratory data—true risk assessment must consider triangulated attacks that also incorporate other pieces of information (eg, demographics). Future studies should ideally assess the degree to which data perturbation algorithms might affect scientific study results by applying analyses to both unaltered and perturbed datasets obtained by the research protocols.
Conclusion
This feasibility study developed and evaluated a practical, expert-derived perturbation algorithm for reducing re-identification risks for research datasets containing laboratory results data. With a growing need for research-related clinical data sharing, and in view of healthcare-related federal privacy regulation, methods to mitigate risks of re-identification are important. Laboratory results data in biomedical research databases are highly distinguishable in the absence of data perturbation. Our study demonstrated the ability of expert-derived data perturbation algorithms to reduce laboratory result distinguishability while potentially minimizing the changes in clinical meaning of the perturbed data. Our preliminary study results merit further investigation.
Acknowledgments
The authors thank Latanya Sweeney for supporting this work as a subcontract to her R01 grant and for helpful discussions.
Footnotes
Funding: This study was supported, in part, by National Institutes of Health R01LM009018, R01LM010828, R01LM007995, T15LM007450, T32GM07347, 1U01HG006378, and 1U01HG006385 grants.
Competing interests: None.
Ethics approval: Ethics approval was provided by Vanderbilt institutional review board.
Provenance and peer review: Not commissioned; externally peer reviewed.
References
- 1. Boaden R, Joyce P. Developing the electronic health record: what about patient safety? Health Serv Manage Res 2006;19:94–104 [DOI] [PubMed] [Google Scholar]
- 2. Chaudhry B, Wang J, Wu S, et al. Systematic review: impact of health information technology on quality, efficiency, and costs of medical care. Ann Intern Med 2006;144:742–52 [DOI] [PubMed] [Google Scholar]
- 3. Evans DC, Nichol WP, Perlin JB. Effect of the implementation of an enterprise-wide electronic health record on productivity in the Veterans Health Administration. Health Econ Policy Law 2006;1:163–9 [DOI] [PubMed] [Google Scholar]
- 4. James B. E-health: steps on the road to interoperability. Health Aff (Millwood) 2005;Suppl Web Exclusives:W5–26–W5–30. [DOI] [PubMed] [Google Scholar]
- 5. Soti P, Pandey S. Business process optimization for RHIOs. J Healthc Inf Manag 2007;21:40–7 [PubMed] [Google Scholar]
- 6. Safran C, Bloomrosen M, Hammond WE, et al. Toward a national framework for the secondary use of health data: an American Medical Informatics Association White Paper. J Am Med Inform Assoc 2007;14:1–9 [DOI] [PMC free article] [PubMed] [Google Scholar]
- 7. Bloomrosen M, Detmer D. Advancing the framework: use of health data–a report of a working conference of the American Medical Informatics Association. J Am Med Inform Assoc 2008;15:715–22 [DOI] [PMC free article] [PubMed] [Google Scholar]
- 8. Kullo IJ, Fan J, Pathak J, et al. Leveraging informatics for genetic studies: use of the electronic medical record to enable a genome-wide association study of peripheral arterial disease. J Am Med Inform Assoc 2010;17:568–74 [DOI] [PMC free article] [PubMed] [Google Scholar]
- 9. Lemke AA, Wolf WA, Hebert-Beirne J, et al. Public and biobank participant attitudes toward genetic research participation and data sharing. Public Health Genomics 2010;13:368–77 [DOI] [PMC free article] [PubMed] [Google Scholar]
- 10. Roden DM, Pulley JM, Basford MA, et al. Development of a large-scale de-identified DNA biobank to enable personalized medicine. Clin Pharmacol Ther 2008;84:362–9 [DOI] [PMC free article] [PubMed] [Google Scholar]
- 11. McCarty CA, Chisholm RL, Chute CG, et al. The eMERGE Network: a consortium of biorepositories linked to electronic medical records data for conducting genomic studies. BMC Med Genomics 2011;4:13. [DOI] [PMC free article] [PubMed] [Google Scholar]
- 12. The Electronic Medical Records & Genomics (eMERGE) Network. https://www.mc.vanderbilt.edu/victr/dcc/projects/acc/index.php/Main_Page (accessed 27 Feb 2012).
- 13. Guttmacher AE, Collins FS. Realizing the promise of genomics in biomedical research. JAMA 2005;294:1399–402 [DOI] [PubMed] [Google Scholar]
- 14. National Institutes of Health Final NIH Statement On Sharing Research Data. NOT-OD-03–032. National Institutes of Health, 2003 [Google Scholar]
- 15. National Institutes of Health Policy for Sharing of Data Obtained in NIH Supported or Conducted Genome-Wide Association Studies (GWAS). NOT-O-07–088. National Institutes of Health, 2007 [Google Scholar]
- 16. Mailman MD, Feolo M, Jin Y, et al. The NCBI dbGaP database of genotypes and phenotypes. Nat Genet 2007;39:1181–6 [DOI] [PMC free article] [PubMed] [Google Scholar]
- 17. Kho AN, Hayes MG, Rasmussen-Torvik L, et al. Use of diverse electronic medical record systems to identify genetic risk for type 2 diabetes within a genome-wide association study. J Am Med Inform Assoc 2012;19:212–18 [DOI] [PMC free article] [PubMed] [Google Scholar]
- 18. Fienberg SE. Should we continue to release public-use microdata files? Yes, Yes, Yes! Proceedings of the Section on Government Statistics, American Statistical Association. Dallas, Texas, 1998:8–12 http://books.google.com/books/about/1998_proceedings_of_the_Section_on_Gover.html?id=WJInAQAAMAAJ [Google Scholar]
- 19. Department of Health and Human Services Standards for Privacy of Individually Identifiable Health Information, Final Rule. Federal Register, 45 CFR, Parts 160–4. Federal Government, 2002 [PubMed] [Google Scholar]
- 20. Lunshof JE, Chadwick R, Vorhaus DB, et al. From genetic privacy to open consent. Nat Rev Genet 2008;9:406–11 [DOI] [PubMed] [Google Scholar]
- 21. Department of Health and Human Services HIPAA Administrative Simplification: Enforcement, Interim Final Rule. Federal Register, 45 CFR, Part 160. Federal Government, 2009 [Google Scholar]
- 22. McGuire AL, Gibbs RA. Genetics. No longer de-identified. Science 2006;312:370–1 [DOI] [PubMed] [Google Scholar]
- 23. Sweeney L. k-anonymity: a model for protecting privacy. IJUFKS 2002;10:557–70 [Google Scholar]
- 24. Dwork C. Differential privacy. In: Bugliesi M, Preneel B, eds. Proceedings of the International Colloquium on Automata, Languages, and Programming (ICALP). Springer Lecture Notes in Computer Science, 2006;4052:1–12 [Google Scholar]
- 25. El Emam K, Dankar FK. Protecting privacy using k-anonymity. J Am Med Inform Assoc 2008;15:627–37 [DOI] [PMC free article] [PubMed] [Google Scholar]
- 26. Lowrance WW, Collins FS. Ethics. Identifiability in genomic research. Science 2007;317:600–2 [DOI] [PubMed] [Google Scholar]
- 27. Sweeney L. Weaving technology and policy together to maintain confidentiality. J Law Med Ethics 1997;25:98–110 [DOI] [PubMed] [Google Scholar]
- 28. Malin BA. An evaluation of the current state of genomic data privacy protection technology and a roadmap for the future. J Am Med Inform Assoc 2005;12:28–34 [DOI] [PMC free article] [PubMed] [Google Scholar]
- 29. Benitez K, Malin B. Evaluating re-identification risks with respect to the HIPAA privacy rule. J Am Med Inform Assoc 2010;17:169–77 [DOI] [PMC free article] [PubMed] [Google Scholar]
- 30. Malin B, Loukides G, Benitez K, et al. Identifiability in biobanks: models, measures, and mitigation strategies. Hum Genet 2011;130:383–92 [DOI] [PMC free article] [PubMed] [Google Scholar]
- 31. Sanger LJ. HIPAA Goes HITECH. University of Houston Health Law Perspectives. 2009. http://www.law.uh.edu/healthlaw/perspectives/2009/(LS)%20HITECH.pdf [Google Scholar]
- 32. Sweeney L. Uniqueness of the Simple Demographics of the US Population. Working Paper LIDAP-WP4. Pittsburgh, Pennsylvania: Laboratory for International Data Privacy, Carnegie Mellon University, 2000 [Google Scholar]
- 33. Malin B, Karp D, Scheuermann RH. Technical and policy approaches to balancing patient privacy and data sharing in clinical and translational research. J Investig Med 2010;58:11–18 [DOI] [PMC free article] [PubMed] [Google Scholar]
- 34. Malin B, Sweeney L. How (not) to protect genomic data privacy in a distributed network: using trail re-identification to evaluate and design anonymity protection systems. J Biomed Inform 2004;37:179–92 [DOI] [PubMed] [Google Scholar]
- 35. Loukides G, Denny JC, Malin B. The disclosure of diagnosis codes can breach research participants' privacy. J Am Med Inform Assoc 2010;17:322–7 [DOI] [PMC free article] [PubMed] [Google Scholar]
- 36. Tamersoy A, Loukides G, Denny JC, et al. Anonymization of administrative billing codes with repeated diagnoses through censoring. AMIA Annu Symp Proc 2010;2010:782–6 [PMC free article] [PubMed] [Google Scholar]
- 37. Tamersoy A, Loukides G, Nergiz ME, et al. Anonymization of longitudinal electronic medical records. IEEE Trans Inf Technol Biomed 2012;16:413–23 [DOI] [PMC free article] [PubMed] [Google Scholar]
- 38. El Emam K, Kosseim P. Privacy interests in prescription data, part 2: patient privacy. Security Privacy, IEEE Security and Privacy Magazine 2009;7:75–8 [Google Scholar]
- 39. Malin B. Re-identification of familial database records. AMIA Annu Symp Proc 2006:524–8 [PMC free article] [PubMed] [Google Scholar]
- 40. Lin Z, Owen AB, Altman RB. Genetics. Genomic research and human subject privacy. Science 2004;305:183. [DOI] [PubMed] [Google Scholar]
- 41. Lin Z, Altman RB, Owen AB. Confidentiality in genome research. Science 2006;313:441–2 [DOI] [PubMed] [Google Scholar]
- 42. Cassa CA, Schmidt B, Kohane IS, et al. My sister's keeper?: genomic research and the identifiability of siblings. BMC Med Genomics 2008;1:32. [DOI] [PMC free article] [PubMed] [Google Scholar]
- 43. Phillips C, Salas A, Sánchez JJ, et al. Inferring ancestral origin using a single multiplex assay of ancestry-informative marker SNPs. Forensic Sci Int Genet 2007;1:273–80 [DOI] [PubMed] [Google Scholar]
- 44. Kayser M, Schneider PM. DNA-based prediction of human externally visible characteristics in forensics: motivations, scientific challenges, and ethical considerations. Forensic Sci Int Genet 2009;3:154–61 [DOI] [PubMed] [Google Scholar]
- 45. Ossorio PN. About face: forensic genetic testing for race and visible traits. J Law Med Ethics 2006;34:277–92 [DOI] [PubMed] [Google Scholar]
- 46. Health Information Technology for Economic and Clinical Health (HITECH) Act—42 USC Ch 156. http://www.gpo.gov/fdsys/pkg/USCODE-2010-title42/html/USCODE-2010-title42-chap156.htm
- 47. Steinbrook R. Health care and the American Recovery and Reinvestment Act. N Engl J Med 2009;360:1057–60 [DOI] [PubMed] [Google Scholar]
- 48. May M. Focus on electronic health records. ‘HIPAA2’ legislation means more delicate handling of data. Nat Med 2010;16:250. [DOI] [PubMed] [Google Scholar]
- 49. Blumenthal D. Stimulating the adoption of health information technology. N Engl J Med 2009;360:1477–9 [DOI] [PubMed] [Google Scholar]
- 50. Gallagher LA. Revisiting HIPAA. Nurs Manage 2010;41:34–9 [DOI] [PubMed] [Google Scholar]
- 51. Domingo-Ferrer J, Torra V. Disclosure Control Methods and Information Loss For Microdata. http://citeseerx.ist.psu.edu/viewdoc/download?doi=10.1.1.91.1046&rep=rep1&type=pdf (accessed 27 Mar 2012)
- 52. El Emam K, Dankar FK, Issa R, et al. A Globally Optimal K-Anonymity method for the de-identification of health data. J Am Med Inform Assoc 2009;16:670–82 [DOI] [PMC free article] [PubMed] [Google Scholar]
- 53. Wang DW, Liau CJ, Hsu TS. Medical privacy protection based on granular computing. Artif Intell Med 2004;32:137–49 [DOI] [PubMed] [Google Scholar]
- 54. Elliot M. Using Targeted Perturbation of Microdata to Protect Against Intelligent Linkage. Manchester, United Kingdom: Centre for Census and Survey research, 2007. http://www.unece.org/fileadmin/DAM/stats/documents/2007/12/confidentiality/wp.14.e.pdf (accessed 27 Mar 2012). [Google Scholar]
- 55. Cassa CA, Grannis SJ, Overhage JM, et al. A context-sensitive approach to anonymizing spatial surveillance data: impact on outbreak detection. J Am Med Inform Assoc 2006;13:160–5 [DOI] [PMC free article] [PubMed] [Google Scholar]
- 56. Muralidhar K, Batra D, Kirs PJ. Accessibility, security, and accuracy in statistical databases: the case for the multiplicative fixed data perturbation approach. Manag Sci 1995;41:1549–64 [Google Scholar]
- 57. Elliot M, Dale A. Scenarios of Attack: the Data Intruder's Perspective on Statistical Disclosure Risk. Netherlands Official Statistics, 1999;14:6–10 http://www.cbs.nl/NR/rdonlyres/C3E1B07E-1893-4809-9955-50DEA2B9ADA6/0/nos991.pdf [Google Scholar]
- 58. FitzHenry F, Peterson JF, Arrieta M, et al. Medication administration discrepancies persist despite electronic ordering. J Am Med Inform Assoc 2007;14:756–64 [DOI] [PMC free article] [PubMed] [Google Scholar]
- 59. Duncan GT, Stokes SL. Disclosure risk vs. data utility: the R-U confidentiality map as applied to topcoding. Chance 2004;17:16–20 [Google Scholar]