

Abstract
Background
Our objective was to quantify and predict diabetes risk reduction during the Diabetes Prevention Program Outcomes Study (DPPOS) among those who returned to normal glucose regulation (NGR) at least once during DPP compared to those who were consistently considered to have pre-diabetes.
Methods
Diabetes cumulative incidence in DPPOS was calculated for subjects with NGR or pre-diabetes status during DPP with and without stratification by prior randomized treatment group. Cox proportional hazards modeling and generalized linear mixed models were used to quantify the impact of previous (DPP) glycemic status on risk of later (DPPOS) diabetes and NGR status, respectively, per standard deviation in change. Included in this analysis are 1990 participants of DPPOS (who had been randomized during DPP: N=736 in intensive lifestyle (ILS), N=647 to metformin (MET), and N=607 to placebo (PLB)).
Findings
Diabetes risk during DPPOS was 56% lower in NGR vs. pre-diabetes (HR=0.44, 95% CI 0.37-0.55, p<0.0001) and was unaffected by prior group assignment (interaction test for NGR*ILS, p=0.1722; NGR*MET, p=0.3304). Many, but not all, of the variables that increased diabetes risk were inversely associated with the chance of reaching NGR status in DPPOS. Specifically, having had prior NGR (OR=3.18, 95% CI 2.71-3.72, p<0.0001), higher β-cell function (OR=1.28; 95% CI 1.18-1.39, p<0.0001) and insulin sensitivity (OR=1.16, 95% CI 1.08-1.25, p<0.0001) were associated with NGR in DPPOS, whereas the opposite was true for predicting diabetes (HR=0.80, 95% CI 0.71-0.89; HR=0.83, 95% CI 0.74-0.94, respectively, p<0.0001 for both). Surprisingly, among subjects who failed to return to NGR in DPP, those randomized to ILS had a higher diabetes risk (HR=1.31, 95% CI 1.03-1.68, p=0.0304) and lower chance of NGR (OR=0.59, 95% CI 0.42-0.82, p=0.0014) vs. placebo in DPPOS.
Interpretation
We conclude that pre-diabetes represents a high-risk state for diabetes, especially among those who remain so despite ILS. Reversion to NGR, even if transient, is associated with a significantly lower risk of future diabetes independent of prior treatment group.
Introduction
Current estimates from the Centers for Disease Control indicate that approximately 79 million Americans have impaired fasting glucose and/or impaired glucose tolerance, collectively termed “pre-diabetes” (1). Screening for pre-diabetes is advocated as it represents a very high risk state for future type 2 diabetes and carries risk of diabetic complications in and of itself (2-5). Clinical trials for diabetes prevention around the globe have largely enrolled participants with untreated pre-diabetes due to their ∼11%/year incidence rate for acquiring diabetes, when both fasting and post-prandial plasma glucose levels are elevated (6-12). Even when overt diabetes is delayed or prevented, both micro- and macrovascular disease appears more prevalent in those with pre-diabetes compared to their normoglycemic peers (2-5). Thus, there is reason to believe that true prevention of diabetes and its complications likely resides in the reversal of pre-diabetes and the restoration of normal glucose regulation (NGR).
A number of clinical trials have examined the feasibility and efficacy of lifestyle and/or medications at preventing diabetes in people with pre-diabetes (6-15). Together, these studies have demonstrated reductions between 25 and 72% in the incidence of diabetes over 2.4 to 6 year intervention periods, with most participants remaining with pre-diabetes. Less often discussed are the 20-50% of participants that not only did not progress, but in fact, reverted to NGR (fasting glucose <5.6 mmol/l and 2h glucose <7.8 mmol/l) (7-10). Three of these studies, STOP NIDDM (7), DREAM (9) and ACT NOW (13), make particular mention of a subgroup who achieved normal glycemic status, but offer no detail as to the demographics or predictive factors. We previously published a post-hoc analysis from the Diabetes Prevention Program (DPP) examining predictors for the restoration of NGR (16). This analysis revealed that better β-cell function and younger age, as well as weight loss and intensive lifestyle intervention (ILS) – independent of one another - were related to regression to NGR. Following completion of the DPP, The Diabetes Prevention Program Outcomes Study (DPPOS) was initiated which afforded a unique opportunity to determine the perseverance of predictors of NGR – treatment-related or otherwise - and also to quantify long-term diabetes risk reduction in participants who achieved NGR. In pursuit on this objective, we hypothesized that those reaching NGR would have a significant and enduring decreased risk of incident diabetes compared to those with persistent pre-diabetes.
Research Design & Methods
The DPPOS is an observational follow-up to a randomized clinical trial performed at 27 centers involving 2,761 persons who were at high risk for diabetes. The detailed methods have been reported (17) and the protocol is available at http://www.bsc.gwu.edu/dpp. Institutional review boards at each center approved the protocol, and all participants gave written informed consent prior to participation.
Participants
Participants were followed a median time of 3.2 years during the intervention phase of the DPP, which formally ended July 31, 2001. All active DPP participants were eligible for entry into DPPOS. Eighty-six percent (2,761 of the 3,234 in DPP) enrolled in DPPOS after a 13-month “bridge” period (the transition between DPP and DPPOS protocols) that followed the termination of DPP (August 1, 2001 – August 31, 2002). Participants formerly randomized to lifestyle (ILS; n=909), metformin (MET; n=921) and placebo (PLB; n=931) were followed for a median time of 5.7 years during DPPOS (mean time 5.4 years; range 0.01-5.98 years; September 1, 2002 - October 31, 2008). Seventy-two percent (1,990 of 2,761) of the participants in DPPOS (ILS; n=736, MET; n=647, PLB, n=607) were classified as having persistent pre-diabetes or restoration of NGR over the 5.7-year follow-up for DPPOS (see “assessments” below), hence were included in this analysis. Those who progressed to diabetes (ILS; n=173, MET; n=274, PLB, n=324) during DPPOS were excluded (Figure 1).
Figure 1.
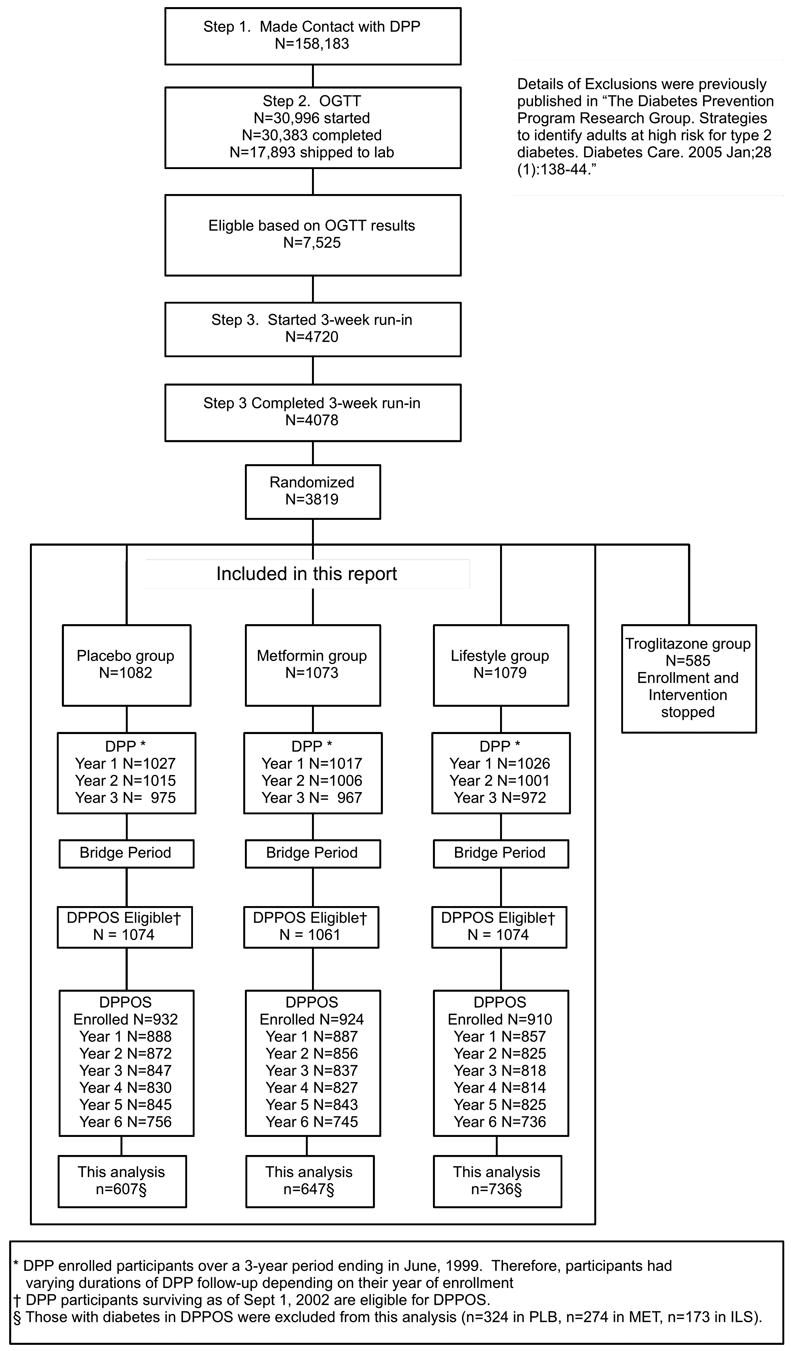
Study design and participants flow of DPP, bridge, DPPOS and this analysis. Figure is adapted from reference 17.
Interventions
As mentioned above, DPPOS is a post-intervention ongoing observational study. Nevertheless, given the diabetes risk reduction observed from the interventions during DPP, all participants were offered group-implemented lifestyle sessions prior to the start of DPPOS, including those who had been randomized to the intensive lifestyle arm during DPP (18). The sessions were available quarterly for all participants (termed “HELP”), whereas lifestyle participants could attend up to 4 additional classes per year (termed “BOOST”). Open-label metformin was also continued in participants initially randomized to metformin (850 mg twice daily as tolerated) during DPPOS, unless discontinued for the development of diabetes requiring management outside of the protocol or for safety reasons.
Assessments
Outcome assessments during DPPOS continued on the same 6 and 12-month schedule as in DPP. The primary outcome, as in the DPP, was development of diabetes – fasting plasma glucose ≥7.0 mmol/l and/or 2-hour glucose ≥11.0 mmol/l after a 75g oral glucose challenge (confirmed on repeat testing) (19). For the current analysis, participants were classified as NGR if they achieved a fasting plasma glucose <5.6 mmol/l and 2-hour plasma glucose <7.8 mmol/l at least once on annual OGTT during the DPP period, and never met the criteria for the diagnosis of diabetes (as above). Participants were classified as having “pre-diabetes” (19) if they consistently had fasting plasma glucose levels of 5.6-6.9 mmol/l and/or 2-hour plasma glucose levels of 7.8-11.0 mmol/l on annual oral glucose tolerance testing (OGTT) during the DPP period, and never met the criteria for the diagnosis of diabetes (as above). Participants with a confirmed diagnosis of diabetes during DPP were excluded from this analysis, hence not part of the cohort described.
Weight, blood pressure, plasma lipids, and medication history were obtained on annual exam using published methods (20). Measures of β-cell function (corrected insulin response (CIR) = (100 × 30 minute insulin)/(30 minute glucose) × (30 minute glucose -70)) (pmol/l) and insulin sensitivity (1/[fasting insulin]) (l/pmol) were calculated using validated indices (21).
Statistical Analyses
The cumulative incidence of diabetes during DPPOS, as well as probabilities of reaching NGR during DPPOS, were calculated and compared for participants classified as NGR vs. pre-diabetes during DPP. Predictors of diabetes risk were evaluated using sequential Cox Proportional Hazards models since the groups were defined during the randomized DPP period. Generalized mixed models were employed to model probabilities of reaching NGR during DPPOS because of the need for adjustment in group differences at the beginning of the non-randomized DPPOS follow-up. We did not attempt to adjust models for attendance in the bridge. This was not done because groups were defined in DPP (pre-bridge) and attendance during the bridge was generally low. Wecannot exclude that attendance during the bridge affected NGR status or diabetes development during DPP (as evidenced by the higher attendance in those who were NGR during DPP), yet attendance was higher for those who remained NGR with PLB vs. ILS during DPP making its contribution suspect. In the Cox Proportional Hazards model, hazard ratios (HR) for continuous variables are presented as the ratio in hazards for one SD increase in the predictor; and for categorical variables, HR are calculated as the ratio between each category and the reference group. A HR >1 indicates greater ‘risk’ for diabetes. However, in the generalized linear mixed models, an odds ratio (OR) >1 indicates higher chance of reaching NGR. Interactions between DPP NGR status and treatment group were tested to determine if the impact of previous NGR status varied for subjects receiving different treatments in DPP. P-values for individual covariates were calculated using the Wald test and the likelihood ratio test for the overall model. Significance was set at an alpha level of 0.05. All analyses were conducted using SAS software (Version 9.2; SAS Institute, Cary, NC). In order to demonstrate the natural history of insulin sensitivity and secretion over both the intervention period (DPP) and the observation period (DPPOS) in people who returned to NGR vs. those who remained with pre-diabetes, estimates of these metabolic parameters are presented in Figure 4A & B separately rather than together (as the disposition index). Of note, results were not adjusted for multiple comparisons, as analyses were post-hoc and exploratory with the intention of generating hypotheses and discussion on this topic.
Figure 4.


Insulin secretion (corrected insulin response; A) and insulin sensitivity (1/[fasting insulin]; B) in those with pre-diabetes and normal glucose regulation (NGR) at baseline (BAS) and by year of DPP and DPPOS. Data are presented as mean +/- SD. Dotted line denotes the “bridge” period.
Role of the funding source
The sponsor of this study was represented on the Steering Committee and played a role in the study design, its execution and the plans for publication. The funding agency was not represented in the writing groups, but could give input on proposed publications resulting from the study. All authors in the writing group had access to all data. The corresponding author had the final decision to submit this manuscript for publication.
Results
Lifestyle Adherence During the “Bridge”
The average number of lifestyle sessions attended during the bridge period was 2.87 (SD=4.73, 95% CI 0-14) in ILS, 5.35 (SD=5.95, 95% CI 0-16) in MET and 5.34 (SD=5.99, 95% CI 0-15) in PLB. Those who had attained NGR during DPP (N=894) attended more sessions (mean =4.61, SD=5.71) compared to those who remained with pre-diabetes (N=1096) during DPP (mean=4.28, SD=5.63, p=0.0086 vs. NGR). The number of lifestyle sessions attended during the “bridge” period between DPP and DPPOS was lower for those randomized to ILS vs. MET or PLB during DPP (p<0.0001), and was slightly higher for those achieving NGR (N=394, mean=3.24, SD=5.05) vs. pre-diabetes (N=342, mean=2.44, SD=4.30) within ILS (p=0.0229) and PLB (NGR: N=226, mean=5.96, SD=5.85; pre-diabetes: N=381, mean=4.97, SD=6.05; p=0.0490), but not MET (NGR: N=274, mean=5.48, SD=6.07; pre-diabetes: N=373, mean=5.26, SD=5.87; p=0.6450).
Demographic and Metabolic Information at the Beginning of DPPOS
Baseline characteristics for the DPP and DPPOS cohorts have been previously published (17, 22). Demographic and metabolic information at baseline of DPPOS is presented in Table 1 stratified by pre-specified glycemic status (eg. pre-diabetes vs, NGR; all with diabetes were excluded). Briefly, race/ethnicity, gender, BMI and activity levels were similar at the outset of DPPOS for all treatment groups whether they had attained NGR during DPP or not. By definition, plasma fasting and 2h glucose concentrations were higher for those with pre-diabetes vs. NGR. Estimates of β-cell function and insulin sensitivity were higher in NGR vs. pre-diabetes (difference=0.0011, p=0.0017 in ILS; difference=0.00100, p=0.0399 in MET; difference=0.0100, p=0.0007 in PLB). Waist circumference was also lower in NGR vs. pre-diabetes in the ILS group (p<0.05). Weight loss during DPP was greater in those who attained NGR status (vs. those who were consistently pre-diabetes) for each active treatment group during DPP: 5.54% vs. 2.37% weight loss in ILS (p<0.0001), 3.71% vs. 2.01% weight loss in MET (p=0.0041) and 1.29% vs. 0.43% weight loss in PLB (p=0.1436). However, those who had been NGR in DPP subsequently gained more weight during DPPOS (NGR vs. pre-diabetes: 4.92 vs. 2.01%, p<0.0001 in ILS; 4.79 vs. 2.64%, p=0.0057 in MET; 1.95 vs. 0.94%, p=0.1731 in PLB) regardless of prior treatment.
Table 1.
Demographic and Metabolic Information at the Beginning of DPPOS
| ILS | MET | PLB | ||||||
|---|---|---|---|---|---|---|---|---|
|
| ||||||||
| NGR | Pre-diabetes | NGR | Pre-diabetes | NGR | Pre-diabetes | Total NGR | Total Pre-diabetes | |
|
| ||||||||
| Sample size | 394 | 342 | 274 | 373 | 226 | 381 | 894 | 1096 |
| White(%) | 54 | 53 | 54 | 60 | 59 | 55 | 167 | 168 |
| African American(%) | 19 | 19 | 22 | 18 | 17 | 20 | 58 | 57 |
| Hispanic(%) | 15 | 16 | 15 | 15 | 12 | 17 | 42 | 48 |
| Asian(%) | 5 | 7 | 3 | 4 | 4 | 4 | 12 | 15 |
| Native American (%) | 7 | 6 | 7 | 4 | 8 | 5 | 22 | 15 |
| Female (%) | 69 | 65 | 63 | 69 | 73 | 68 | 205 | 202 |
| BMI (kg/m2) | 32(7) | 33(6) | 33(7) | 33(6) | 33(7) | 33(7) | 33(7) | 33(6) |
| Waist (cm) | 100(17)* | 102(15) | 101(15) | 102(13) | 100(15) | 103(15) | 101(16) | 103(14) |
| Activity (met/hr/wk) | 20(18) | 17(17) | 17(19) | 19(22) | 17(14) | 17(20) | 18(16) | 17(20) |
| Caloric intake (kcal/d) | 1748(746) | 1626(602) | 1916(723)* | 1824(759) | 1718(725) | 1783(803) | 1766(731) | 1716(721) |
| Fasting plasma glucose (mmol/l) | 5.61±0.62* | 5.99±0.64 | 5.49±0.58* | 5.83±0.61 | 5.55±0.50* | 5.94±0.62 | 5.55±0.61* | 5.92±0.62 |
| 2-hour plasma glucose (mmol/l) | 7.66±2.17* | 8.99±2.30 | 7.60±2.00* | 8.77±2.08 | 7.60±2.16* | 8.6±2.02 | 7.62±2.11* | 8.79±2.13 |
| Insulin sensitivity (l/pmol) | 9.22±8.87* | 7.63±5.51 | 8.78±7.78* | 7.92±4.86 | 8.78±7.33* | 7.34±5.03 | 8.93±7.99* | 7.63±5.13 |
| β-cell function (pmol/l) | 5.62±4.29* | 4.1±3.66 | 5.76±2.99* | 4.24±3.04 | 5.63±3.04* | 4.24±2.57 | 5.67±3.44* | 4.19±3.09 |
|
| ||||||||
Data are percentages for categorical variables and mean±SD for continuous variables
p<0.05 NGR vs. Pre-diabetes, defined in and stratified by treatment group during DPP
The race/ethnicity, sex, BMI, waist circumference, physical activity, caloric intake, glucose and insulin measures were taken at the first DPPOS yearly visit. “Asian” race/ethnicity refers to those self-reporting of Asian origin, including Chinese, Filipino, Korean, Vietnamese, Asian Indian, or other.
ILS = intensive lifestyle intervention
MET = metformin
PLB = placebo
NGR = normal glucose regulation
DM = diabetes mellitus
BMI = body mass index
Insulin sensitivity estimated by 1/[fasting insulin]
β-cell function assessed using the Corrected Insulin Response (CIR)
Progression to diabetes during DPPOS
Participants who were able to achieve NGR status at least once during DPP had a 56% lower risk of diabetes during DPPOS (HR=0.44, 95% CI 0.37-0.55, p<0.0001; Figure 2). Diabetes risk reduction was strongly associated with the number of times NGR was achieved. Specifically, diabetes risk was reduced 47% in DPPOS if NGR was attained only once (HR=0.53, 95% CI 0.42-0.66, p<0.0001), 61% if it was reached twice (HR=0.39, 95% CI 0.28-0.56, p<0.0001) and 67% if it was reached 3 times (HR=0.33, 95% CI 0.19-0.58, p=0.0001) during DPP. Within treatment groups, NGR status was attained once in 23% (170/736), 25% (161/647) and 23% (137/607), twice in 18% (130/736), 11% (71/647) and 9% (52/607), and three times in 9% (67/736), 4% (27/647) and 5% (28/607) in ILS, MET and PLB participants, respectively. Cox modeling also revealed that age less than 45 (HR=1.47, 95% CI 1.12-1.94, p=0.0060) and African American race/ethnicity (HR=1.77, 95% CI 1.42-2.20, p<0.0001) were associated with increased diabetes risk. Hispanic (HR=1.17, 95% CI 0.90-1.51, p=0.2443), Asian (HR=1.22, 95% CI 0.78-1.90, p=0.3908) and Native American (HR=1.28, 95% CI 0.89-1.84, p=0.1849) race/ethnicity did not have a significantly higher risk of diabetes than Caucasians. Paradoxically, greater weight loss during DPP adversely impacted diabetes risk (HR=1.26, 95% CI 1.15-1.39, p<0.0001) in DPPOS independent of prior treatment (interaction test for NGR*ILS, p=0.8269; NGR*MET, p=0.3754), likely due to the high rate of weight regain in DPPOS with associated adverse effects on diabetes risk. Higher BMI at the beginning of DPPOS also related to diabetes risk during the period of DPPOS follow-up (HR=1.14, 95% CI 1.05-1.25, p<0.0021), whereas higher β-cell function (HR=0.80, 95% CI 0.71-0.89, p<0.0001) and insulin sensitivity (HR=0.83, 95% CI 0.74-0.94, p=0.0001) were protective. Prior randomization group in DPP did not affect the risk reduction in DPPOS among those who attained NGR (ILS vs. PLB, p=0.1722; MET vs. PLB, p=0.3304). Those who consistently remained with pre-diabetes during DPP, despite ILS, had an increased risk of diabetes during DPPOS (HR=1.31 vs. PLB, 95% CI 1.03-1.68, p=0.0304; Figure 3). Maintenance of pre-diabetes in those previously randomized to metformin did not carry the same risk (HR=0.93 vs. PLB, 95% CI 0.72-1.20, p=0.5940).
Figure 2.

Diabetes cumulative incidence rates during DPPOS in those who attained NGR at least once during DPP compared to those who consistently had pre-diabetes. *p<0.0001 between groups. Dashed lines are 95% confidence intervals.
Figure 3.

Diabetes cumulative incidence rates during DPPOS in those who attained NGR at least once during DPP compared to those who consistently had pre-diabetes, stratified by treatment group in DPP.
Regression to normal glucose regulation during DPPOS
NGR status during DPP strongly predicted achieving NGR status during DPPOS (OR=3.18, 95% CI 2.71-3.72, p<0.0001) and was unaffected by prior treatment arm (test for interaction NGR*ILS, p=0.1363; NGR*MET, p=0.6066). This was partially explained by the maintenance of greater β-cell function and insulin sensitivity throughout DPP and DPPOS (Figure 4). Those who remained pre-diabetes despite ILS during DPP were less likely to subsequently achieve NGR (vs. placebo), consistent with their higher diabetes risk (as above). Those who remained pre-diabetes despite metformin treatment during DPP had a similar likelihood of subsequently achieving NGR as those who remained as pre-diabetes with prior placebo treatment (Figure 3). Generalized mixed models revealed no effect of any self-reported race/ethnicity on regression to NGR, but did demonstrate a positive effect of female sex on regression (Table 2). In contrast, greater weight loss during DPP and higher BMI at the beginning of DPPOS were associated with less regression to NGR reflecting the higher diabetes risk related to these factors (as above).
Table 2.
Predictors of Achieving Normal Glucose Regulation During DPPOS
| 95% CI | Odds Ratio | P-value | |
|---|---|---|---|
|
| |||
| NGR v. Pre-diabetes (PLB) | 2.25-4.02 | 3.01 | <0.0001 |
| NGR: ILS v. PL | 0.63-1.02 | 0.80 | 0.0678 |
| NGR: MET v. PL | 0.69-1.14 | 0.89 | 0.3481 |
| Pre-diabetes: ILS v. PLB | 0.42-0.82 | 0.59 | 0.0014 |
| Pre-diabetes: MET v. PLB | 0.73-1.32 | 0.98 | 0.9028 |
| Age < 45 | 0.75-1.18 | 0.95 | 0.6243 |
| Age 45-59 | 0.83-1.21 | 1.00 | 0.9968 |
| Age ≥ 60 | reference | - | - |
| Female | 1.00-1.38 | 1.18 | 0.0509 |
| African American | 0.81-1.24 | 1.00 | 0.9697 |
| Hispanic | 0.84-1.30 | 1.04 | 0.7011 |
| Asian | 0.57-1.24 | 0.84 | 0.3794 |
| Native American | 0.67-1.26 | 0.92 | 0.5918 |
| Caucasian | reference | - | - |
| Body mass index | 0.71-0.87 | 0.79 | <0.0001 |
| % Weight Change in DPP | 0.72-0.84 | 0.78 | <0.0001 |
| Insulin resistance | 1.08-1.25 | 1.16 | <0.0001 |
| β-cell function | 1.18-1.39 | 1.28 | <0.0001 |
All results based on a generalized linear mix model for reaching NGR status or not in yearly DPPOS visits.
- Glycemic status and treatment group during DPP
- Demographic and concurrent weight and metabolic information during DPPOS
For categorical predictors, the ORs correspond to the comparison over the reference group; for continuous predictors, the ORs refer to per unit SD in the predictor. For BMI at the beginning of DPPOS, % weight change during DPP,1/[fasting insulin] and CIR, the standard deviation between subjects in DPPOS are 6.83 kg/m2, 7.65%, 35 pmol/l and 0.41 l/pmol respectively.
ILS = intensive lifestyle intervention
MET = metformin
PLB = placebo
NGR = normal glucose regulation
Insulin sensitivity estimated by 1/[fasting insulin]
β-cell function assessed using the Corrected Insulin Response (CIR)
Discussion
Although there is widespread consensus that diabetes prevention is critically important (23), there is less agreement with respect to the particular intervention. A number of studies have demonstrated the efficacy of lifestyle modification for diabetes prevention (8, 10, 12, 15, 24). Long-term compliance with these lifestyle changes has proven difficult, however, and the benefits wane with weight regain (17). Various pharmacologic agents have also been shown to prevent diabetes, but the cost effectiveness and risk-benefit ratio for most are less clear (6, 7, 9-11, 13). Results from the current analysis would contend that the strategy is unimportant as long as the intervention is early (when someone has pre-diabetes) and can restore normal glucose regulation, even if transiently. Further, maintenance of pre-diabetes despite the potent glucose-lowering effects of intensive lifestyle modification represents a high-risk state and may warrant additional preventive strategies.
Although two-thirds of people with diabetes are overweight or obese (25), few of those who are obese will ever develop diabetes (26), whereas up to 70% of those with pre-diabetes may acquire the disease over their lifetime (10, 12, 27). Diagnosis of diabetes or pre-diabetes is made by defined glycemic criteria, but can be less straightforward when blood glucose concentrations fluctuate above and below the diagnostic cut points. Spontaneous progression, regression and/or interconversion of dysglycemic states (28) may contribute to the clinical conundrum. It is possible that our group with NGR may simply represent a group with either more motivation for treatment (as evidenced by their long-term participation in this clinical trial) or a more modifiable glucose status, rather than true reversal of the diabetogenic process. However, it should be pointed out that a single determination of IGT has been shown to predict increased diabetes risk 3-fold over 5.8 years, even after the return to NGR in a high-risk population (29). Ours is the first study to show that the converse is true for the attainment of NGR in people with pre-diabetes. Specifically, determination of NGR status at one or more annual visits during DPP was associated with a 56% lower risk of diabetes during subsequent follow-up in DPPOS. The magnitude of this risk reduction approximates that seen with ILS – the most potent intervention in DPP (10) - but with a greater enduring effect on long-term diabetes prevention (17). Further, we have shown that the risk reduction benefit was seen regardless of prior treatment group (ie. no treatment interaction observed), suggesting that achieving NGR is more important than the method to achieve it, with respect to deterring the risk of diabetes. Lastly, the demographic information of our multi-ethnic cohort closely resembles the U.S. population with pre-diabetes supporting the generalizability of our findings (1). Taken together, these facts serve as essential clinical information for people with pre-diabetes and their providers in the prevention of diabetes.
The DPP demonstrated a clear reduction in diabetes incidence among participants randomized to ILS or MET during the intervention period (10). One may speculate that some of this benefit came from the potency of the intervention to restore NGR. For example, ILS was approximately twice as effective as metformin at preventing diabetes (10) and was the only intervention associated with regression to NGR (16). Implied are the numerous pleiotropic effects of ILS (eg. reduction is lipids, blood pressure and biomarkers) seen with ILS that go beyond the simple glucose lowering of metformin (30, 31). Interestingly, the current analysis revealed that people with persistent pre-diabetes who had formerly been in the ILS group had a higher, not lower, risk of diabetes in DPPOS. This seeming paradox can be reconciled by considering two potential explanations. First, it is possible that the metformin group benefited from continued treatment in DPPOS, whereas ILS adherence diminished – as evidenced by their weight regain and lower attendance at the lifestyle sessions (i.e. HELP and BOOST) during the bridge period. However, since weight regain was relatively small (1%) and metformin adherence also diminished during the bridge period, these potential group differences in treatment efficacy were largely mitigated. A more likely explanation is that these observations reflect a survivor effect in the ILS group, with those who still had pre-diabetes being particularly susceptible to develop diabetes. Whether the susceptibility represents genetic predisposition, ILS non-adherence, or other environmental factor is not known. Nonetheless, a combination of preventive strategies may be appropriate for those whose dysglycemia cannot be reversed with the potent glucose-lowering effect of ILS. It should be noted that combination therapy (ILS + low dose MET) was not more effective than the individual therapies in preventing diabetes in a group of high-risk Asian Indians (15). The possibility of greater potency of combination therapy in a multi-cultural cohort, such as DPPOS, cannot be excluded or confirmed without further study, but deserves consideration. Some analyses may have been underpowered for the endpoint (ie. race/ethnicity regressing or progressing). Lastly, erroneous misclassifcation of people as NGR vs. pre-diabetes cannot be excluded. Thus, additional studies are needed to confirm the current findings.
Whether preventive strategies should target insulin resistance or declining β-cell function is a topic of much debate. Insulin sensitivity and secretion are integrally related and the deterioration of each is felt to be requisite in the development of type 2 diabetes (32). Indeed, our results would also suggest that both are related to restoration of NGR. On closer examination, however, insulin sensitivity in NGR and pre-diabetes groups became more similar in DPPOS than did β-cell function. Although the continuous insulin response rose in both groups to compensate for the decline in insulin sensitivity at the culmination of interventions invoked during DPP, the insulin secretory response remained markedly higher throughout DPPOS in those who had attained NGR during DPP. These data agree with others demonstrating that it is ultimately β-cell failure that dictates onset of diabetes (6, 32, 33). It should be pointed out, however, that interventions that lower insulin resistance (ie. exercise) frequently improve beta cell function. For example, greater progression to diabetes in the younger participants of DPPOS may reflect their lower success with ILS during DPP - an intervention shown to improve β-cell function (34). In contrast, greater regression to NGR in women likely reflects their ability to maintain β-cell function. A previous analysis from the DPP noted a higher index of insulin secretion, but not insulin sensitivity, in women vs. men entering the trial (35). In sum, our data would indicate that preservation of β-cell function is more closely related than insulin sensitivity to the long-term prevention of diabetes and restoration of NGR. Until therapeutic approaches can be confirmed as specifically preserving beta cell function, efforts should focus on ILS where its positive effects on the insulin secretory response and cost-effectiveness have been demonstrated in clinical trials (36, 37).
In conclusion, results from this analysis of the DPPOS demonstrate a 56% reduction in diabetes incidence among high risk individuals who reverted to NGR, no matter how this is achieved or however transiently. Surprisingly, diabetes risk was highest in those who remained with pre-diabetes despite ILS. The latter finding highlights a particular susceptibility in this group that may benefit from additional interventions. Together, these data serve as vital clinical information to support early and aggressive measures for the long-term prevention of diabetes in people at risk.
Supplementary Material
Putting Research Into Context
Systematic review: We searched from PubMed June 1976 – February 2012 for full reports of randomized clinical trials in people with pre-diabetes using the term “regression to normal glucose regulation” and also “regression to normoglycemia”. Of the 154 references returned, four were clinical trials that examined the efficacy of an intervention to return people with pre-diabetes to normal glucose regulation. Two of the four trials were previous post-hoc analyses from the DPP. Of the two non-DPP clinical trials, one showed failure (of angiotensin-receptor blockade) and the other success (of lifestyle and/or glucose-lowering medications) restoring normoglycemia in people with pre-diabetes, but neither these nor the DPP analyses quantified the risk reduction for future diabetes in those with NGR. This analysis highlights the significant long-term reduction in diabetes risk when returning someone with pre-diabetes to normoglycemia supporting a shift in the standard of care to earlier and more aggressive glucose lowering in those at highest risk.
Acknowledgments
The Research Group gratefully acknowledges the commitment and dedication of the participants of the DPP and DPPOS. During the DPPOS, the National Institute of Diabetes and Digestive and Kidney Diseases (NIDDK) of the National Institutes of Health provided funding to the clinical centers and the Coordinating Center for the design and conduct of the study, and collection, management, analysis, and interpretation of the data. The Southwestern American Indian Centers were supported directly by the NIDDK, including its Intramural Research Program, and the Indian Health Service. The General Clinical Research Center Program, National Center for Research Resources, and the Department of Veterans Affairs supported data collection at many of the clinical centers. Funding was also provided by the National Institute of Child Health and Human Development, the National Institute on Aging, the National Eye Institute, the National Heart Lung and Blood Institute, the Office of Research on Women's Health, the National Center for Minority Health and Human Disease, the Centers for Disease Control and Prevention, and the American Diabetes Association. Bristol-Myers Squibb and Parke-Davis provided additional funding and material support during the DPP, Lipha (Merck-Sante) provided medication and LifeScan Inc. donated materials during the DPP and DPPOS. The opinions expressed are those of the investigators and do not necessarily reflect the views of the funding agencies. A complete list of Centers, investigators, and staff can be found in the Appendix.
Funding: NIH 5U01-DK048375-12
Contributors
| Study design | Analysis plan | Analysis | Interpretation | Writing/editing | |
|---|---|---|---|---|---|
| L Perreault | X | X | X | X | |
| Q Pan | X | X | X | X | |
| K Mather | X | X | X | ||
| K Watson | X | X | X | ||
| R Hamman | X | X | X | X | |
| S Kahn | X | X | X |
Footnotes
The authors have no relevant conflicts of interest to disclose.
This manuscript is dedicated to Christopher D. Saudek, MD, our friend and collaborator, who passed away October 6, 2010.
Publisher's Disclaimer: This is a PDF file of an unedited manuscript that has been accepted for publication. As a service to our customers we are providing this early version of the manuscript. The manuscript will undergo copyediting, typesetting, and review of the resulting proof before it is published in its final citable form. Please note that during the production process errors may be discovered which could affect the content, and all legal disclaimers that apply to the journal pertain.
References
- 1.CDC. Diabetes Fact Sheet online 2011. Jan 26, 2011. [Google Scholar]
- 2.The prevalence of retinopathy in impaired glucose tolerance and recent-onset diabetes in the Diabetes Prevention Program. Diabet Med. 2007 Feb;24(2):137–44. doi: 10.1111/j.1464-5491.2007.02043.x. [DOI] [PMC free article] [PubMed] [Google Scholar]
- 3.Cheng YJ, Gregg EW, Geiss LS, Imperatore G, Williams DE, Zhang X, et al. Association of A1C and fasting plasma glucose levels with diabetic retinopathy prevalence in the U.S. population: Implications for diabetes diagnostic thresholds. Diabetes Care. 2009 Nov;32(11):2027–32. doi: 10.2337/dc09-0440. [DOI] [PMC free article] [PubMed] [Google Scholar]
- 4.Ford ES, Zhao G, Li C. Pre-diabetes and the risk for cardiovascular disease: a systematic review of the evidence. J Am Coll Cardiol. 2010 Mar 30;55(13):1310–7. doi: 10.1016/j.jacc.2009.10.060. [DOI] [PubMed] [Google Scholar]
- 5.Ziegler D, Rathmann W, Dickhaus T, Meisinger C, Mielck A. Prevalence of polyneuropathy in pre-diabetes and diabetes is associated with abdominal obesity and macroangiopathy: the MONICA/KORA Augsburg Surveys S2 and S3. Diabetes Care. 2008 Mar;31(3):464–9. doi: 10.2337/dc07-1796. [DOI] [PubMed] [Google Scholar]
- 6.Buchanan TA, Xiang AH, Peters RK, Kjos SL, Marroquin A, Goico J, et al. Preservation of pancreatic beta-cell function and prevention of type 2 diabetes by pharmacological treatment of insulin resistance in high-risk Hispanic women. Diabetes. 2002 Sep;51(9):2796–803. doi: 10.2337/diabetes.51.9.2796. [DOI] [PubMed] [Google Scholar]
- 7.Chiasson JL, Josse RG, Gomis R, Hanefeld M, Karasik A, Laakso M. Acarbose for prevention of type 2 diabetes mellitus: the STOP-NIDDM randomised trial. Lancet. 2002 Jun 15;359(9323):2072–7. doi: 10.1016/S0140-6736(02)08905-5. [DOI] [PubMed] [Google Scholar]
- 8.Eriksson KF, Lindgarde F. Prevention of type 2 (non-insulin-dependent) diabetes mellitus by diet and physical exercise. The 6-year Malmo feasibility study. Diabetologia. 1991 Dec;34(12):891–8. doi: 10.1007/BF00400196. [DOI] [PubMed] [Google Scholar]
- 9.Gerstein HC, Yusuf S, Bosch J, Pogue J, Sheridan P, Dinccag N, et al. Effect of rosiglitazone on the frequency of diabetes in patients with impaired glucose tolerance or impaired fasting glucose: a randomised controlled trial. Lancet. 2006 Sep 23;368(9541):1096–105. doi: 10.1016/S0140-6736(06)69420-8. [DOI] [PubMed] [Google Scholar]
- 10.Knowler WC, Barrett-Connor E, Fowler SE, Hamman RF, Lachin JM, Walker EA, et al. Reduction in the incidence of type 2 diabetes with lifestyle intervention or metformin. N Engl J Med. 2002 Feb 7;346(6):393–403. doi: 10.1056/NEJMoa012512. [DOI] [PMC free article] [PubMed] [Google Scholar]
- 11.Torgerson JS, Hauptman J, Boldrin MN, Sjostrom L. XENical in the prevention of diabetes in obese subjects (XENDOS) study: a randomized study of orlistat as an adjunct to lifestyle changes for the prevention of type 2 diabetes in obese patients. Diabetes Care. 2004 Jan;27(1):155–61. doi: 10.2337/diacare.27.1.155. [DOI] [PubMed] [Google Scholar]
- 12.Tuomilehto J, Lindstrom J, Eriksson JG, Valle TT, Hamalainen H, Ilanne-Parikka P, et al. Prevention of type 2 diabetes mellitus by changes in lifestyle among subjects with impaired glucose tolerance. N Engl J Med. 2001 May 3;344(18):1343–50. doi: 10.1056/NEJM200105033441801. [DOI] [PubMed] [Google Scholar]
- 13.DeFronzo RA, Tripathy D, Schwenke DC, Banerji M, Bray GA, Buchanan TA, et al. Pioglitazone for diabetes prevention in impaired glucose tolerance. N Engl J Med. 2011 Mar 24;364(12):1104–15. doi: 10.1056/NEJMoa1010949. [DOI] [PubMed] [Google Scholar]
- 14.Pan XR, Li GW, Hu YH, Wang JX, Yang WY, An ZX, et al. Effects of diet and exercise in preventing NIDDM in people with impaired glucose tolerance. The Da Qing IGT and Diabetes Study. Diabetes Care. 1997 Apr;20(4):537–44. doi: 10.2337/diacare.20.4.537. [DOI] [PubMed] [Google Scholar]
- 15.Ramachandran A, Snehalatha C, Mary S, Mukesh B, Bhaskar AD, Vijay V. The Indian Diabetes Prevention Programme shows that lifestyle modification and metformin prevent type 2 diabetes in Asian Indian subjects with impaired glucose tolerance (IDPP-1) Diabetologia. 2006 Feb;49(2):289–97. doi: 10.1007/s00125-005-0097-z. [DOI] [PubMed] [Google Scholar]
- 16.Perreault L, Kahn SE, Christophi CA, Knowler WC, Hamman RF. Regression from pre-diabetes to normal glucose regulation in the Diabetes Prevention Program. Diabetes Care. 2009 Sep;32(9):1583–8. doi: 10.2337/dc09-0523. [DOI] [PMC free article] [PubMed] [Google Scholar]
- 17.Knowler WC, Fowler SE, Hamman RF, Christophi CA, Hoffman HJ, Brenneman AT, et al. 10-year follow-up of diabetes incidence and weight loss in the Diabetes Prevention Program Outcomes Study. Lancet. 2009 Nov 14;374(9702):1677–86. doi: 10.1016/S0140-6736(09)61457-4. [DOI] [PMC free article] [PubMed] [Google Scholar]
- 18.Venditti EM, Bray GA, Carrion-Petersen ML, Delahanty LM, Edelstein SL, Hamman RF, et al. First versus repeat treatment with a lifestyle intervention program: attendance and weight loss outcomes. Int J Obes (Lond) 2008 Oct;32(10):1537–44. doi: 10.1038/ijo.2008.134. [DOI] [PMC free article] [PubMed] [Google Scholar]
- 19.Tataranni PA, Ortega E. A burning question: does an adipokine-induced activation of the immune system mediate the effect of overnutrition on type 2 diabetes? Diabetes. 2005 Apr;54(4):917–27. doi: 10.2337/diabetes.54.4.917. [DOI] [PubMed] [Google Scholar]
- 20.The Diabetes Prevention Program. Design and methods for a clinical trial in the prevention of type 2 diabetes. Diabetes Care. 1999 Apr;22(4):623–34. doi: 10.2337/diacare.22.4.623. [DOI] [PMC free article] [PubMed] [Google Scholar]
- 21.Phillips DI, Clark PM, Hales CN, Osmond C. Understanding oral glucose tolerance: comparison of glucose or insulin measurements during the oral glucose tolerance test with specific measurements of insulin resistance and insulin secretion. Diabet Med. 1994 Apr;11(3):286–92. doi: 10.1111/j.1464-5491.1994.tb00273.x. [DOI] [PubMed] [Google Scholar]
- 22.The Diabetes Prevention Program: baseline characteristics of the randomized cohort. The Diabetes Prevention Program Research Group. Diabetes Care. 2000 Nov;23(11):1619–29. doi: 10.2337/diacare.23.11.1619. [DOI] [PMC free article] [PubMed] [Google Scholar]
- 23.Nathan DM, Davidson MB, DeFronzo RA, Heine RJ, Henry RR, Pratley R, et al. Impaired fasting glucose and impaired glucose tolerance: implications for care. Diabetes Care. 2007 Mar;30(3):753–9. doi: 10.2337/dc07-9920. [DOI] [PubMed] [Google Scholar]
- 24.Saito T, Watanabe M, Nishida J, Izumi T, Omura M, Takagi T, et al. Lifestyle modification and prevention of type 2 diabetes in overweight Japanese with impaired fasting glucose levels: a randomized controlled trial. Arch Intern Med. 2011 Aug 8;171(15):1352–60. doi: 10.1001/archinternmed.2011.275. [DOI] [PubMed] [Google Scholar]
- 25.Overweight, obesity, and health risk. National Task Force on the Prevention and Treatment of Obesity. Arch Intern Med. 2000 Apr 10;160(7):898–904. doi: 10.1001/archinte.160.7.898. [DOI] [PubMed] [Google Scholar]
- 26.Harris MI, Flegal KM, Cowie CC, Eberhardt MS, Goldstein DE, Little RR, et al. Prevalence of diabetes, impaired fasting glucose, and impaired glucose tolerance in U.S. adults. The Third National Health and Nutrition Examination Survey, 1988-1994. Diabetes Care. 1998 Apr;21(4):518–24. doi: 10.2337/diacare.21.4.518. [DOI] [PubMed] [Google Scholar]
- 27.de Vegt F, Dekker JM, Jager A, Hienkens E, Kostense PJ, Stehouwer CD, et al. Relation of impaired fasting and postload glucose with incident type 2 diabetes in a Dutch population: The Hoorn Study. Jama. 2001 Apr 25;285(16):2109–13. doi: 10.1001/jama.285.16.2109. [DOI] [PubMed] [Google Scholar]
- 28.Meigs JB, Muller DC, Nathan DM, Blake DR, Andres R. The natural history of progression from normal glucose tolerance to type 2 diabetes in the Baltimore Longitudinal Study of Aging. Diabetes. 2003 Jun;52(6):1475–84. doi: 10.2337/diabetes.52.6.1475. [DOI] [PubMed] [Google Scholar]
- 29.Saad MF, Knowler WC, Pettitt DJ, Nelson RG, Bennett PH. Transient impaired glucose tolerance in Pima Indians: is it important? BMJ. 1988 Dec 3;297(6661):1438–41. doi: 10.1136/bmj.297.6661.1438. [DOI] [PMC free article] [PubMed] [Google Scholar]
- 30.Mather KJ, Funahashi T, Matsuzawa Y, Edelstein S, Bray GA, Kahn SE, et al. Adiponectin, change in adiponectin, and progression to diabetes in the Diabetes Prevention Program. Diabetes. 2008 Apr;57(4):980–6. doi: 10.2337/db07-1419. [DOI] [PMC free article] [PubMed] [Google Scholar]
- 31.Ratner R, Goldberg R, Haffner S, Marcovina S, Orchard T, Fowler S, et al. Impact of intensive lifestyle and metformin therapy on cardiovascular disease risk factors in the diabetes prevention program. Diabetes Care. 2005 Apr;28(4):888–94. doi: 10.2337/diacare.28.4.888. [DOI] [PMC free article] [PubMed] [Google Scholar]
- 32.Weyer C, Bogardus C, Mott DM, Pratley RE. The natural history of insulin secretory dysfunction and insulin resistance in the pathogenesis of type 2 diabetes mellitus. J Clin Invest. 1999 Sep;104(6):787–94. doi: 10.1172/JCI7231. [DOI] [PMC free article] [PubMed] [Google Scholar]
- 33.Utzschneider KM, Prigeon RL, Faulenbach MV, Tong J, Carr DB, Boyko EJ, et al. An Oral Disposition Index Predicts the Development of Future Diabetes Above and Beyond Fasting and 2-Hour Glucose Levels. Diabetes Care. 2009 Oct 28; doi: 10.2337/dc08-1478. [DOI] [PMC free article] [PubMed] [Google Scholar]
- 34.Crandall J, Schade D, Ma Y, Fujimoto WY, Barrett-Connor E, Fowler S, et al. The influence of age on the effects of lifestyle modification and metformin in prevention of diabetes. J Gerontol A Biol Sci Med Sci. 2006 Oct;61(10):1075–81. doi: 10.1093/gerona/61.10.1075. [DOI] [PMC free article] [PubMed] [Google Scholar]
- 35.Perreault L, Ma Y, Dagogo-Jack S, Horton E, Marrero D, Crandall J, et al. Sex differences in diabetes risk and the effect of intensive lifestyle modification in the Diabetes Prevention Program. Diabetes Care. 2008 Jul;31(7):1416–21. doi: 10.2337/dc07-2390. [DOI] [PMC free article] [PubMed] [Google Scholar]
- 36.Herman WH, Hoerger TJ, Brandle M, Hicks K, Sorensen S, Zhang P, et al. The cost-effectiveness of lifestyle modification or metformin in preventing type 2 diabetes in adults with impaired glucose tolerance. Ann Intern Med. 2005 Mar 1;142(5):323–32. doi: 10.7326/0003-4819-142-5-200503010-00007. [DOI] [PMC free article] [PubMed] [Google Scholar]
- 37.Kitabchi AE, Temprosa M, Knowler WC, Kahn SE, Fowler SE, Haffner SM, et al. Role of insulin secretion and sensitivity in the evolution of type 2 diabetes in the diabetes prevention program: effects of lifestyle intervention and metformin. Diabetes. 2005 Aug;54(8):2404–14. doi: 10.2337/diabetes.54.8.2404. [DOI] [PMC free article] [PubMed] [Google Scholar]
Associated Data
This section collects any data citations, data availability statements, or supplementary materials included in this article.