Abstract
The laboratory rat, Rattus norvegicus, is an important model of human health and disease, and experimental findings in the rat have relevance to human physiology and disease. The Rat Genome Database (RGD, http://rgd.mcw.edu) is a model organism database that provides access to a wide variety of curated rat data including disease associations, phenotypes, pathways, molecular functions, biological processes and cellular components for genes, quantitative trait loci, and strains. We present an overview of the database followed by specific examples that can be used to gain experience in employing RGD to explore the wealth of functional data available for the rat.
Keywords: rat, database, quantitative trait locus, ontology, genomics, gene
The Rat Genome Database (RGD) provides the scientific community with a public source for a variety of information related to the laboratory rat (http://rgd.mcw.edu; Dwinell et al., 2009). RGD incorporates manually curated data and information through electronic resources into a comprehensive and dynamic database containing information on genes, strains, quantitative trait loci (QTLs), simple sequence length polymorphisms (SSLPs), sequences, maps, and orthologs, all with supporting references. RGD also provides a collection of visualization and analysis applications to assist researchers in effectively utilizing the information available in the database. This integration of manually curated data with electronically imported data obtained from major public data repositories (e.g., NCBI, UniProt), combined with diverse analysis tools, makes RGD a uniquely valuable resource to the scientific community.
This unit focuses on using RGD to access the phenotypic and functional annotations that are available in the database. Basic Protocol 1 provides an overview of the RGD home page and illustrates the various features and entry points into the RGD web site. The subsequent protocols explain the various routes to information in the database, how to use the more advanced querying tools, and how to interpret the individual data reports (Basic Protocols 2 and 3). The last two protocols describe how to use two of the most popular visualization tools, GBrowse (Basic Protocol 4) and PhenoMiner (Basic Protocols 5), to explore annotations in the context of the rat genome and in comparative studies between rat strains.
BASIC PROTOCOL 1
NAVIGATING THE RGD HOME PAGE
The RGD Home Page provides entry points into the many features of the RGD web site. It has a number of distinct sections that group together related content, and these are discussed in more detail below.
Necessary Resources
Hardware
Computer with functioning Internet connection
Software
Web browser (Internet Explorer 7+, Firefox 3+, Chrome 13+ or Safari 5+)
Locate the RGD home page at http://rgd.mcw.edu/.
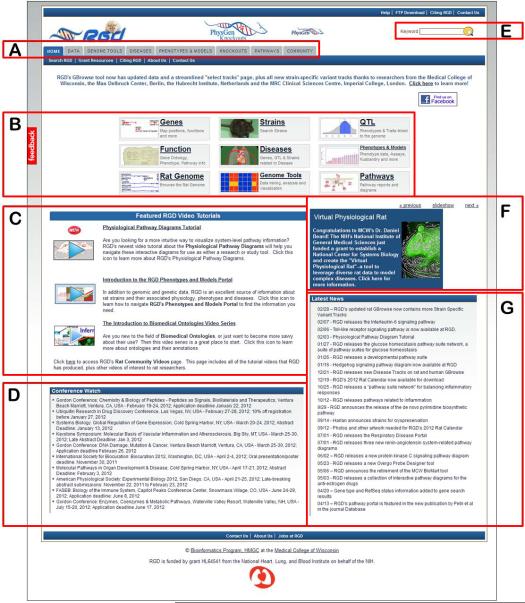
- Examine the basic resource categories in RGD (Fig. 1.14.1).Resource categories are arranged on tabs at the top of the page and are divided into the seven major areas of the RGD web site: Data, Genome Tools, Diseases, Phenotypes & Models, Knockouts, Pathways, and Community (Fig. 1.14.1A). Each tab provides quick access to the corresponding section of the RGD web site. Expanded data and tool links are also available in the center of the homepage (Fig. 1.14.1B).
- Note the location of the Keyword Search (Fig. 1.14.1E).The Keyword search text box located in the top right corner of most RGD pages functions as a quick method to locate an item or items of interest (Fig. 1.14.1E).
- Explore the remainder of the home page.Below and left of center is a section containing links to RGD video tutorials (Fig. 1.14.1C), which provide general introductions to various sections of the RGD web site. The bottom left portion of the home page has a list of upcoming conferences which may be of interest to RGD users (Fig. 1.14. 1D). Each line in the list is a link to the home page of that particular conference. Below and right of center is the RGD home page revolving banner (Fig. 1.14. 1F), which announces new information and features at RGD. Each banner item is linked to information about, or an example of, what is described in the item. Below the banner is a chronological list of news items that appear or have previously appeared on the revolving banner (Fig. 1.14. 1G). All of the listed items are hyperlinked to the corresponding web page.
Figure 1.14.1.
The RGD home page. Tabs and links to all of the data and analysis tools at RGD are found here. The bottom half of the page covers RGD tutorial videos, new features, and a conference list for users.
BASIC PROTOCOL 2
USING THE RGD SEARCH FUNCTIONS
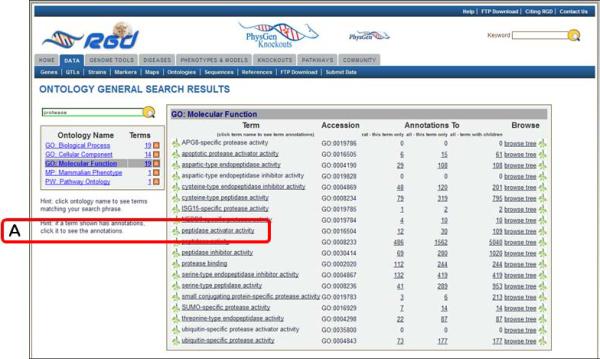
The RGD web site has a number of ways to search for data, depending on the scope of the specific information desired. The keyword search text box, available in the upper right-hand corner of most RGD web pages (Fig. 1.14.1E), provides a fast way to get at specific data, such as gene or QTL information, when a name, keyword, or accession number is known. It searches across most object types (genes, QTLs, strains, homologs, SSLPs, ESTs, and references) and many data types. It also searches the many controlled vocabularies used at RGD, including gene ontology (biological process, molecular function, and cellular component), mammalian phenotype ontology, neuro behavior ontology, pathway ontology, and disease vocabulary. Also, one can search specific object types and ontologies directly (Fig. 1.14.5).
Figure 1.14.5.
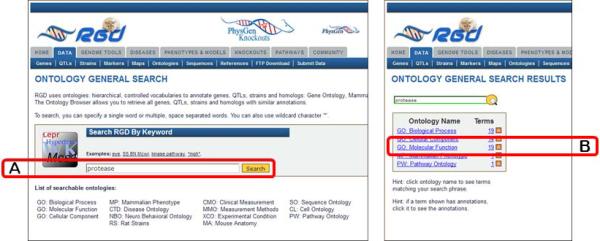
Ontology general search page (left panel) and ontology general search results page (right panel). The page in the left panel is used to search all controlled vocabularies used at RGD. The right panel shows an intermediate results page grouping results according to ontology/vocabulary.
Necessary Resources
Hardware
Computer with Internet connection
Software
Web browser (Internet Explorer 7+, Firefox 3+, Chrome 13+, or Safari 5+)
Using the general keyword search
- 1. Go to the RGD Web site as described in Basic Protocol 1. Enter a key word or phrase in the keyword search box in the upper right-hand corner of any RGD web page (Fig. 1.14.1E). For example, enter protease, then click the search icon or press the Enter key.Any text can be entered, and the search looks for an exact or partial match of whatever word or phrase is entered. Wildcards can be used at either end of a word, and punctuation is ignored. Certain short, common words, such as “a” or “the,” cannot be searched. See Figure 1.14.2 for results of the protease search. An intermediate results page is shown which groups results by category. In this instance genes, references, and ontology terms represent the result categories. Clicking any of the links under “Genes” or “References” (Fig. 1.14.2A) will display a table of results as in Fig. 1.14.4. Clicking an ontology term (Fig. 1.14.2B) will open the ontology browser (Fig. 1.14.9) and clicking on an “A” icon next to an ontology term (Fig. 1.14.2C) will open an ontology report annotation page (Fig. 1.14.10).
Figure 1.14.2.
Intermediate search results page. This page shows results grouped by category with links to the specific groups of data.
Figure 1.14.4.
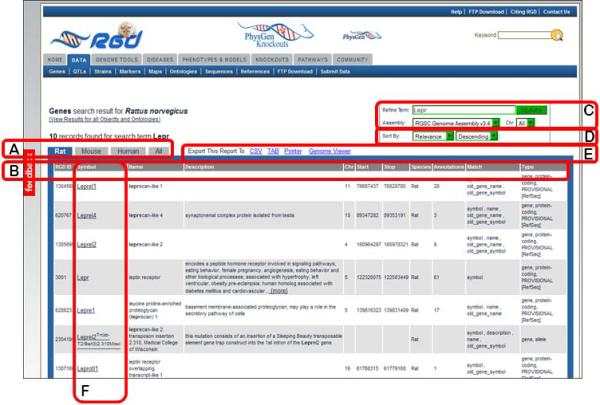
Genes results page. This page displays data across three species with multiple options for viewing and arranging the display.
Figure 1.14.9.
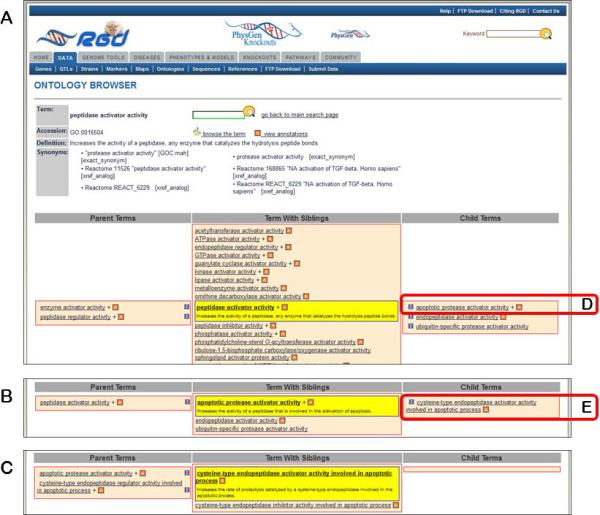
The RGD ontology browser. Any of the ontologies/vocabularies used at RGD can be displayed in this horizontally oriented term browser.
Figure 1.14.10.
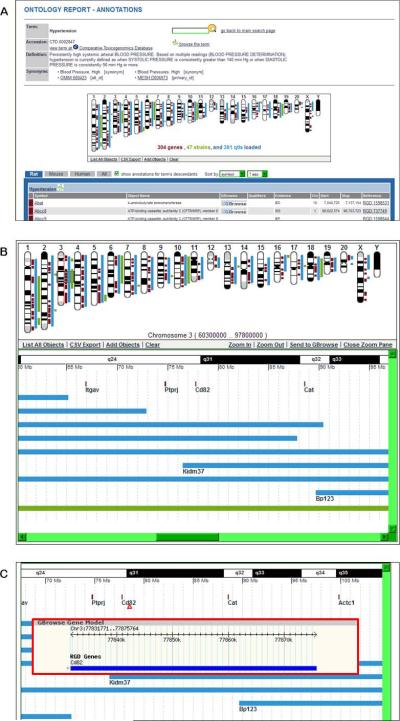
The GViewer. All genes, QTLs, and congenic strains annotated to the selected term and its descendants are shown at the appropriate chromosomal location.
Performing an object-specific search
-
2.Click on the Data tab under the RGD logo of any RGD web page (seen with white font on a blue background in Fig. 1.14.2).The “Data” page has a list of all available data categories with associated descriptions.
-
3.
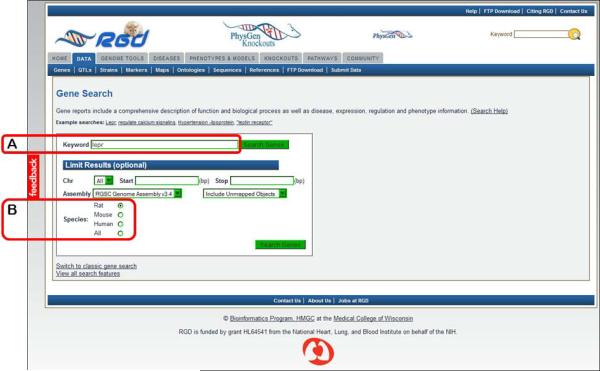
Select a data type by clicking the data name or adjacent icon. For example click “GENES”. A new page is returned for gene-specific searches. Enter the gene symbol “lepr” in the “Keyword” search box on the left side of the page (Figure 1.14.3A).
-
4.In the optional “Limit Results” section under the keyword textbox, leave the default “Rat” for choice of species (Fig. 1.14.3B), and click either “Search Genes” button.By selecting “Rat” species for the search, the results page returns with the rat tab selected, where 10 genes are listed (Fig. 1.14.4).
-
5.If it is desirable to view gene lists in other species, click the “Mouse”, “Human”, or “All” tab at the top of the gene list (Fig. 1.14.4A).The separate tabs show 8 mouse genes, 12 human genes, and 30 total genes on the “All” tab. Each line in the results table lists RGD ID, symbol, name, and other data to describe the gene record (Fig. 1.14.4B). To refine the search an extra term(s)can be entered into the “Refine Term” search box or a different genome assembly chosen in the “Assembly” drop-down menu or a specific chromosome chosen in the “Chr” drop-down menu above the right side of the results list (Fig 1.14.4C).
Figure 1.14.3.
Gene Search page. This page provides a gene-specific version of the RGD data search.
Navigating the search results
-
6.
The results can be sorted alphabetically or numerically on any column. To sort by chromosome, choose “Chr” in the first “Sort By” drop-down menu and “Descending” or “Ascending” in the second drop-down menu on the upper right side of the results page (Fig 1.14.4D).
-
7.
To download the results to an Excel or other type of file, click the “CSV” or “TAB” link at the top of the results list (Fig. 1.14.4E).
-
8.
To print the results or to view the results in RGD's GViewer, tool click the “Printer” or “Genome Viewer” link, respectively, at the top of the results list (Fig. 1.14.4E).
-
9.
To display a certain gene report page, select that gene record by clicking the symbol, which is hyperlinked to the gene report page (Fig. 1.14.4F).
Using the ontology search
-
10.
Return to the data page (Data tab) as described in step 2.
-
11.Click on the “Ontologies” link in the data list or the menu bar. Then enter protease in the search box in the middle of the page and click the “Search” button to the right of the search box (Fig. 1.14.5A).This will lead to a results page with a box showing “Ontology Name” which lists all ontologies with terms which at least partially match the query term and “Terms” which lists the number of matching terms in each ontology (Fig. 1.14.5 right panel).
-
12.On the results page click on “GO:Molecular Function” in the Ontology Name list (Fig. 1.14.5B).This will cause a term table to be generated to the right of the ontology list (Fig. 1.14.6). All Molecular Function terms that contain the word “protease” or terms that have synonyms that contain the word ”protease” will be listed. An underlined term means that annotations exist in RGD for that term. Additional columns in the table include accession ID number, a count of annotations to the term and its children, and links (“browse tree” and “branch” icons) to the ontology browser.
-
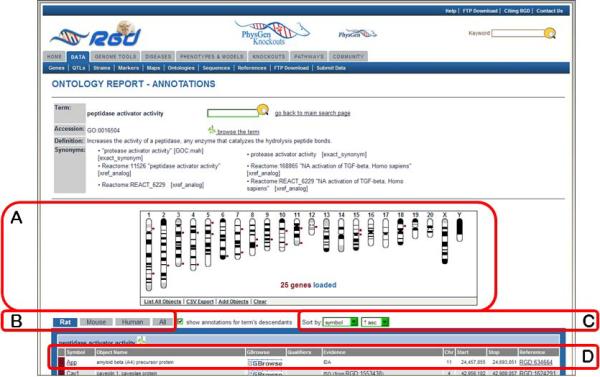
13.Click on “peptidase activator activity” in the term table (Fig. 1.14.6A).An ontology report page (Fig. 1.14.7) is returned with a definition of the term, synonyms, and a list of genes annotated to that term and its children. Above the list of genes is the GViewer (Fig. 1.14.7A) which illustrates the genomic location of each gene. The species tabs underneath the GViewer allow a separate view of annotated rat, mouse, or human genes (Fig. 1.14.7B). To the right of the species tabs is a check box to display genes annotated to the ontology term or both the term and its children terms. There are also two drop-down menus for sorting the annotation gene list by any of its columns (Fig. 1.14.7C). The Symbols, GBrowse links, Evidence source, and Reference IDs in the gene list are all hyperlinked to relevant information at RGD and at external databases (Fig. 1.14.7D).
-
14.Scroll down to the bottom of the page to see text (Fig. 1.14.8A) and graph representations (Fig. 1.14.8C) of the branch of the ontology where the term “peptidase activator activity” resides. Click on the branch icon (Fig. 1.14.8B) next to the annotation count for “peptidase activator activity” to access the main RGD ontology term browser (Fig. 1.14.9).The term “peptidase activator activity” is highlighted in yellow in the center column with all of its siblings, while its child terms are in a column to the right and its parent terms are in a column to the left (Fig. 1.14.9A).
-
15.Click on “apoptotic protease activator activity” (Fig. 1.14.9D), and then click on “cysteine-type endopeptidase activator activity involved in apoptotic process” (Fig. 1.14.9E).When each term is clicked, it moves to the center column with its siblings and the adjacent columns refresh to show parent terms to the left and children terms to the right (Fig. 1.14.9B,C). This allows easy navigation of the ontology in both directions, with three levels of terms being visible at all times. An “A” icon to the right of a term means that gene annotations for that term exist in RGD.
-
16.Click on the red square “A” icon adjacent to “apoptotic protease activator activity” (Fig. 1.14.11C), now in the “Parent Terms” column.The returned page is the ontology report page for “apoptotic protease activator activity”, which has annotations that represent a subset of those on the page for the parent term “peptidase activator activity” (Steps 13 and 14).
Figure 1.14.6.
Ontology general search results details page. This page highlights the list of search result terms for a selected ontology.
Figure 1.14.7.
Ontology report page. This page defines the selected ontology term, lists all RGD objects annotated with that term and its children, and displays genomic location of annotated genes, QTLs, and congenic strains.
Figure 1.14.8.
Bottom of ontology report page. Underneath the annotated object list are text and graph representations of the ontology branch(s) containing the selected term.
Figure 1.14.11.
The QTL specific search. This page uses a keyword search with optional restrictions to narrow the search.
Visualizing search results using GViewer
The GViewer tool provides a graphic representation of the genomic locations of all genes, QTLs, and congenic strains that are annotated to an ontology term or terms. The GViewer tool is visible on all the ontology report pages (Fig. 1.14.7A, 10A).
-
17.On either the ontology report page (Fig. 1.14.7A) or the ontology browser page (Fig. 1.14.9) enter hypertension in the search box in the upper center of the page. Click the magnifying glass icon to the right of the search box or press “Enter” on your keyboard. This will return an ontology term results list on which you should click “CTD: Disease Ontology”, followed by clicking “hypertension” in the returned term results list.The GViewer image shows all the chromosomes that have a gene (brown), QTL (blue), or congenic strain (green) annotated to the term hypertension or its children terms (Fig. 1.14.10B).
-
18.Click on the center of chromosome 3 to view a more detailed image (Fig. 1.14.10B) in a zoom pane. Mouse over the gene marker or symbol for Cd82 in the zoom pane (Fig. 1.14.10C, arrowhead) to see a GBrowse gene model of that gene (Fig. 1.14.10C, red outlined pop-up box). Scroll the zoom pane by dragging the highlighted (grey) slider (Fig. 1.14.10B) on the chromosome or by using the zoom pane's horizontal scroll bar to see all the targeted genes and QTLs on chromosome 3 in more detail.The zoom pane shows all objects by symbol (on the left side of QTL and strain bars) and color code (brown - gene, blue - QTL, and green - strain). For further analysis the mapped data can be downloaded into a spreadsheet by clicking the “CVS export” link at the bottom of the GViewer image (Fig. 1.14.10B)
-
19.
Click on the gene symbol “Cd82” to go to the gene report, which opens in a new window.
-
20.
Go back to the GViewer and click on the “Send to GBrowse” to view the region of the zoom pane in the genome browser (see Basic Protocol 4).
BASIC PROTOCOL 3
SEARCHING FOR QUANTITATIVE TRAIT LOCI
As mentioned earlier, RGD contains data related to various types of biological “objects” such as genes, strains, and Quantitative Trait Loci (QTLs). The complete list of data objects is accessible via the “Data” tab at the top of most pages on the RGD web site. Basic Protocol 2 describes how to search the database for any object using keywords and ontology terms. RGD also provides object-specific queries focused on a particular type of data (e.g., QTLs). As an example of these types of object-specific queries, this protocol illustrates how to search for QTLs related to blood pressure phenotypes.
While a QTL query or report page differs in some respects, such as search options or data available, from the corresponding pages for other types of data, there are substantial similarities. RGD report pages, in particular, contain many of the same elements regardless of the data type. These include official nomenclature for the object, annotations in the form of both ontology terms and free-text notes, and links to related information in other databases. In addition, reports for genomic and genetic data types include information on mapping and a link to various genome browsers to permit viewing of the object in its genomic context. Many of these elements are reciprocally linked to information of other data types. A link on a QTL report page, for instance, will lead to a gene report page which will, in turn, link back to the QTL. Each of these characteristics is reviewed in this protocol.
Necessary Resources
Hardware
Computer with functioning Internet connection
Software
Web browser (Internet Explorer 7+, Firefox 3+, Chrome 13+ or Safari 5+)
Navigate to the object-specific query page
- From the RGD home page (http://rgd.mcw.edu), or any internal page, click the Data tab in the top menu bar to get to a listing of the various types of biological data stored in RGD. Click “QTLs” to open the QTL query page.Using the RGD Specific Query pages allows the user to enter query criteria specific for a particular data object. These other query pages can be reached by selecting the appropriate data object from the list or menu bar.
- In the “Keyword” search box in the left center of the page, type blood pressure (Fig. 1.14.11A). Under “Limit Results (optional)” change the chromosome selection from “All” to “5” in the Chr (chromosome) drop-down menu, (Fig. 1.14.11B). Click on the “Search QTLs” button to run the search.Any or all of the search options under “Limit Results (optional)” may be utilized to narrow the search. When using the Start and Stop parameters for chromosomal position, the positions given must be positions from the Genome Assembly listed in the “Assembly” drop down box. In the case of rat, the current reference assembly, version 3.4, is the default for the search. The addition of new data often shifts the absolute base-pair positions of genes and markers slightly from one assembly to the next, which is why it is important that the positions match the underlying assembly if they are to be accurate.
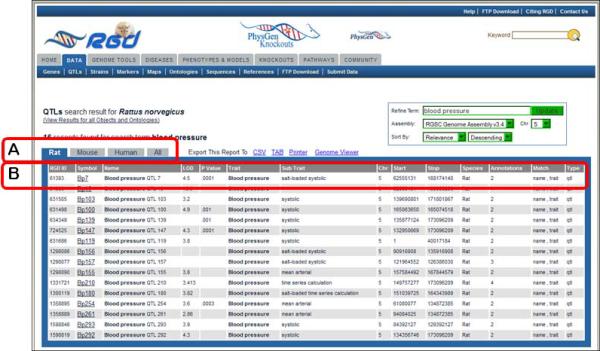
- Examine the QTL results page (Fig. 1.14.12).The QTL search results page contains a list of all of the rat QTLs in RGD that match the search criteria (in this case, 16 hits). Mouse and human QTLs for the same search may be found by selecting the appropriate tab on the results page (Fig. 1.14.12A). For each QTL, the list gives the RGD ID, official symbol and name, LOD score, the P value (if available), trait, subtrait, chromosome, the start and stop base-pair positions, species, number of annotations, what the search term matched, and object type (Fig. 1.14.12B).
Figure 1.14.12.
QTL search results. This page has functionality similar to the genes search results page (Fig. 1.14.4).
Select a query result to view the corresponding report page
-
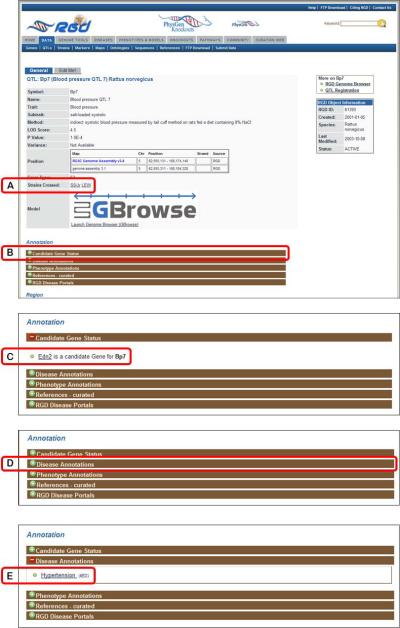
4.Click on the symbol for Bp7, at the top of the results list, to go to the RGD report page for that QTL (Fig. 1.14.13).RGD report pages are divided into sections depending on the type of data being displayed. The QTL report page has sections for general information, annotations, genomic region, and additional information (Fig. 1.14.13). Note, however, that not all QTL report pages will have all of the subsections in each section.
-
5.The names of the strains used in the linkage analysis (“Strains Crossed” in the general section at the top of the page) provide links to the strain report pages. Click on LEW (Fig. 1.14.13A) to access the report page for that rat strain.The strain pages contain extensive information on characteristics such as derivation and disease associations, as well as links to related strains and associated ontology terms to aid in data mining.
-
6.
Return to the QTL report page. In the “Annotation” section click on the “Candidate Gene Status” bar (Fig. 1.14.13B). Click on the link “Edn2 is a candidate Gene for Bp7” (Fig. 1.14.13C) to access the gene report page for the candidate gene for Bp7.
-
7.Return to the QTL report page. Click on the “Disease Annotations” bar (Fig. 1.14.13D), followed by clicking the term “Hypertension” (Fig. 1.14.13E) to go to the details page for that annotation (Fig. 1.14.14).Each annotation report page provides information on evidence code, a link to the reference from which the annotation was made, the number of RGD objects annotated to the ontology term, a link to the ontology term report page (Fig. 1.14.10), and the number of references in RGD curated for the object of that annotation.
-
8.
Return to the QTL report page and scroll down to the “Annotations” section (Fig. 1.14.13). Click on the “References-curated” subsection bar to view the references for the three papers with information about Bp7. Click on a citation link to read the abstract on the reference report page, and see what other objects and what other annotations are associated with the same reference.
Figure 1.14.13.
Top of QTL report page including general information section and “Annotation” section.
Figure 1.14.14.
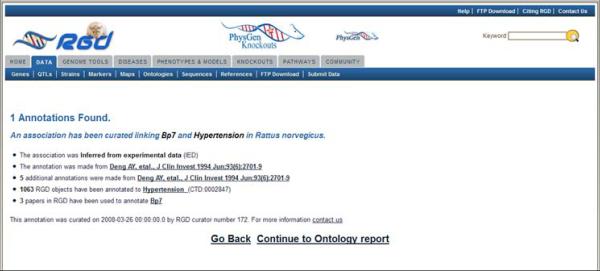
Annotation report page. This page gives annotation information such as type of evidence, data source, number of annotations from that data source, and number of references associated with the RGD data object.
Examine the genomic Region section of the QTL report page
-
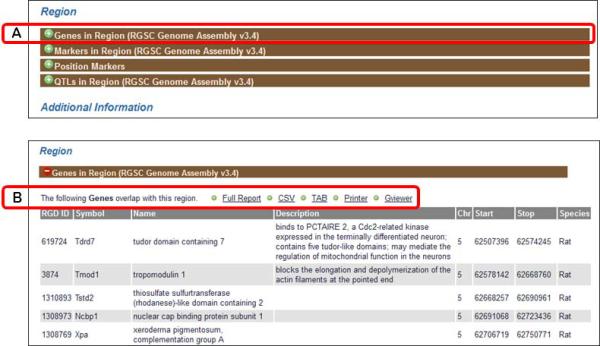
9.Return to the QTL report page by clicking the browser's Back button. Scroll down to the Region section, which provides information on the genomic context of the QTL including genes in the region, the position markers which define the QTL, other markers in the region and QTLs in the region. Click on the “Genes in Region” bar (Figure 1.14.15A). This will open to show a table displaying all of the RGD genes that overlap Bp7 (Figure 1.14.15B).The”Genes in Region” table can be downloaded as a CSV (comma-separated values) or TAB (tab separated) file, sent to a printer, or loaded into the GViewer tool (Figure 1.14.15B).
-
10.
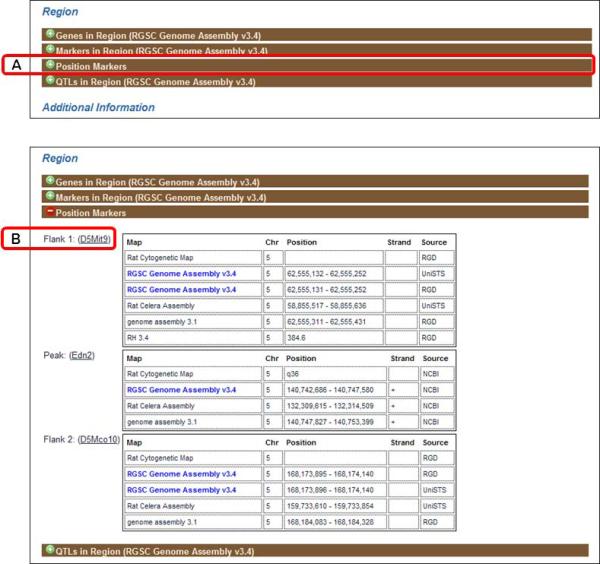
Close the “Genes in Region” by clicking the bar a second time. Click on the “Position Markers” subsection bar (Fig. 1.14.16A). Adjacent to “Flank 1” (Fig. 1.14.16B), click on “D5Mit9” to go to the SSLP report for that marker.
Figure 1.14.15.
“Genes in Region” subsection of the QTL report page.
Figure 1.14.16.
“Position Markers” subsection of the QTL report page.
Examine the remaining subsections of the QTL report page
-
11.
Return to the QTL report page. The “RGD Curation Notes” subsection of the “Additional Information” section contains free-text notes giving additional details about the QTL that are not included elsewhere in the report. Click the “RGD Curation Notes” bar (Fig. 1.14.17A) to see the table of notes. Click the link “619653” in the “Reference” column (Fig. 1.14.17D) to view the abstract of the paper detailing the synteny between rat, mouse, and human loci linked to hypertension. The reference page includes a link to the abstract at PubMed, which in turn often links to a copy of the full text of the article.
-
12.
Return to the QTL report page. In the “Additional Information” section click on the “External Database Links” bar (Fig. 1.14.17B), and then click on “Bp7” adjacent to “Entrez Gene” (Fig. 1.14.17C) to open the NCBI Gene page for Bp7.
Figure 1.14.17.
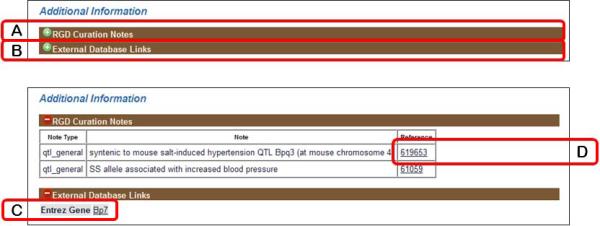
The “Additional Information” section of the QTL report page.
BASIC PROTOCOL 4
USING THE RGD GENOME BROWSER (GBrowse) TO FIND PHENOTYPIC ANNOTATIONS
The GBrowse genome browser (Stein et al., 2002, Donlin, 2009) from the Generic Model Organism Database project (http://www.gmod.org) is an interactive tool which allows researchers to visualize a variety of genetic and phenotypic data types in their genomic context. Virtually all of the data within the Rat Genome Database have been associated with the genome sequence in one way or another. As fundamental datasets such as genes, quantitative trait loci, microsatellite and SNP markers, and sequence resources such as ESTs, are aligned with the genome sequence, they bring with them phenotypic and other information. This information includes methylation data, associations with disease, human synteny, and many types of variant/mutation data. Any or all of these can be accessed via the GBrowse genome browser and their relationship to the genomic sequence explored.
This protocol details the use of the GBrowse tool to look at a genomic region associated with hypertension.
Necessary Resources
Hardware
Computer with functioning Internet connection
Software
Web browser (Internet Explorer 7+, Firefox 3+, Chrome 13+ or Safari 5+)
- From the RGD home page (http://rgd.mcw.edu, Fig. 1.14.1), click on “Rat Genome” in the left center of the page to access RGD's rat genome browser.From RGD pages other than the home page, click on the Genome Tools tab at the top of the page. On the Tools page that appears, click on either “Rat GBrowse” on the left of the menu bar at the top of the page or “Rat Genome Browser” in the list of RGD tools.The Rat GBrowse home page has a Landmark or Region search box, examples of search terms, and a drop-down help menu (Fig. 1.14.18).
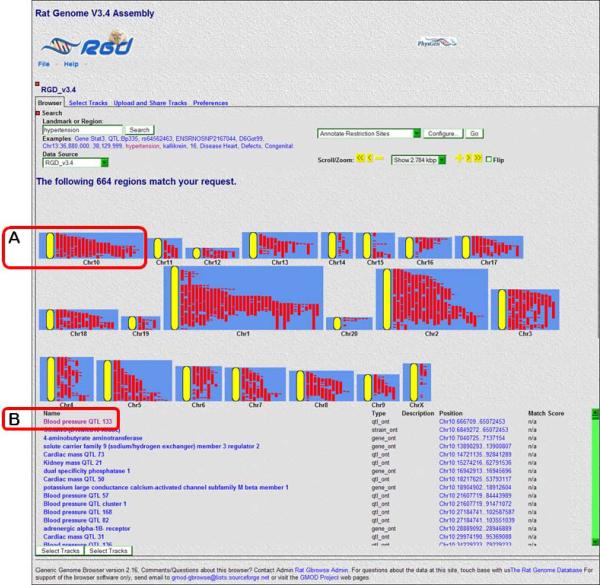
- In the text box under “Landmark or Region:” (Fig. 1.14.18A) type hypertension. Click “Search” or press the “Enter” key on the keyboard.Results of the search are grouped by chromosomal location (Fig. 1.14.19). Genes, strains, and QTLs are shown as red bars on the diagram for each chromosome. Scrolling over the bars highlights the object in the list below the chromosome diagrams.
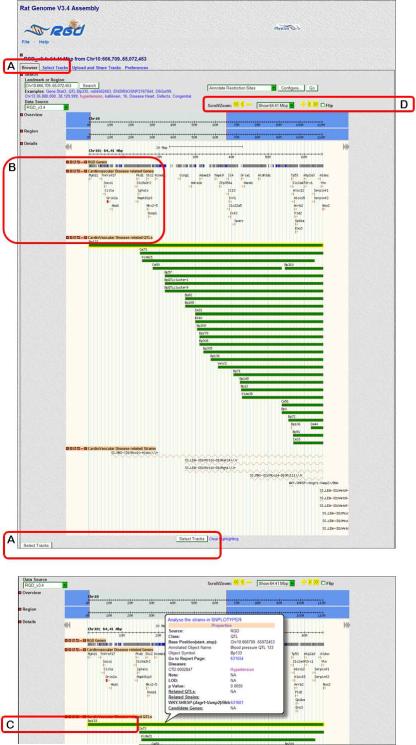
- Scroll over the first red bar on the upper left side of the chromosome 10 diagram (Fig. 1.14.19A). The bar is identified as “Blood Pressure QTL 133” by a pop-up label and a self-scrolling list below the chromosome diagrams (Fig. 1.14.19B). To go to the detail page for the chromosomal region that contains the Bp133 QTL, click the red bar for “Blood pressure QTL 133” (Fig. 1.14.19A).The detail page (Fig. 1.14.20) shows all of the currently known and predicted genes located in the region, the cardiovascular disease genes, QTLs and congenic or mutant strains found in the displayed chromosomal region. Clicking on the +/− icon to the left side of each track label opens (+) or closes (−) the track (Fig. 1.14.20B). The view can be zoomed or scrolled along the chromosome by using the arrowheads, +/− symbols, and the drop-down menu above the right side of the chromosome display (Fig. 1.14.20D).
Click on the symbol or bar representing Bp133 (Fig. 1.14.20C). A pop-up box is displayed, which contains the QTL's name/symbol, genomic location, and other information including a link to the QTL report page.
Figure 1.14.18.
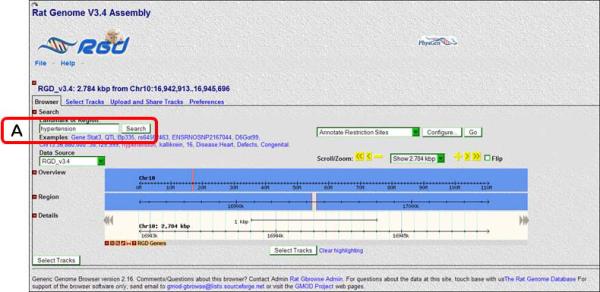
A default view of rat GBrowse with an RGD genes track selected.
Figure 1.14.19.
GBrowse search results page for hypertension.
Figure 1.14.20.
GBrowse detail page for Bp133, including view with QTL pop-up information.
Restrict the scope of the displayed information
-
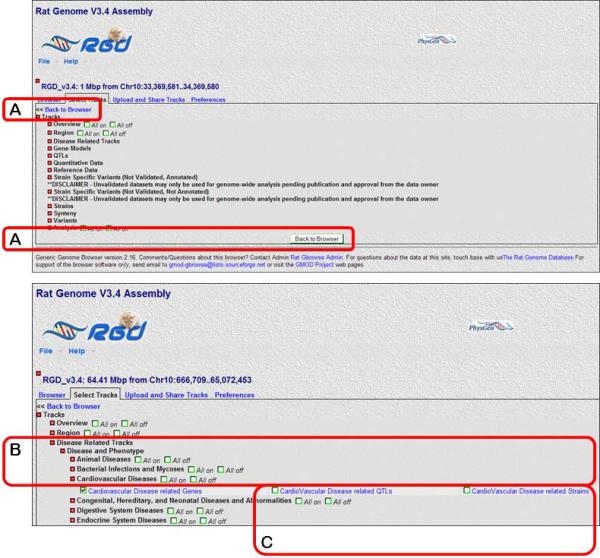
5.Click on the “Select Tracks” link from the menu bar on the upper left side of the page or either of the two “Select Tracks” buttons found near the bottom of the page (Figure 1.14.20A) to return a list of all available tracks that can be selected with checkboxes (Figure 1.14.21).GBrowse display tracks give users the ability to show only what interests them. For instance, if only gene data is of interest, one can deselect “QTL” to see only information on genes.
-
6.Click on the plus signs (+/− toggle icons) to the left of “Disease Related Tracks”, “Disease and Phenotype”, and then “Cardiovascular Diseases” (Fig. 1.14.21B). Deselect the check boxes labeled “CardioVascular Disease related QTLs” and “CardioVascular Disease related strains” (Fig. 1.14.21C).All track groups have the “All on” and “All off” options. For example “All on/All off” allows the simultaneous selection/deselection of cardiovascular disease related genes, QTLs, and strains.
-
7.Click the “Back to Browser” link at the upper left or the “Back to Browser” button at the bottom of the page (Fig. 1.14.21A).The updated image contains track bars representing only “RGD genes” and “Cardiovascular Disease related Genes”.
Figure 1.14.21.
GBrowse track selection page. The track content of the details display is determined by the choices made on this page.
BASIC PROTOCOL 5
USING PHENOMINER TO VIEW QUANTITATIVE PHENOTYPE DATA
The purpose of the PhenoMiner tool is to integrate phenotypic data from different rat strains, collected by a variety of measurement methods under various experimental conditions. The data currently in PhenoMiner is comprised of results from the PhysGen Program for Genomic Applications, a large scale phenotyping project which has collected data for consomic, ENU mutant, and knock-out rat strains. Future content will include data from the rat physiological literature and directly from laboratories engaged in the study of rat physiology.
This protocol will show how users can customize their queries by selecting from four categories: rat strains, experimental conditions, clinical measurements, and measurement methods. The queries are built step by step and a tally of results obtained at each step of the query building process is provided.
Necessary Resources
Hardware
Computer with functioning Internet connection
Software
Web browser (Internet Explorer 7+, Firefox 3+, Chrome 13+ or Safari 5+)
- From the RGD home page (http://rgd.mcw.edu, Fig. 1.14.1), click on “Phenotypes & Models” in the right center of the page to access RGD's rat phenotype browser.Alternatively, from most RGD pages the “Phenotypes & Models” can be reached by clicking on the “Phenotypes & Models” tab at the top of the page.
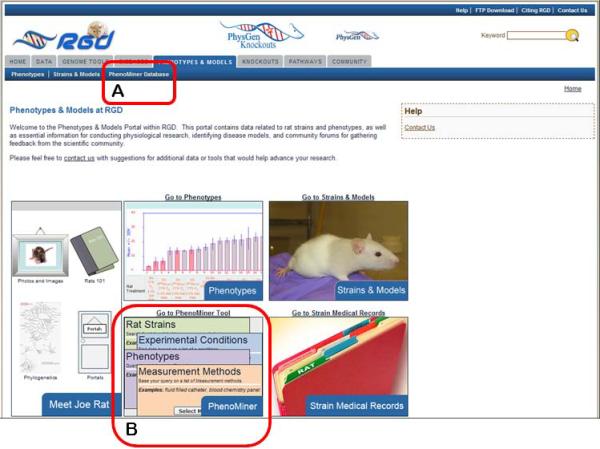
- On the “Phenotypes & Models” page click on the “Phenominer Database” link on the menu bar on the top of the page (Fig. 1.14.22A).Alternatively, the “Go to PhenoMiner Tool” link or the “Phenominer”image box lower on the page (Figure 1.14.22B) can be clicked to link to the “Phenominer Database” page.
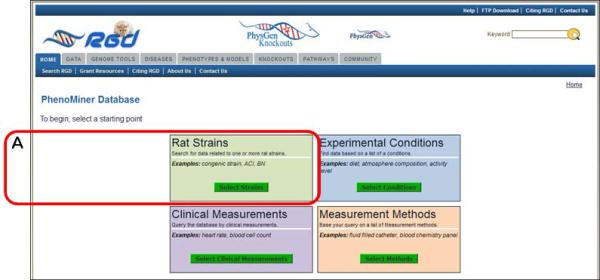
- To begin the phenotype data retrieval process click on the “Rat Strains” button in the left center of the Phenominer Database home page (Fig. 1.14.23A).The tool also allows data retrieval to begin with “Experimental Conditions”, “Clinical Measurements”, or “Measurement Methods” by clicking any of the other three corresponding buttons first.
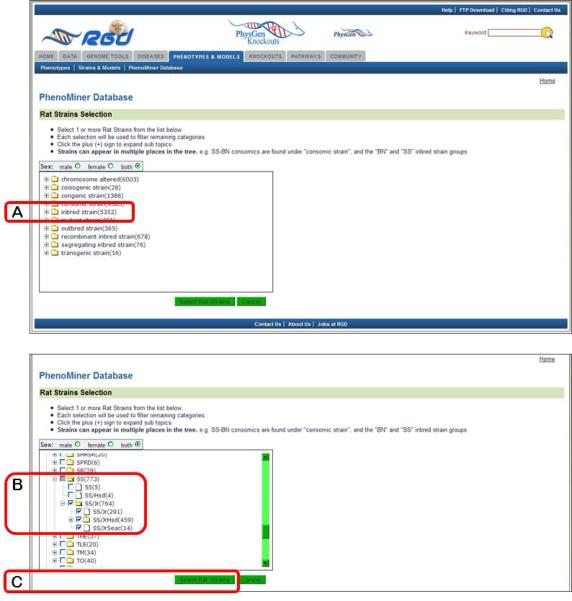
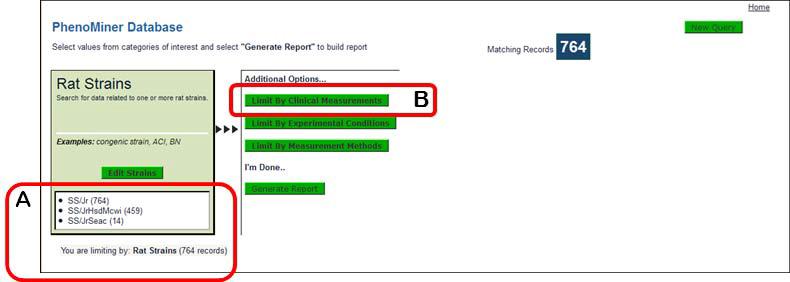
- On the left side of the “Rat Strains Selection” page click on the “+” sign to the left of the “inbred strain” folder (Fig. 1.14.24A), scroll down and click on the “+” sign to the left of the “SS” folder, click the “+” sign to the left of the “SS/Jr” folder, and finally select the check box to the left of the “SS/Jr” folder (Fig. 1.14.24B). Click the “Select Rat Strains” button below the strain selection browser (Fig. 1.14.24C).On the returned page the selected rat strains are listed individually (Figure 1.14.25A), and the other three options from the home page of the PhenoMiner Database are listed along with a “Generate Report” button. The data can be further limited by clinical measurements, experimental conditions or measurement methods. Generate Report may be selected after any of the limiting parameters are selected.
Click on “Limit By Clinical Measurements” to limit the data retrieval based on the type of phenotypic measurement (Fig. 1.14.25B).
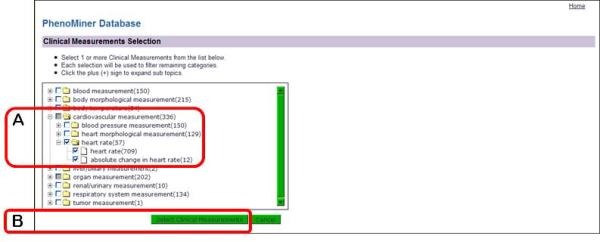
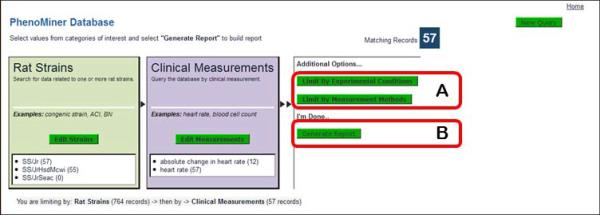
- On the left side of the “Clinical Measurements Selection” page (Fig. 1.14.26), click on the “+” sign to the left of the “cardiovascular measurement” folder, click on the “+” sign to the left of the “heart rate” folder, select the check box next to the “heart rate” folder (Fig. 1.14.26A), and finally click the “Select Clinical Measurements” button under the selection box (Fig. 1.14.26B).On the returned page the selected clinical measurement categories are listed beside the rat strain list. The “Additional Options” now lists the last two limiting categories (Fig. 1.14.27A).
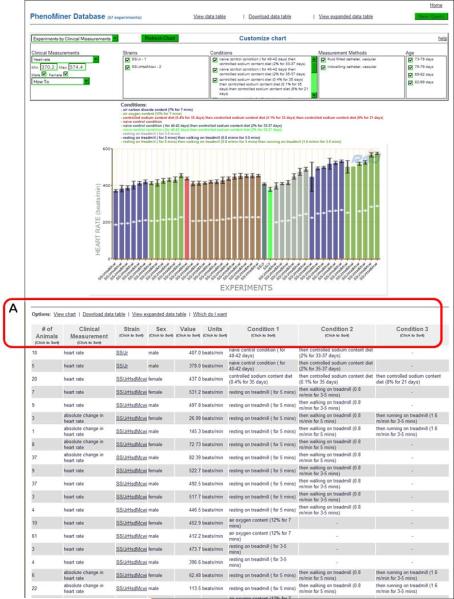
- To return the data with the selected parameters, click the “Generate Report” button in the middle of the page (Fig. 1.14.27B).The default graph that is displayed on the returned page (Fig. 1.14.28) has heart rate values on the Y axis and experiments labeled by strain symbol on the X axis. The data is also displayed in a table format underneath the graph. The data table has sortable columns, expandable rows, and the option of downloading data to a spreadsheet (Fig. 1.14.28A).
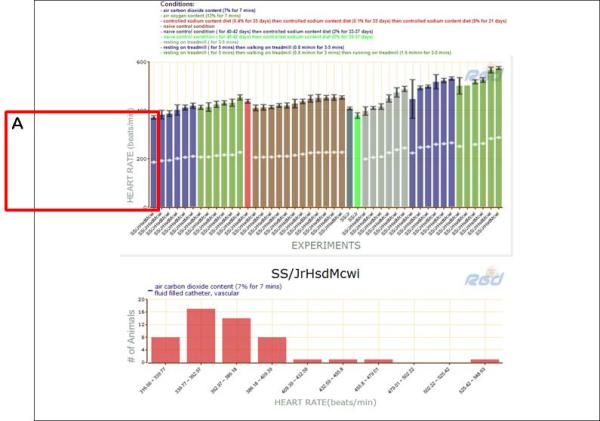
- Click on the first bar on the left side of the graph (Fig. 1.14.29A) and scroll down the page to see a second graph that has more detail for the experiment that is represented by the selected bar in the first graph.The experiment-specific graph displays number of animals on the Y axis and discrete ranges of heart rate values on the X axis. This view gives finer detail than the mean values shown in the larger graph. The data seen in the experiment-specific graph can be changed by clicking on any of the bars in the first graph.
- On the upper left side of the page (Fig. 1.14.30A), choose “absolute change in heart rate” in the “Clinical Measurements” drop-down menu (arrowhead) and then click the “Refresh Chart” button above and to the right of the “Clinical Measurements” drop-down menu.The refreshed page shows a new set of data (two “Clinical Measurement” categories were selected in step #6 (Figure 1.14.26). Data displayed can be altered by selecting/deselecting any of the parameters in the “Customize Chart” box above the graph(s) (Figure 1.14.30B). The “New Query” button in the upper right corner of the page may be clicked to return to the beginning of the data retrieval process (step #3).
Figure 1.14.22.
Phenotypes & Models home page.
Figure 1.14.23.
Phenominer Database home page.
Figure 1.14.24.
Rat strain selection interface.
Figure 1.14.25.
Rat strain selection results page. There are options for further limiting data by clinical measurements, experimental conditions or measurement methods.
Figure 1.14.26.
Clinical Measurements selection interface.
Figure 1.14.27.
Cumulated selections page. The data may be further limited by selection of Experimental Conditions and/or Measurement Methods on this page.
Figure 1.14.28.
PhenoMiner report page. All the data available for the selected parameters is displayed or made accessible on this page.
Figure 1.14.29.
PhenoMiner report page with extended capability displayed.
Figure 1.14.30.

The top of the PhenoMiner report page showing options to “Customize chart”.
COMMENTARY
Background Information
The Rat Genome Database was established in 1999 as a resource to support the already growing set of genomic reagents for the rat. This role has continued to expand with continuing work on the rat reference genome sequence (Twigger et al. 2008), strain-specific DNA sequencing, expanded SNP discovery, and large-scale phenotyping projects such as the PhysGen project (http://pga.mcw.edu), all needing to be integrated with existing and newly published research data. As the amount of data has grown, so has the challenge of mining relevant information and defining its meaning in the broader context of biomedical science. With this in mind, much effort has gone into the development and incorporation of biomedical ontologies such as the Gene Ontology (Ashburner et al., 2000), the Mammalian Phenotype Ontology (Smith et al., 2005), the Pathway Ontology (Petri et al., 2011), and others (Laulederkind et al., 2012). These are incorporated into the search and analysis tools, greatly facilitating the discovery of information and interpretation of its meaning.
As this unit has demonstrated, interaction with a database is primarily through a web browser and other software developed on top of the database. A concerted effort has gone into developing tools that provide access to the underlying data in a manner that is aligned with a researcher's overall goal. GViewer presents data in the context of the entire genome; GBrowse shows genes, QTLs, markers, and phenotypic annotations also from a genome-based perspective; and PhenoMiner presents quantitative phenotype data in an easy modular format. With the fundamental data curation processes in place to acquire and integrate data, the tools constructed to visualize and analyze this data are important to provide access of the data to researchers.
Many researchers using the rat as a model system are ultimately studying a specific phenotype or disease with the goal of applying this knowledge to humans. To meet this need, RGD has developed “disease portals” that present RGD data and tools from the perspective of a particular disease. The disease portals allow researchers to visit a single page that is focused on a single disease area like cardiovascular, neurological, or respiratory disease. (http://rgd.mcw.edu/tools/diseases/disease_search.cgi). These disease categories are being expanded in an ongoing process of targeted curation to create more portals devoted to particular disease areas that will cater directly to researchers working in those areas. The rest of RGD is accessible via these portals, but researchers will find the items of greatest interest first, reducing the challenge of finding the data and interpreting its meaning.
Utilizing RGD beyond the Web site
RGD has a staff of experienced curators and bioinformaticians that have a great deal of experience dealing with rat data specifically and genomic data in general. The authors of this unit welcome the opportunity to discuss data from impending publications in order to work with researchers to establish correct nomenclature for rat strains, genes, QTLs, and markers. Nomenclature guidelines are available online (http://rgd.mcw.edu/nomen/nomen.shtml). The authors can also make direct submissions of published data so that they can be more rapidly integrated into RGD and other online resources (http://rgd.mcw.edu/registration-entry.shtml). If users have questions about tools or data or would like advice on methods of online data mining of RGD resources and integration of this data with the experimental work of an individual laboratory, they should contact the RGD team via the Contact page (http://rgd.mcw.edu/contact/) and each request will be answered to the best of the staff's ability.
Suggestions for Further Analysis
Other databases relevant to the rat
RGD maintains a resources page that contains links to other online resources for rat research (http://rgd.mcw.edu/wg/resource-links). The sequence and genomic databases are well known, but for the animals themselves some very useful rat strain resources exist, including the Rat Resource and Research Center (http://www.rrrc.us//) at the University of Missouri and The National Bio Resource for the Rat in Japan (http://www.anim.med.kyoto-u.ac.jp/nbr/) at Kyoto University. The PhysGen cardiovascular phenotyping project (http://pga.mcw.edu) has a wealth of data relating specific phenotypes to a panel of consomic, ENU mutant, and knockout rat strains, allowing the assignment of phenotypes to specific rat chromosomes and genes.
Downloading bulk data
The RGD FTP site maintains regularly updated files of all RGD data that can be downloaded and used in subsequent studies. These include the curated gene, QTL, strain and marker datasets, mapping information, genome annotation (in GFF format), and sequence files for RGD data. The FTP site can be reached by clicking the “FTP Download” link found in the menu bar on the upper right of most RGD web pages (Fig.1.14.1). This link will lead to the FTP site (ftp://rgd.mcw.edu/pub/), where one can browse the files available for download.
Acknowledgements
RGD is supported by the National Heart, Lung, and Blood Institute on behalf of the National Institutes of Health [HL64541].
Literature Cited
- Ashburner M, Ball CA, Blake JA, Botstein D, Butler H, Cherry JM, Davis AP, Dolinski K, Dwight SS, Eppig JT, Harris MA, Hill DP, Issel-Tarver L, Kasarskis A, Lewis S, Matese JC, Richardson JE, Ringwald M, Rubin GM, Sherlock G. Gene ontology: Tool for the unification of biology. The Gene Ontology Consortium. Nat. Genet. 2000;25:25–29. doi: 10.1038/75556. [DOI] [PMC free article] [PubMed] [Google Scholar]
- Donlin MJ. Using the Generic Genome Browser (GBrowse) Curr Protoc Bioinformatics. 2009;Chapter 9(Unit 9.9) doi: 10.1002/0471250953.bi0909s28. [DOI] [PubMed] [Google Scholar]
- Dwinell MR, Worthey EA, Shimoyama M, Bakir-Gungor B, DePons J, Laulederkind S, Lowry T, Nigram R, Petri V, Smith J, Stoddard A, Twigger SN, Jacob HJ, RGD Team The Rat Genome Database 2009: variation, ontologies and pathways. Nucl. Acids Res. 2009;37(Database issue):D744–D749. doi: 10.1093/nar/gkn842. [DOI] [PMC free article] [PubMed] [Google Scholar]; The Nucleic Acids Research annual database edition provides an overview of RGD.
- Laulederkind SJ, Tutaj M, Shimoyama M, Hayman GT, Lowry TF, Nigam R, Petri V, Smith JR, Wang SJ, de Pons J, Dwinell MR, Jacob HJ. Ontology searching and browsing at the Rat Genome Database. Database (Oxford) 2012;2012:bas016. doi: 10.1093/database/bas016. [DOI] [PMC free article] [PubMed] [Google Scholar]
- Petri V, Shimoyama M, Hayman GT, Smith JR, Tutaj M, de Pons J, Dwinell MR, Munzenmaier DH, Twigger SN, Jacob HJ, RGD Team The Rat Genome Database pathway portal. Database (Oxford) 2011;2011:bar010. doi: 10.1093/database/bar010. [DOI] [PMC free article] [PubMed] [Google Scholar]
- Shimoyama M, Smith JR, Hayman T, Laulederkind S, Lowry T, Nigam R, Petri V, Wang SJ, Dwinell M, Jacob H, RGD Team RGD: a comparative genomics platform. Hum. Genomics. 2011;5(2):124–9. doi: 10.1186/1479-7364-5-2-124. [DOI] [PMC free article] [PubMed] [Google Scholar]; Provides an overview of how to utilize all the RGD data and tools in the areas of comparative genomics,.
- Smith CL, Goldsmith CA, Eppig JT. The Mammalian Phenotype Ontology as a tool for annotating, analyzing and comparing phenotypic information. Genome Biol. 2005;6:R7. doi: 10.1186/gb-2004-6-1-r7. [DOI] [PMC free article] [PubMed] [Google Scholar]
- Stein LD, Mungall C, Shu S, Caudy M, Mangone M, Day A, Nickerson E, Stajich JE, Harris TW, Arva A, Lewis S. The generic genome browser: A building block for a model organism system database. Genome Res. 2002;12:1599–1610. doi: 10.1101/gr.403602. [DOI] [PMC free article] [PubMed] [Google Scholar]
- Twigger SN, Pruitt KD, Fernández-Suárez XM, Karolchik D, Worley KC, Maglott DR, Brown G, Weinstock G, Gibbs RA, Kent J, Birney E, Jacob HJ. What everybody should know about the rat genome and its online resources. Nat. Genet. 2008;40(5):523–7. doi: 10.1038/ng0508-523. [DOI] [PMC free article] [PubMed] [Google Scholar]


