Abstract
This work determines the dielectrophoretic response of surface modified polystyrene and silica colloidal particles by experimentally measuring their Clausius-Mossotti factors. Commercial charged particles, fabricated ones coated with fibronectin, and Janus particles that have been grafted with fibronectin on one side only were investigated. We show that the dielectrophoretic response of such particles can be controlled by the modification of the chemistry or the anisotropy of their surface. Moreover, by modelling the polarizabilities of those particles, the dielectric parameters of the particles and the grafted layer of protein can be measured.
INTRODUCTION
Microfluidic technologies have emerged as a potentially useful tool in multiplexed cells analysis for biological applications. Such technologies render precise positioning of hundreds of cells in order to define interactions with their surrounding environment, allowing the monitoring of secreted factor via perfusion devices.1 Also, colloidal particles with spherical shapes and isotropic surface chemical groups have been widely instigated through a wide range of topics such as synthetic strategies, structure-property relationships, and self-assembly behaviour. Therefore, engineered colloidal particles can be used in microfluidic devices to create local sensors for protein-protein interactions,2, 3 for cell targeting,4, 5 or to organise cells on a substrate.6 Those smart colloidal particles can be particles coated with bio-molecules (as antibodies for cell-to-particle sensing7 or fibronectin for cell adhesion8) or anisotropic particles such as Janus particles4 (JPs). Contact-less handling of particle handling in a microfluidic chip with dielectrophoresis (DEP) has proven to be powerful enough to obtain precise 3D localisation and to control particle rotation.9, 10, 11 However, DEP can be difficult to achieve for complex multi-functional particles since their dielectric responses can be difficult to model and understand mainly because of their unmeasured unique dielectric properties.
In this work, we propose the use of DEP to extract the dielectric properties of complex engineered particles that has been grafted on their surface with fibronectin. We first detail theoretical considerations of the method we are using and then we investigate three different types of particles. We first focus on polystyrene (PS) 400 nm particles that have been surface modified with organic functions (Figure 1b1). Then, we analyse the influence of a fibronectin coating12 (adsorption or covalent coupling) on the surface conductances of a 1 μm PS particle (Figures 1c1, 1c2). We finally investigate the DEP response of 2 types of JPs (100 nm Au/1 μm PS and 100 nm Au/1 μm ) that have be selectively grafted with fibronectin on one side only as shown on Figures 1b3, 1c3.
Figure 1.
Schematic representation, SEM, and fluorescence images of the investigated particles. (a) Dielectrophoretic responses of isotropic and anisotropic particles coated with fibronectin. (b) SEM images of plain PS (b1) and Janus particles (100 nm Au/1 μm PS) (b2). (c) Fluorescence images of 1 μm PS particle coated with fibronectin (adsorption (c1) or covalent coupling (c2)) and JP ((c3) green: fluorescence stained PS particle side, red: fibronectin on Au side). The difference is size between adsorbed (c1) and covalent coupling (c2), however, the same size, may be the difference in the scattered fluorescence intensity of those particles. The present work shows a much higher surface concentration of fluorescent fibrinogen in the adsorption coupling than the one in the covalent coupling. The scale bar indicates 1 μm.
THEORY: KEY ROLE OF THE CLAUSIUS-MOSSOTTI FACTOR (CMF)
The dielectrophoretic response of a particle is influenced by its surface functionalization or by the particle anisotropy as illustrated by Figure 1a. The CMF, whose general form is shown in Eq. 1, translates its relative polarizability to the medium at a given frequency according to the complex permittivities of the particle itself (diameter a, permittivity , conductivity ) and the medium (permittivity , conductivity ). The polarization mechanism of a non-charged particle suspended in an electric field is an ongoing research subject.13, 14, 15 More than only the particle bulk electrical polarization effect, the double layer plays a significant role in the global process. In particular, the Maxwell-Wagner interfacial polarisation mechanism occurs when the two contacting phases have different conductivities and electric permittivities. The Maxwell-Wagner model was generalized by O'Konski,16 who took the surface conductance (usually expressed in nS) explicitly into account into the surface conductivity (3). This model has been successfully used by many groups to explain the experimental observation of the frequency dependent dielectric and dielectrophoretic behaviour of larger particles (greater than 250 nm) at frequencies where the Maxwell-Wagner polarisation is dominant.17, 18 Finally, taking into account the contributions of both the diffuse and the Stern layers, the global surface conductance of a colloidal particle determines its dielectrophoretic response at a given medium conductivity.
| (1) |
where
| (2) |
and
| (3) |
Several methods have been proposed in literature to determine those surfaces conductance, namely, crossover frequency direct measurement,18 electro-rotation,19 optical tweezers,20 or zeta potential measurements.18, 21 The latter may provide information on the charge visible at the end of the double layer and thus on the conductance of the diffuse part of the double layer. If performed in low conductivity media, this diffuse part of the double layer can be neglected18, 21 and those measurements will not provide enough information to extract the mobility of counterions in the Stern layer. Moreover, zeta potential measurement on Janus particles is not possible because of their induced charge electroosmosis motion that will bias their response to DC field used in zeta potentials measurements. Each method, the cited method, has its own advantages and drawbacks but none of them provides the entire for a range of frequency, thus preventing a precise knowledge of particles motion (direction and magnitude) under pure DEP regimes. We have used a method introduced by Pethig et al.22, 23 and updated by our team24 to experimentally evaluate the CMF of any polarizable particle, thus allowing a direct measurement of their surface conductance. Briefly, this method consists in measuring the transient velocity of said particles placed in a microfluidic chip that presents parallel micro electrodes. Particles are successively submitted to electro-kinetic effects while changing the frequency of the applied electric field. By tuning the AC frequency, particles are first placed above the center of the electrodes by AC electroosmosis and then submitted to a pure DEP regime in which they move from the center of the electrodes to their edges for positive dielectrophoresis (p-DEP). During this transient regime, the velocity of the particles is recorded through a high speed camera and the value of for this frequency is extracted by equalizing the drag force and the DEP force. For negative dielectrophoresis (n-DEP), the particles are first placed at the edges of the electrodes and repelled when applying a n-DEP frequency. After recording the repelling velocity, the value of for this frequency is extracted in the same way as for p-DEP ones. These processes are repeated over the entire frequency range and the is reconstructed.
The Maxwell-Wagner model can be used to study the investigated particles because the range of their sizes (a ), the range of the frequency of the applied electric field (f ), and the constant medium conductivity () are in the scope of hypothesis used to apply the Maxwell-Wagner interfacial relaxation model. Once the CMFs of the investigated particles are measured, we then used their corresponding Maxwell-Wagner model to fit their dielectric properties, namely, the surface conductance for an uncoated particle, the number of protein layers for coated particles, and even the relative permittivity of fibronectin.
MATERIAL AND METHODS
Particle fabrication and preparation
Particles were prepared from commercially available solutions: 1 μm PS, PS-COOH modified, silica (), -COOH modified, 250 nm Au particles (BBInternational, Ltd).
Adsorption and covalent coupling of particles were performed following optimized protocol.12 For adsorption, a total number of particles of 65.6 × part/ml were 3× centrifugated–resuspended in a buffer solution of 1 × 2-(N-morpholino) ethanesulfonic acid (MES) whose pH was adjusted to 7.4. Then, particles are mixed at room temperature with a 20 μg/ml protein mix (1:1 w/v Fibronectin:fluorescent fibrinogen (Invitrogen)) for 1 h. Finally, the solution was washed to remove the unadsorbed proteins by 3× centrifugations–resuspensions in MES buffered solution.
For covalent coupling, we have used a 2 steps covalent coupling in which 10 μmol sulfo-N-hydroxysuccinimide (NHS) and 2.05 μmol 1-ethyl-3-(3-dimethylaminopropyl)-carbodiimide (EDAC) were previously added to the colloidal solution before the 20 μg/ml protein mix.
Thioled-Au particles were obtained by mixing overnight Au particles with 0.1 M 16-mercapto-1-hexanedecanoic acid (MHA) and 0.9 M 11-mercapto-1-unadecanol (MuOH) in ethanol. Those particles were then resuspended in MES buffer solutions and a 2-steps covalent coupling procedure was applied while replacing NHS by 2.2 μmol pentafluorophenol (PFP) before the 20 μg/ml protein mix.
Janus particles were prepared by metal evaporation of a 100 nm thickness of Au on a wafer previously coated with selected particles. This process has been described in previous work.11 Depending on the side on which proteins need to be grafted, the use of different types of JPs is required. For the coating of the dielectric (PS or ) side, Janus particles are prepared with activated carboxylate particles. For the coating of the Au side with proteins, Janus particles are prepared with unfunctionalized particles and the Au side is thioled.
Finally, particles were 3× centrifugated–resuspended in a low conductivity isotonic media made of 8.5% sucrose and 0.3% dextrose in ddH2O (conductivity and pH = 5.5). The choice of this buffer was motivated by its very low conductivity (known as DEP-manipulating buffer) and it has been proven not to injure cells viability for couple hours during DEP manipulation.25 Our engineered particles may likely be handled in this kind of buffer to interact with cells.
Experimental determination of
Colloids are pushed into a microchannel by a pressure driven flow where a pair of coplanar electrodes are linked to a remote controlled power generator. After stopping the flow, the colloids are first forced to be placed above the center of the active electrodes by electro-osmosis and then the tested frequency is applied as presented in the Introduction. Once the velocity of the particles is acquired for a given frequency, it is divided by the α parameter 6. This value is the result of the equilibrium between the hydrodynamical drag force 4 and the DEP force that appears during the motion period 5.
| (4) |
| (5) |
| (6) |
Experiments were performed on at least 30 particles to extract statistical significant data. The standard deviation for each point is systematically reported on the experimental graph.
An automated platform was fabricated to apply successively the frequencies (ACEO then p-DEP) to the entire range of DEP frequencies studied (). The gravity-induced particle sedimentation was not taken into account since on the time frame of our experiments (ca. 3 min per experiments), the sub- and micrometric particles () did not had time to sediment, as it has been shown by Castellanos et al.,26 in our experimental conditions (size of particles and electric field strength). Moreover, since our method only takes into account planar displacement, the gravity induce flow would not affect the projected DEP coplanar force.24
Fits
Fits are performs with Origin8 (OriginLab). The explicit form of is obtained from the original equations, such as Eq. 9, with Maxima software. All numerical variables are replaced and only the fitting variables are maintained. The Nonlinear Multiple Variables Fitting tool of Origin is then used on the experimental data and fitting variables are initialized at values in the order of magnitude of the variable (e.g., are initialized at 1 nS). In order to strengthen the importance of the crossover frequency, closest (n = 4) neighbours to zero value have been weighted 5 times more than the other points. By doing so, we enhance the probability of the fitting curve to actually cross the zero value at the experimental frequency value. Once fitted, the values obtained for the fitting parameters were used to plot the corresponding curve.
The crossover frequencies values were estimated from the intersection between mean and standard deviation projections of two proximal neighbours and the line.
RESULTS
Polystyrene functionalized colloids
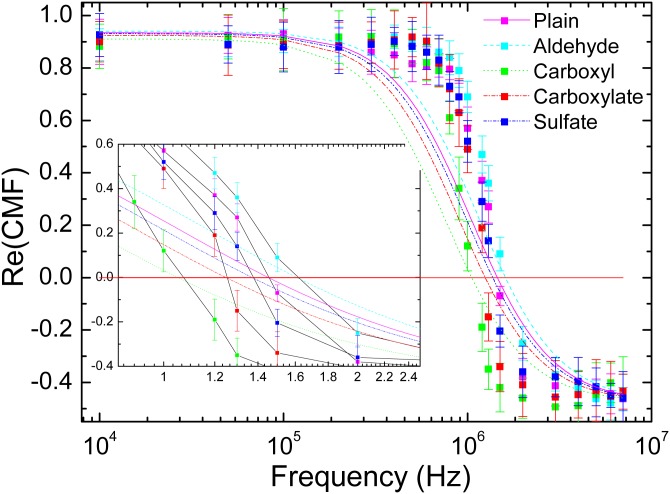
The influence of surface functionalization was recorded on 400 nm fluorescent PS colloids that are commercially available as a 5 ml-pack (Duke) with aldehyde, carboxyl, carboxylate, and sulfate groups on their surfaces. Particles sold by the distributor without explicit surface treatment were also evaluated and will be further denominated as plain particles. Those widely used particles present carboxyl group on their surface but with a lower density than the carboxyl modified particles.
The CMF determination process is performed for all frequencies and plotted on Figure 2. The general shape of PS particles is consistent for all particles: a positive values area separated by a negative values one, both limiting the p-DEP and n-DEP regimes. The frequency at which the values of change sign is known as the crossover frequency. In this range of frequency (f ), only one crossover frequency is visible. For the studied particles presenting different surface functionalization, we can spot a shift of their crossover frequencies up to several hundreds of kHz (carboxyl: ; carboxylate: ; sulfate: ; aldehyde: ).
Figure 2.
for 400 nm PS functionalized particles: Aldehyde, carboxyl, carboxylate, and sulfate. Experimental values are represented by dots for all tested frequencies whereas fitted functions are represented in dashed lines.
Particles coated with proteins
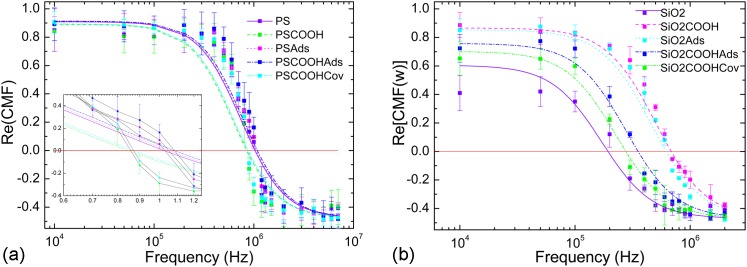
Colloidal particles can be grafted with fibronectin either by adsorption or covalent coupling.12 Coupling reactions were performed on 1 μm PS, plain, and carboxylated particles according to the “optimized” procedure presented in Ref. 12. Briefly, we have performed either adsorption or covalent coupling of fibronectin on PS or particles. While adsorption consisted in “sticking” proteins on the surface of the particles, covalent coupling used a crosslinker molecule, EDAC, to link the carboxylated groups on the surface of the particles to the terminal amine group of the protein. CMF factors of those particles are presented in Figure 3 for both particles.
Figure 3.
experimentally determined for (a) PS and (b) functionalized particles. The symbol Ads stands for adsorption coupling and Cov for covalent coupling method. Experimental values are represented by dots for all tested frequencies whereas fitted functions are represented in dashed lines.
Even if the particles all had the same size, they present shifted crossover frequencies according to the way the proteins were grafted. Hence, for PS particles, adsorbed particles present higher experimental crossover frequencies (respectively, and for PS-COOH and PS) than do plain ones . However, carboxylated functionalized particles with or without proteins present low experimental crossover frequencies (respectively, and for plain PS-COOH and PS-COOH covalently coupled with proteins). For silica particles, a decrease in experimental crossover frequencies is observed according to the following order: -COOH plain (), plain with adsorbed proteins (), -COOH with adsorbed proteins (), -COOH with covalently coupled proteins (), and plain () without proteins. Silica particles with positive-to-negative DEP behaviour have been observed to be strongly depending on their size,24, 27 surface charge, and solution pH28 and we refer the reader to Sec. 3 for details on the experimental conditions.
Functionalized Au particle
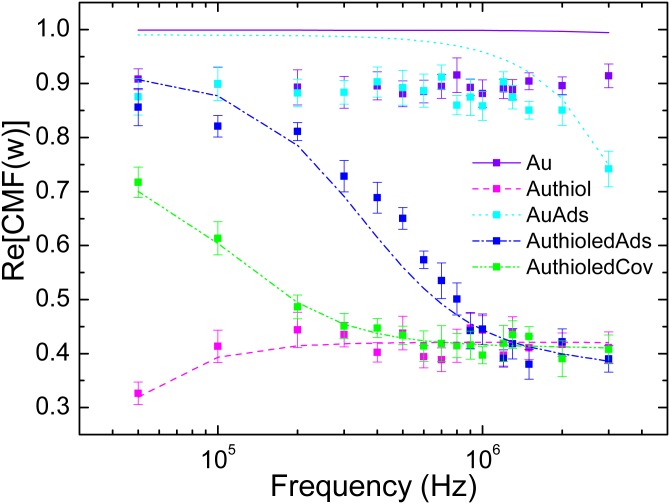
Functionalized Au particle responses to DEP are also evaluated. Adsorption and covalent coupling of fibronectin were performed on 250 nm diameter particles (BBInternational, Ltd). For covalent coupling, a self assembled monolayer (SAM) of alkyl thiols is initially coated on the particles. Figure 4 presents the experimental CMFs for such particles. We observe a positive value for the plain Au particles, as expected in the range of investigated frequencies.29 However, the SAM of alkyl thiols seems to shield the electric field and lower the CMF values down to a quasi-constant value of at high frequencies. When coupled with proteins, a significant change in the CMF value can be observed. Adsorption of proteins on Au particles, either plain or alkylated, seems to create a decrease in the CMF from high values () to the same plateau low-value of . When covalently coupled with proteins, the CMF does not even reach the high values but reaches the plateau region at f = 200 kHz. The physical origin of those effects is further discussed in the next section.
Figure 4.
experimentally determined for functionalized Au particles. Experimental values are represented by dots for all tested frequencies whereas fitted functions are represented in dashed lines. Particles were first coated with thiols and then with proteins according to adsorption and covalent coupling protocols.12
Janus particles grafted on one side with proteins
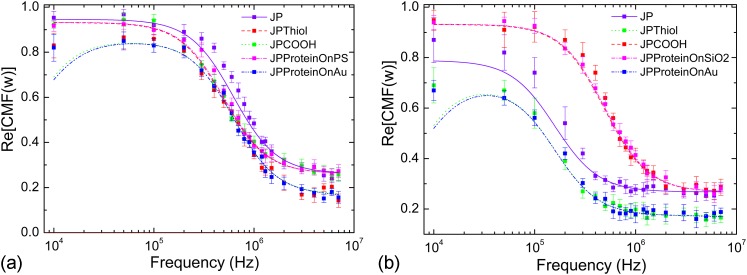
Janus particles are manufactured by depositing a monolayer of PS or particles on a glass substrate. A layer of 100 nm Au is deposited by ion-beam evaporation and particles are released by sonication in DI water.10, 11 JPs can be selectively covalently coupled with fibronectin on one side only.12 Selective grafting of proteins requires either plain or COOH functionalized particles according to the selected side to graft. Once the fabrication process is completed, particles are inserted into the microfluidic chip. Quantification of the CMF is performed for plain JPs, alkylated JPs, JPs with fibronectin on the PS or side, and JPs with fibronectin on the Au side. Figure 5 presents the experimental CMFs. A constant positive behaviour is observed for all JPs, which is consistent with the experiments conducted by Zhang and Zhu30 for their Au/PS JPs coated with variables thickness of thiols. For plain JPs, the values of their CMFs are high () for low frequencies () and fall for higher frequencies () to a plateau value of . Changing the surface functionalization of the PS side does not have a significant influence, but for JPs, the CMF values are higher () compared to the plain ones () at low frequencies. When coupled with proteins on the PS or side, JPs present a slight shift of the fall frequency but the plateau values are the same ( and ) at low and high frequencies. On the contrary, when coupled on the Au side, either with thiols only or thiols and proteins, a significant shift is observed at low frequencies () and the plateau at high frequencies is lowered (). Those behaviours show the significant contribution of the Au side of JPs on their polarizability process. If this side is modified, a dielectric shielding of Au takes place and lowers the polarizability of the particles, as presented in previous paragraphs.
Figure 5.
experimentally determined for (a) PS and (b) JP particles. The symbols JP, JP-Thiol, and JPCOOH stand, respectively, for plain JPs (PS or with 100 nm Ti/Au), JPs whom Au side has been alkylated, and JPs that present carboxylate COOH function on their PS or side. The symbols JPProteinOn stand for JPs that have been selectively covalently coupled with fibronectin on the specified side. Experimental values are represented by dots for all tested frequencies whereas fitted functions are represented in dashed lines.
DISCUSSION
Polystyrene functionalized colloids
The physical origin of the shifts of the crossover frequencies comes from the differences of the surface charges density of those particles. is linked to the surface conductance via the ion mobility, . Therefore, following Eqs. 3, 1, the crossover frequency of functionalized PS particles is highly changed by the surface charge density.
Surface conductances of functionalized PS particles are extracted from the explicit form of the real part of the CMF (Eq. 1) fitted to the experimental values. Fitted curves are shown in Figure 2 as plain or dashed lines and the obtained Ks are given in Table TABLE I..
TABLE I.
Experimentally determined surface conductances of 400 nm PS functionalized particles.
| Aldehyde (nS) | Carboxyl (nS) | Carboxylate (nS) | Sulfate(nS) | |
|---|---|---|---|---|
| 1.95 ± 0.12 | 1.28 ± 0.17 | 1.51 ± 0.21 | 1.66 ± 0.11 |
The experimental crossover frequencies are in good agreement with the fits. It can be, however, observed that fits deviates in the curvatures around the crossover frequency, which is the result of overestimation of particles velocities. This clearly shows a limitation of our method based on optical measurements of velocities. Since our fitting method is over a wide range of experimental points, this limitation does not alter the quality of our results.
Although the surface conductances of PS coated particles have not been systematically investigated, carboxylated PS particles have been studied and presented a surface conductance of 1.92 nS31 and 1.2 nS for latex coated particles,32, 33 which is in the range of our measurement.
Particles coated with proteins
When particles present proteins on their surface, a core-shell model on the particle-proteins system is applied, inspired by Morgan.34 The core particles are surrounded by proteins and the medium as presented in Figure 6a. The coated particle is modelled with several layers:
The core particles (1, diameter ) of polystyrene or silica with a surface conductance (2) ,
the shell composed of proteins (2, total diameter , number of layers ),
the medium (3, DI Water).
Figure 6.

Core-shell model for (a): particles functionalized with proteins and (b): Au particles functionalized with thiols and proteins.
The CMF of the particle-protein interface is given by Eq. 9. This factor integrates the thickness of the protein layer that is given by , where 35 is the hydrodynamic radius of fibronectin and the number of protein layers. It also requires the surface conductance of the core particle (plain or carboxylated). The surface conductance of fibronectin has been found in literature to be .36 This interface gives a complex permittivity 8 that is integrated in the final form of the core-shell CMF; given by Eq. 7.
| (7) |
| (8) |
| (9) |
Table TABLE II. shows the parameters used for the fit. The fit parameters are the number of protein layers and their permittivities . The fitted plot according to those experimental results is shown in Figure 3 as full or dashed lines. The obtained value of layer is rounded to the lower full number as presented in Table TABLE III.. Protein relative permittivities seem to be in the same range for all experiments and averages to 2.03 for all particles. This value seems to be lower compared with the typical values reported in the literature.37 However, it is well known that the permittivity of proteins is highly sensitive to temperature, pH, and conformation38, 39 and the grafted proteins on the particles may present a different relative permittivity than the one of a pure solution of proteins. Moreover, our fitting method is based on the surface conductance of fibronectin measured by another and enhancing the precision of this value by other techniques could lead to a higher degree of precision of our measured value. It is also important to pinpoint that the relative permittivities of thick layers were normalized by the number of layer n of proteins for consistency.
TABLE II.
Parameters used to fit the experimental Re(CMF) for PS and particles.
| Particle | (nS) | (nm) | (nS) | ||
|---|---|---|---|---|---|
| PS | 1 | 2.55 | 2.56 | 8 | 4.4 |
| PS-COOH | 1 | 2.55 | 1.51 | 8 | 4.4 |
| 1 | 3.8 | 0.51 | 8 | 4.4 | |
| -COOH | 1 | 3.8 | 1.51 | 8 | 4.4 |
TABLE III.
Extracted number of layers of protein. “X” means the coupling method does not apply with the specified particle.
| Coupling | PS | PS-COOH | -COOH | |
|---|---|---|---|---|
| (Adsorption) | 4 | 27 | 38 | 12 |
| (Covalent coupling) | X | 1 | X | 1 |
| Normalized | 1.99 ± 0.12 | 1.97 ± 0.09 | 2.20 ± 0.21 | 1.99 ± 0.15 |
The number of protein layers adsorbed on a particle is much higher than in the covalent coupling case. For covalent coupling, fits emphasize the creation of a monolayer of protein on the surface of the particle.
Functionalized Au particle
For Au particles with proteins, a multiple core-shell model is applied as illustrated in Figure 6b. The model contains several layers: the Au core particle, the thiols monolayer, the protein layers, and the medium:
the Au core particle (1, diameter ),
the thiols monolayer (2, total diameter ),
the protein layers (3, total diameter , number of layers ),
the medium (4).
The Au-thiol system is modelled in the same way as in Eq. 9, where with the addition of the thiol-protein interface.
Table TABLE IV. shows the parameters used within the fits. The values of parameters for Au particles and the thiols are taken from the work of Zhang and Zhu30 The fit parameters for the experimental CMF were the number of protein layers, and these values are given in Table TABLE V.. A direct relation can be seen between the decrease in the values of the CMF and the number of protein layers on the Au particles. Either by adsorption or covalent coupling, the fewer proteins on the particle, the lower the frequency at which the decrease appears. This may be explained by the screening effect of the proteins on the polarization effect of the Au particle itself. At low frequencies, the proteins seem to shield the field less whereas at high frequencies, only the core Au is responsible for the global DEP response—the proteins do not have any polarization effect at higher frequencies. The value 0.4 reached by all cases seems to be the value of the DEP response of the core Au particle shielded by the proteins. As previously presented, the covalent coupling method seems to produce a monolayer of proteins.
TABLE IV.
Parameters used to fit the experimental Re(CMF) for Au particles. “X” means the value of the parameter does not apply with the specified layer.
| Layer | a (nm) | ε | (nS) | (S/m) |
|---|---|---|---|---|
| Au | 250 | 6.9 | 61.21 | X |
| Thiol | 2 | 2 | X | |
| Protein | 8 | 2.03 | 4.4 | X |
TABLE V.
Extracted number of layer of protein on Au particles. “X” means the coupling method does not apply with the specified particle.
| Coupling | Au | Au-alkylated |
|---|---|---|
| (Adsorption) | 11 | 4 |
| (Covalent coupling) | X | 1 |
Janus particles grafted on one side with proteins
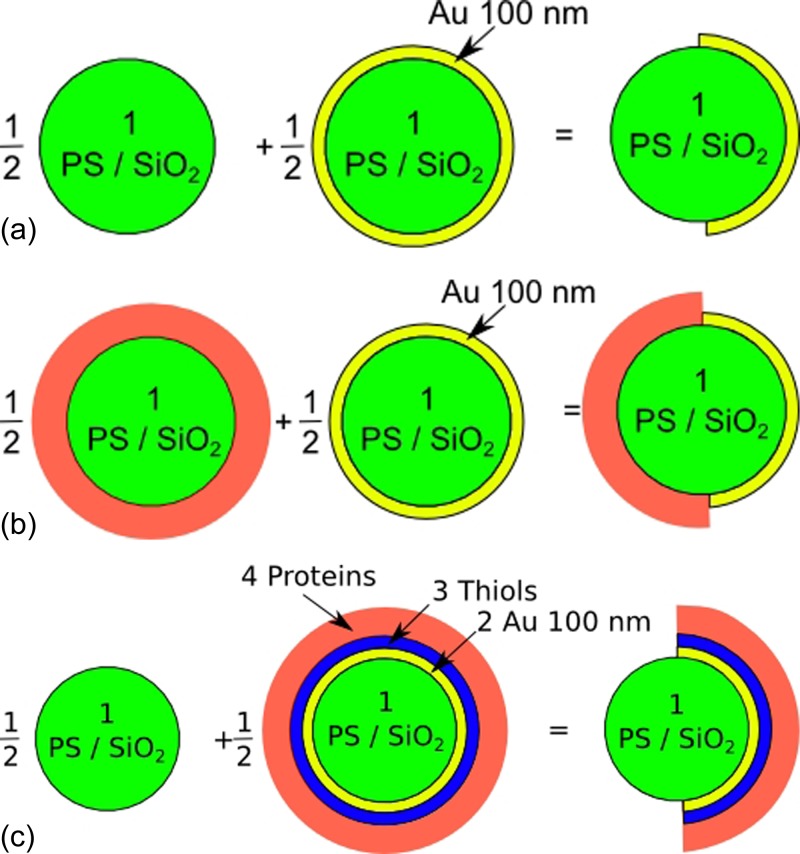
In order to understand the behaviours of each JP, we model the JPs by the same approach presented by Zhang and Zhu30 Each side of the JP is modelled with a multiple shell model according to its different layers. Real parts of the Clausius-Mossotti factor are then summed up and divided by 2. For example, a JP with proteins on the Au side is modelled by summing the contribution of a plain particle and of a multiple shell particle consisting of a plain particle, a layer of thiols, and a multilayer of proteins.
Several JPs have been tested:
Plain Janus particles: 100 nm Au/1 μm PS and 100 nm Au/1 μm ,
Alkylated Janus particles: thiols-Au/PS and thiols-Au/,
Carboxylated Janus particles: Au/PS-COOH and Au/-COOH,
Fibronectin (FN) covalently coupled on the dielectric side of a Janus particle: Au/PS-FN and Au/-FN,
Fibronectin (FN) covalently coupled on the Au side of a Janus particle: FN-Au/PS and FN-Au/.
Figure 7 presents the several tested Janus particles and the corresponding model for calculating their CMF. Fits are performed on the experimental curves with the fitting parameter , the number of protein layers. Plots presented in Figure 5 show the fitted curves obtained with those parameters. The decrease of frequencies (ca. 100 kHz) and plateau values ( and for low frequencies and and for high frequencies) seem to match the behaviours of particles coated with Au and proteins as shown previously. Table TABLE VI. presents the number of protein layers fitted with experimental values.
Figure 7.
Models and expressions used to compute the CMF of Janus particles, (a) plain Janus particles, (b) Janus particles with proteins grafted on their dielectric side (PS or ), and (c) Janus particles with proteins on their Au side.
TABLE VI.
Extracted number of layers of protein on JP particles.
| Au/PS-COOH-Prot | Prot-thiol-Au/PS | -COOH-Prot | Prot-thiol- | |
|---|---|---|---|---|
| 1 | 1 | 1 | 1 |
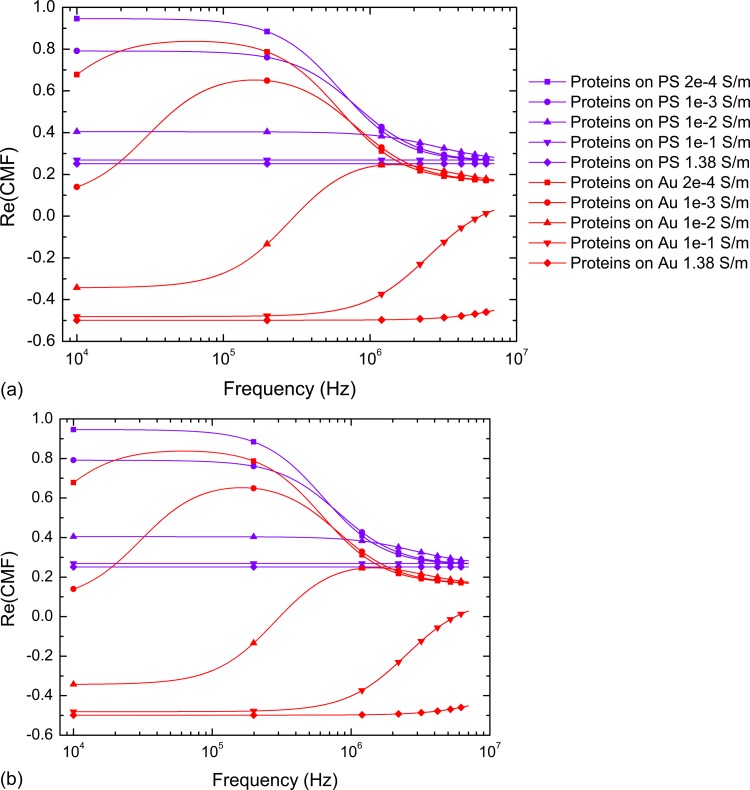
As for full particles, covalent coupling on JPs provides a monolayer of proteins on one side only. The choice of grafting proteins on the or the Au side depends on the targeted application since their DEP responses can significantly change when varying the applied frequency. Moreover, by changing the medium conductivity in which those JPs are suspended, positive to negative responses can be foreseen (CMF for several medium conductivities are presented in Fig. 8), and this duality of behaviours is rarely observed in high conductivity media ().
Figure 8.
Real part of the Clausius-Mossotti factor of several JPs suspended in increasing media conductivities for (a): 1 μm PS/100 nm Au JPs selectively functionalized with fibronectin and (b):1 μm Au particles selectively functionalized with thiols and proteins. An unusual behaviour is predicted in high conductivity medium where JPs could present dual p-DEP and n-DEP motion.
CONCLUSION
We have measured the real part of the CMF of surface charged particles, particles coupled with fibronectin and JPs selectively grafted with fibronectin on one side only. For each type of particle, we have presented single or multiple core shell models with which we fitted the experimental values of the real part of the CMF in order to extract intrinsic parameters from the particle surface: Surface conductances of charged particles, fibronectin relative permittivity, and number of protein layers grafted on the particles. We have demonstrated that a monolayer of protein can be covalently grafted on a particle. The capacity to measure the real part of the CMFs of complex particles will provide a solid basis to tune their DEP response in a given medium (positive only, negative only, or combined) by their surface functionalization only. Moreover, this method can be extended to most polarizable objects. For example, the modulation of the crossover frequency of JPs suspended in high conductivity medium could provide a local sensor for cell adhesion in their high conductivity culture medium.
References
- Przybyla L. M. and Voldman J., Proc. Natl. Acad. Sci. U.S.A. 109, 3264 (2012). 10.1073/pnas.1103100109 [DOI] [PMC free article] [PubMed] [Google Scholar]
- Sund J., Alenius H., Vippola M., Savolainen K., and Puustinen A., ACS Nano 5, 4300 (2011). 10.1021/nn101492k [DOI] [PubMed] [Google Scholar]
- Mansuy-Schlick V., Delage-Mourroux R., Jouvenot M., and Boireau W., Biosens. Bioelectron. 21, 1830 (2006). 10.1016/j.bios.2005.11.021 [DOI] [PubMed] [Google Scholar]
- Wu L. Y., Ross B. M., Hong S., and Lee L. P., Small 6, 503 (2010). 10.1002/smll.200901604 [DOI] [PubMed] [Google Scholar]
- Pethig R., Biomicrofluidics 4, 022811 (2010). 10.1063/1.3456626 [DOI] [PMC free article] [PubMed] [Google Scholar]
- Suzuki M., Yasukawa T., Shiku H., and Matsue T., Langmuir 23, 4088 (2007). 10.1021/la063075a [DOI] [PubMed] [Google Scholar]
- Bartczak D., Muskens O. L., Nitti S., Sanchez-Elsner T., Millar T. M., and Kanaras A. G., Small 8, 122 (2012). 10.1002/smll.201101422 [DOI] [PubMed] [Google Scholar]
- Yap F. L. and Zhang Y., Biosens. Bioelectron. 22, 775 (2007). 10.1016/j.bios.2006.03.016 [DOI] [PubMed] [Google Scholar]
- Honegger T., Berton K., Pinedo-Rivera T., and Peyrade D., Microelectron. Eng. 86, 1401 (2009). 10.1016/j.mee.2008.11.060 [DOI] [Google Scholar]
- Honegger T., Lecarme O., Berton K., and Peyrade D., Microelectron. Eng. 87, 756 (2010). 10.1016/j.mee.2009.11.145 [DOI] [Google Scholar]
- Honegger T., Lecarme O., Berton K., and Peyrade D., J. Vac. Sci. Technol. B 28, C6I14 (2010). 10.1116/1.3502670 [DOI] [Google Scholar]
- Honegger T., Sarla S., Lecarme O., Berton K., Nicolas A., and Peyrade D., Microelectron. Eng. 88, 1852 (2011). 10.1016/j.mee.2010.12.060 [DOI] [Google Scholar]
- Delgado A. V., González-Caballero F., Hunter R. J., Koopal L. K., and Lyklema J., in Elkin 06, International Electrokinetics Conference, 25-29 June, Nancy, France [J. Colloid Interface Sci. 309, 194 (2007)]. 10.1016/j.jcis.2006.12.075 [DOI] [PubMed] [Google Scholar]
- Jimenez M., Arroyo F., Carrique F., and Delgado A., J. Colloid Interface Sci. 316, 836 (2007). 10.1016/j.jcis.2007.07.016 [DOI] [PubMed] [Google Scholar]
- Basuray S., Wei H.-H., and Chang H.-C., Biomicrofluidics 4, 022801 (2010). 10.1063/1.3455720 [DOI] [PMC free article] [PubMed] [Google Scholar]
- O'Konski C., J. Phys. Chem. 64, 605 (1960). 10.1021/j100834a023 [DOI] [Google Scholar]
- Green N. G. and Morgan H., J. Phys. Chem. B 103, 41 (1999). 10.1021/jp9829849 [DOI] [Google Scholar]
- Hughes M. P., Morgan H., and Flynn M. F., J. Colloid Interface Sci. 220, 454 (1999). 10.1006/jcis.1999.6542 [DOI] [PubMed] [Google Scholar]
- Wei M.-T., Junio J., and Ou-Yang H. D., Biomicrofluidics 3, 012003 (2009). 10.1063/1.3058569 [DOI] [PMC free article] [PubMed] [Google Scholar]
- Hong Y., Pyo J.-W., Hyun Baek S., Woo Lee S., Sung Yoon D., No K., and Kim B.-M., Opt. Lett. 35, 2493 (2010). 10.1364/OL.35.002493 [DOI] [PubMed] [Google Scholar]
- Basuray S. and Chang H.-C., Biomicrofluidics 4, 013205 (2010). 10.1063/1.3294575 [DOI] [PMC free article] [PubMed] [Google Scholar]
- Pethig R., Bressler V., Carswell-Crumpton C., Chen Y., Foster-Haje L., Garca-Ojeda M. E., Lee R. S., Lock G. M., Talary M. S., and Tate K. M., Electrophoresis 23, 2057 (2002). [DOI] [PubMed] [Google Scholar]
- Pethig R. and Talary M., IET Nanobiotechnol. 1, 2 (2007). 10.1049/iet-nbt:20060018 [DOI] [PubMed] [Google Scholar]
- Honegger T., Berton K., Picard E., and Peyrade D., Appl. Phys. Lett. 98, 181906 (2011). 10.1063/1.3583441 [DOI] [Google Scholar]
- Ho C.-T., Lin R.-Z., Chang W.-Y., Chang H.-Y., and Liu C.-H., Lab Chip 6, 724 (2006). 10.1039/b602036d [DOI] [PubMed] [Google Scholar]
- Castellanos A., Ramos A., lez A. G., Green N. G., and Morgan H., J. Phys. D: Appl. Phys. 36, 2584 (2003). 10.1088/0022-3727/36/20/023 [DOI] [Google Scholar]
- Kayani A., Zhang C., Khoshmanesh K., Campbell J., Mitchell A., and Kalantar-zadeh K., Electrophoresis 31, 1071 (2010). 10.1002/elps.200900605 [DOI] [PubMed] [Google Scholar]
- He X., Xuan F., Wang K., Yuan Y., and Cheng X., Langmuir 26, 15155 (2010). 10.1021/la1019636 [DOI] [PubMed] [Google Scholar]
- Gierhart B. C., Howitt D. G., Chen S. J., Smith R. L., and Collins S. D., Langmuir 23, 12450 (2007). 10.1021/la701472y [DOI] [PubMed] [Google Scholar]
- Zhang L. and Zhu Y., Appl. Phys. Lett. 96, 141902 (2010). 10.1063/1.3378687 [DOI] [Google Scholar]
- Basuray S. and Chang H.-C., Phys. Rev. E 75, 060501 (2007). 10.1103/PhysRevE.75.060501 [DOI] [PubMed] [Google Scholar]
- Arnold W. M., Schwan H. P., and Zimmermann U., J. Phys. Chem. 91, 5093 (1987). 10.1021/j100303a043 [DOI] [Google Scholar]
- Ermolina I. and Morgan H., J. Colloid Interface Sci. 285, 419 (2005). 10.1016/j.jcis.2004.11.003 [DOI] [PubMed] [Google Scholar]
- Morgan H., Holmes D., and Green N. G., IEE Proc.: Nanobiotechnol. 150, 76 (2003). 10.1049/ip-nbt:20031090 [DOI] [PubMed] [Google Scholar]
- Sjöberg B., Pap S., Österlund E., Österlund K., Vuento M., and Kjems J., Arch. Biochem. Biophys. 255, 347 (1987). 10.1016/0003-9861(87)90402-4 [DOI] [PubMed] [Google Scholar]
- Osaki T., Renner L., Herklotz M., and Werner C., J. Phys. Chem. B 110, 12119 (2006). 10.1021/jp061022w [DOI] [PubMed] [Google Scholar]
- Mellor B. L., Cruz Cortes E., Busath D. D., and Mazzeo B. A., J. Phys. Chem. B 115, 2205 (2011). 10.1021/jp1111873 [DOI] [PubMed] [Google Scholar]
- Schutz C. N. and Warshel A., Proteins 44, 400 (2001). 10.1002/prot.1106 [DOI] [PubMed] [Google Scholar]
- Pitera J. W., Falta M., and van Gunsteren W. F., Biophys. J. 80, 2546 (2001). 10.1016/S0006-3495(01)76226-1 [DOI] [PMC free article] [PubMed] [Google Scholar]


