Abstract
A planar microfluidic system with contractions and obstacles is characterized in terms of anisotropic flow resistance due to viscoelastic effects. The working mechanism is illustrated using streak photography, while the diodicity performance is quantified by pressure drop measurements. The point of maximum performance is found to occur at relatively low elasticity levels, with diodicity around 3.5. Based on a previously published numerical work [Ejlebjerg et al., Appl. Phys. Lett. 100, 234102 (2012)], 2D simulations of the FENE-CR differential constitutive model are also presented, but limited reproducibility and uncertainties of the experimental data prevent a direct comparison at low elasticity, where the flow is essentially two-dimensional.
INTRODUCTION
Lab-on-a-chip systems can be applied for analysis and separation purposes1, 2 with reduction in cost, analysis time, and sample volumes as major advantages compared to conventional laboratory methods.3 Micropumps can be used in lab-on-a-chip systems, but the lack of robust valves on the microscale is a critical limitation. In fact, the smallest experimentally realized pumps rely on passive valves, which are quite leaky in the sense that the resistance only differs slightly between the two flow directions. This anisotropic flow resistance is due to inertial effects,4 but it is well-known that inertial effects decrease when devices are scaled down, making this mechanism a questionable candidate for a pump on the microscale. Many working fluids, however, contain large flexible molecules, e.g., biological fluids or polymers, and these can give rise to viscoelastic properties. Therefore, leaky valves/rectifiers relying on viscoelastic effects have been suggested,5, 6, 7 as this working mechanism not only survives, when the valve is scaled down, but also gives rise to significantly higher diodicity,8 and thus, potentially larger flow rates. The working mechanism is related to elastic instabilities, which can also be used in the context of micromixing.9
The effect of combining a contraction with an obstacle has been investigated for rectifiers of the inertial type,8 but experimental characterization of viscoelastic rectifiers have been limited to variations of the contraction shape only.5, 6, 7, 10 Recent theoretical optimization and modelling suggests that a contraction-obstacle design could be advantageous for viscoelastic rectifiers in the regime of moderate elasticity,11 and this constitutes the motivation for the present work. In this work, we aim to compare simulations with experiments using only a differential pressure sensor12 and a syringe pump, as opposed to determining the full stress field using a more complex birefringence set-up.13
EXPERIMENTAL SETUP
An overview of the main experimental equipment used is presented in Table TABLE I., including the syringe pump for imposing flow rates and details on the set-up used for streak photography.
TABLE I.
List of equipment used excluding tubing and most equipment used for fabrication.
| Manufacturer | Product | Description |
|---|---|---|
| Cetoni | neMESYS | Syringe pump |
| Hamilton | 1 ml | Syringe |
| National Instruments | 6218-USB | Data acquisition board |
| Honeywell | 1 psi, 26PC series | Differential pressure sensor |
| Leica Microsystems | DMI 5000M | Inverted microscope |
| Leica Microsystems | HCX APO L | Objective (10×/NA = 0.25) |
| Leica Microsystems | DFC350 FX | Monochrome digital camera |
| Leica Microsystems | Excitation BP 530–545 nm | Filter cube |
| Molecular probes | Nile red, Invitrogen, Ex/Em: 520/580 nm | Fluorescent micro-particles |
| Sigma-Aldrich | Sodium dodecyl sulfate | Surfactant |
| Precision tips | ID-OD: 0.41-0.71 mm (blue, for connection) | |
| ID-OD: 0.51-0.81 mm (purple, for punching holes) | ||
| Lascar Electronics | PSU 206 5–15 V | DC power supply |
| Leica Microsystems | HBO 100 | 100 W Mercury lamp for streak photography |
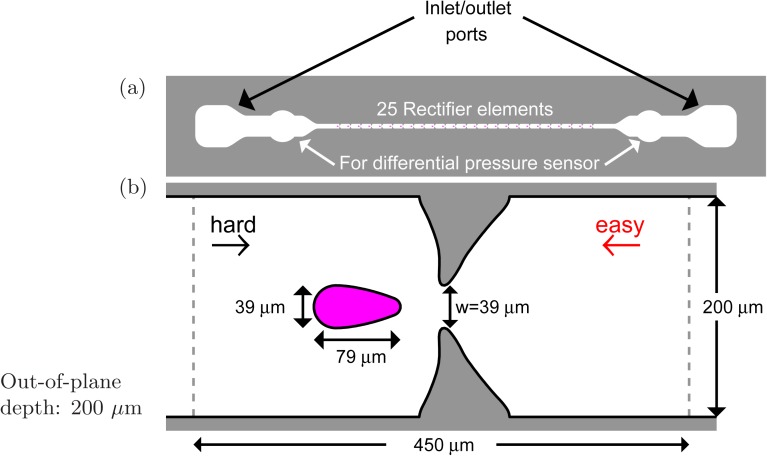
We employ standard soft lithography techniques for fabrication14 of the polydimethylsiloxane (PDMS) microchannels illustrated in Figure 1. The contraction and obstacle widths15 are 39 μm, while the element length is 450 μm and the out-of-plane channel depth is 200 μm. To minimize inlet/outlet effects, the microchannels consist of 25 repeated elements with inlet/outlet as well as pressure ports at each side.12 We also fabricated smaller microchannels, by a factor of two, but significant blockage problems made characterization of these channels impossible.
Figure 1.
Microchannel overall view, including connections for the pressure sensor as well as inlet/outlet ports (a). The dimensions of the contraction-obstacle geometry are shown in (b). The out-of-plane channel depth is 200 μm.
Robustness and resistance towards blocking are often highlighted features of passive over active valves, but channel blocking has actually been a significant difficulty for data reproducibility in the present work. If viscoelastic rectifiers are to be applied in an experimental micro pumping setup, it is therefore worth emphasizing the importance of clean and well mixed fluids as well as the use of fabrication techniques which do not introduce PDMS residue.
For the pressure drop measurements, we use a 1 psi differential pressure sensor from Honeywell (calibration with a water column showed that the output voltage of the 1 psi pressure sensor was linear at least up to 2 psi, without damage to the sensor). The limited sensitivity of this pressure transducer requires a fluid with a minute polymer concentration to allow for characterization in the regime of low elasticity. Consequently, we use an aqueous solution of 50 ppm polyacrylamide (PAA) with a molecular weight of (Polysciences). To prevent shear thinning and blocking, we add 1 wt. % NaCl and 0.1 wt. % sodium dodecyl sulfate (SDS), respectively. Neglecting the effect of SDS, this fluid has a relaxation time of , and the shear viscosity varies by less than 2% for shear rates in the range , as measured with a capillary break-up extensional rheometer (CaBER) and parallel plate shear rheometer, respectively.16
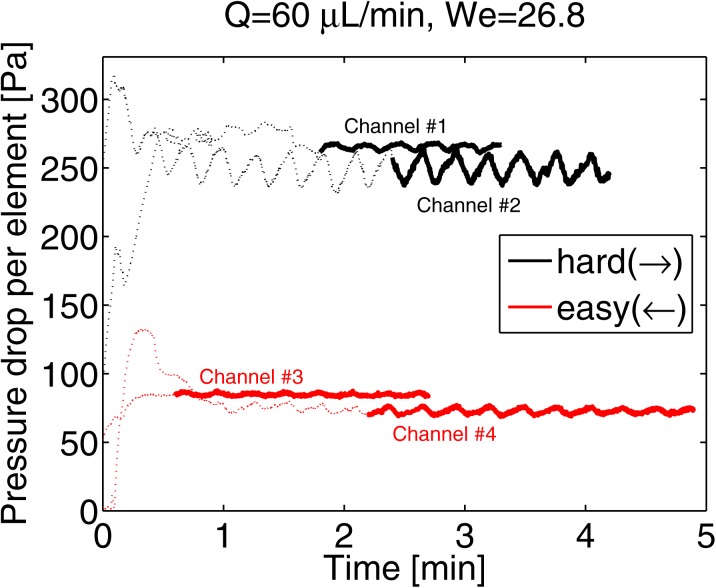
The data of typical experiments are shown in Figure 2. Based on observations through an optical microscope, we attribute the difference between experiments at identical flow conditions to partial channel blocking. The amplitude of the pressure drop oscillations increases with the flow rate, and the frequency is proportional to the flow rate. The proportionality factor corresponds to 16.6 μl per oscillation, which is in good agreement with 16.7 μl computed from a 4.61 mm inner syringe diameter and a 1 mm screw pitch, as used in the experimental set-up. We thus conclude that the syringe pump has an imperfection, such that each flow rate oscillation period corresponds to the time elapsed during one full revolution of the pump screw. The variation of oscillation amplitude for identical flow conditions probably arises because the imperfection is a non-linear function of the pump position (the syringe fluid volume). Alternatively, the syringe pressure can play a role, as this does not reflect the differential pressure, if the outlet tube is partially blocked.
Figure 2.
Measured pressure drop as a function of time for four experiments, two in each flow direction. The thick curves correspond to the data used to calculate averaged values. Oscillations in the sensor signal with a period much longer than fluid relaxation time occur, but the effect of blocking exceeds the error related to the averaging of these oscillations.
NUMERICAL SIMULATIONS
We perform 2D simulations with the FENE-CR model given by
| (1) |
| (2) |
| (3) |
| (4) |
where v is the velocity vector, p is the pressure, is the polymer extra-stress tensor, is the conformation tensor, h is the channel depth (200 μm), λ is relaxation time, is the maximum to equilibrium polymer extensibility, while and are the solvent and polymer viscosities, respectively. The elastic component of the fluid is modelled as an ensemble of point mass pairs connected by a non-linear spring, “dumbbells.” The dumbbell end-to-end vector, a, is related to the conformation tensor, , such that
where is the statistical average and is the equilibrium dumbbell extension. Consequently the conformation tensor trace, , is as a measure of the statistical average of the squared dumbbell extension, , normalized with the squared equilibrium extension.
The numerical solution of Eqs. 1, 2, 3, 4 was described in a previous work,11 where a slightly different geometry was studied in the absence of the force . The FENE-CR model has a constant shear viscosity, and this means that it is possible to use an extra damping term to account for the effect of the third dimension, also called the shallow channel approximation. The channel depth and width are equal, so it is a rather crude approximation, but it is an efficient way of introducing extra shear effects without performing a full three dimensional calculation. The simulations were performed with 439k degrees of freedom, and they indicate a particular working mechanism in the regime of low to moderate elasticity as illustrated in Figure 3: In the obstacle wake, a birefringent strand of elongated polymer dumbbells appears [Figures 3b, 3d], which is particularly elongated in the hard flow configuration due both to the small curvature of the obstacle trailing edge and the accelerating nature of the flow due to the contraction. Figure 3a shows that the normal stresses generated this way give rise to a damping, which creates a local minimum in the flow velocity at the center of the line connecting the contraction tips. This does not happen for the opposite flow direction [see Figures 3c, 3d].
Figure 3.

The working mechanism of the contraction-obstacle design as simulated by a 2D periodic and pressure driven FENE-CR model using , and (based on the easy flow direction, see Sec. 4). The damping from the microchannel floor and ceiling is described with a shallow channel approximation. The velocity (a) and (c) as well as the trace of conformation tensor (b) and (d) are plotted for both flow directions. The predicted flow rate ratio is . The simulations were performed with 439k degrees of freedom with enhanced resolution at the obstacle separation points.
RESULTS
The Weissenberg number describes the ratio of elastic and viscous effects, with the Newtonian regime characterized by numbers much smaller than unity. For our geometry,
| (5) |
where λ is the relaxation time of the fluid (), while the average flow velocity, , divided by a characteristic length scale, , defines a characteristic shear rate. In accordance with related experiments,6 we use the flow rate Q, to calculate the average velocity at the contraction and select the half contraction width, w/2 = 19 μm, as a characteristic length scale. This definition is applied for experimental and simulated data, but the simulations are pressure driven, so interpolation is used to estimate driving pressures at equal flow rates. Non-Newtonian fluids are usually better characterized using a spectrum of relaxation times, and the CaBER tends to detect the longer relaxation times in this spectrum, but these do not necessarily dominate in our geometry, and therefore, the estimation of the Weissenberg number is not straightforward in practice.
The relevance of flow inertia can be quantified by the Reynolds number
| (6) |
where ρ is the solution density (), and is the total viscosity ().
SDS was added in order to minimize progressive blocking due to small pieces of PDMS residue [see Figure 4a] at the cost of more frequent blocking with large pieces of PDMS, as shown in Figure 4b. The severity of the first blocking issue is possibly due to the separation point of the obstacle, but blocking issues with larger pieces of PDMS have also been observed in contraction geometries. These large pieces are created as a consequence of hole punching with a hollow needle in the microchannel preparation, and it is thus possible that the blocking issue can be reduced by means of an alternative hole production technique.
Figure 4.

Small pieces of PDMS would give rise to progressive blocking around the obstacle (a). This problem could be eliminated by adding the surfactant SDS to the solution, but this procedure amplified the blocking of large PDMS pieces (b). The images were acquired in different microscopes, hence the overall qualitative difference.
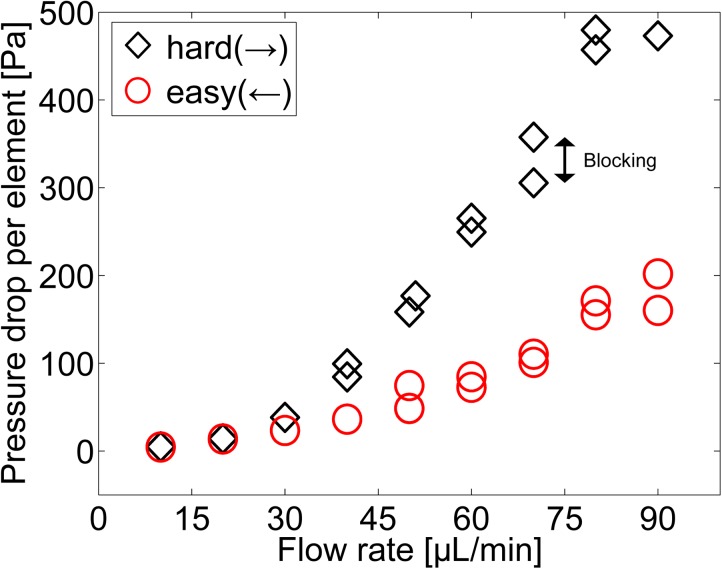
Blocking seems to occur faster for large flow rates and therefore experiments were usually performed starting from small flow rates as to avoid early channel blocking of the severe kind that makes further characterization impossible. We show repeated pressure drop measurements for the same flow rate in Figure 5 to illustrate the problem of more moderate blocking. The pressure drop is similar for the two flow directions up to a flow rate of about 30 μl/min. Above this point, the hard flow direction breaks of, while the easy flow direction continues to exhibit a quasi linear increase of pressure drop up to 50 μl/min and even then the increase of the slope is more modest.
Figure 5.
Pressure drop per element as function of the flow rate for the two flow directions. The effect of blocking is illustrated by repeated measurements at the same flow rate indicating that the effect of the flow direction dominates. Altogether the figure represents data from seven microchannels, but around 70 channels were fabricated and tested in total.
The diodicity is defined in terms of the driving pressure ratio at a given flow rate
| (7) |
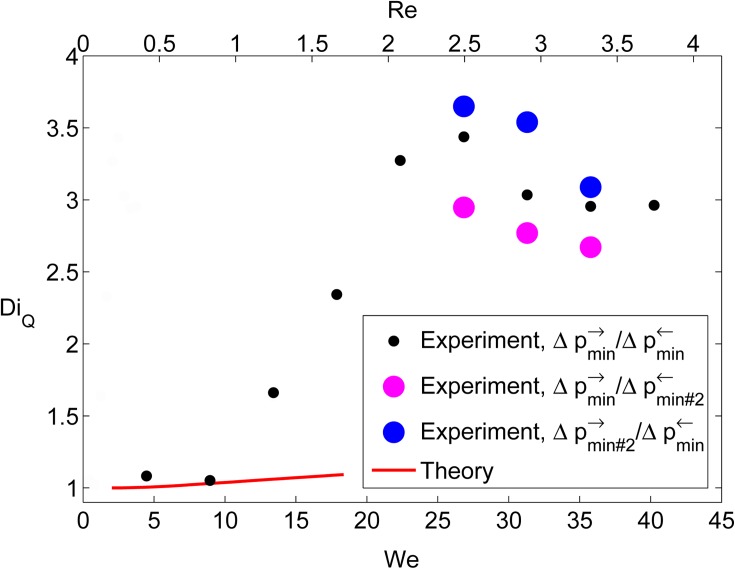
We use the minimum pressure drops (corresponding to the least blocked experiment) to calculate the experimental diodicity for each flow rate. We plot the diodicity for both experiments and simulations17 versus the Weissenberg number as well as the Reynolds number in Figure 6. In order to quantify the degree of experimental reproducibility, we calculate diodicities based on the second lowest measured pressures, , for the flow rates in the 60–80 μl/min range. The experimental diodicity increases significantly at , while the curve for the simulations increases much slower. The experimental reproducibility is around for the diodicities in the 60–80 μl/min flow rate regime.
Figure 6.
The driving pressure ratio is plotted versus the Weissenberg number indicating a maximum of 3.5 at . The simulations reach a diodicity of 1.09 at a Weissenberg number of 18.4. The diodicities calculated using the second lowest measured pressures, , indicate an experimental reproducibility of for the diodicity.
The discrepancy between simulations and experiments is not surprising in the sense that experiments show a significant pressure drop enhancement in contraction geometries,18 but closed-form differential viscoelastic models are currently unable to predict this basic phenomenon. Furthermore it is not until recently that the 3D viscoelastic flow at We = 2 has been computed in a simple benchmark geometry.19 The presented simulations assume 2D flow, but early transition to 3D for flow around obstacles is known experimentally20 as well as theoretically.19 We thus hypothesize that the lack of agreement between theory and experiment can be partially attributed to the onset of a 3D flow structure above and/or the inability of the viscoelastic model to adequately predict the pressure drop enhancement in contraction flows.
The maximum diodicity of 3.5 is a factor of two smaller than what has been reported for hyperbolic contractions with large aspect ratios,7 but one should remember that this geometry is optimized for the regime of moderate elasticity, and it is thus worth emphasizing that the maximum occurs for a Weissenberg number of just 27, instead of around 70. Small aspect ratio hyperbolic rectifiers have similar peak diodicities, and these reach their maximum for , but in this context, the uncertainty of the relaxation time should be kept in mind.
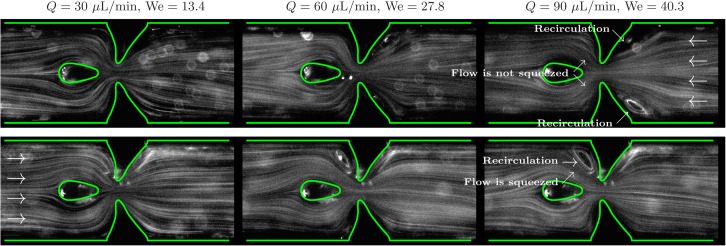
We investigate the working mechanism using streak photography, as shown in Figure 7. As typical for viscoelastic fluid flow, recirculation zones form on the upstream side of the contraction and these squeeze the flow to the sides of the obstacle in the case of the hard flow direction. The fact that the recirculation occurs on the upstream side indicates that elastic effects indeed are dominant, in agreement with the fact that the elasticity number, El = We/Re, is around 11 indicating a relatively high ratio of elastic over inertial stresses.21 In the theoretical optimizations,11 the diodicity was attributed to the strand of elongated polymers in the obstacle wake, but we are unable to see this effect experimentally, as it would require the use of birefringence techniques.
Figure 7.
Flow patterns for the easy (top) and hard (bottom) flow directions at different flow rates. Upstream recirculation zones form for flow rates Q = 60 and 90 μl/min.
A break down of the rectifier diodicity for larger Weissenberg numbers is not captured in the experimental data. Instead, the diodicity seems to reach a plateau around 3, which could be due to the fact that the breakdown mechanism involves obstacle to obstacle and/or contraction to contraction interaction similar to what happens at higher Weissenberg numbers for the hyperbolic rectifiers. At least this kind of mechanism could require very large Weissenberg numbers, because of the relatively large length of periodicity. Asymmetric flow patterns are clearly documented by the streak photography in Figure 7, so strong asymmetric flow patterns for both directions is another likely candidate for the break down mechanism, but further experiments at higher flow rates are required in order to investigate this important performance aspect. Note that such experiments might call for the combination of a larger channel with a fluid having a longer relaxation time.
One might expect that the flow of a Newtonian fluid at large Reynolds numbers could look similar to what is observed here, and for this reason the investigated geometry might perform well for Newtonian fluids as well. The working mechanism would however be different from previous contraction-obstacle rectifiers,8 in the sense that it relies on contraction/expansion recirculations rather than obstacle vortices due to the streamlined obstacle employed in this work. This means that the hard and easy directions would be switched around compared to the viscoelastic case, as also observed in triangular rectifiers.5
CONCLUSIONS
We successfully characterized a viscoelastic rectifier with a contraction-obstacle design and found a maximum diodicity of 3.5 at a Weissenberg number of 27, which is a verification of previous simulations11 in the sense that these predicted the design to be optimal at moderate elasticity. Streak photography illustrated that the working mechanism can be attributed to elastic recirculations upstream of the contraction. Finally, the geometry has a potentially broad operating regime as the experimental data indicates a broad flow rate range of high diodicity.
ACKNOWLEDGMENTS
The authors would like to acknowledge the Otto Mønsted foundation and FCT, COMPETE, and FEDER through project PTDC/EME-MFE/114322/2009 for financial support to this work.
References
- Yang R., Hou H., Wang Y., Lin C., and Fu L., Biomicrofluidics 6, 034110 (2012). 10.1063/1.4739073 [DOI] [PMC free article] [PubMed] [Google Scholar]
- Hou H., Gan H., Bhagat A., Li L., Lim C., and Han J., Biomicrofluidics 6, 024115 (2012). 10.1063/1.4710992 [DOI] [PMC free article] [PubMed] [Google Scholar]
- Whitesides G., Nature 442, 368 (2006). 10.1038/nature05058 [DOI] [PubMed] [Google Scholar]
- Stemme E. and Stemme G., Sens. Actuators, A 39, 159 (1993). 10.1016/0924-4247(93)80213-Z [DOI] [Google Scholar]
- Groisman A. and Quake S., Phys. Rev. Lett. 92, 94501 (2004). 10.1103/PhysRevLett.92.094501 [DOI] [PubMed] [Google Scholar]
- Sousa P., Pinho F., Oliveira M., and Alves M., J. Non-Newtonian Fluid Mech. 165, 652 (2010). 10.1016/j.jnnfm.2010.03.005 [DOI] [Google Scholar]
- Sousa P., Pinho F., Oliveira M., and Alves M., RSC Adv. 2, 920 (2012). 10.1039/c1ra00803j [DOI] [Google Scholar]
- Tsai C., Lin C., Fu L., and Chen H., Biomicrofluidics 6, 024108 (2012). 10.1063/1.4704504 [DOI] [PMC free article] [PubMed] [Google Scholar]
- Lam Y., Gan H., Nguyen N., and Lie H., Biomicrofluidics 3, 014106 (2009). 10.1063/1.3108462 [DOI] [PMC free article] [PubMed] [Google Scholar]
- Nguyen N., Lam Y., Ho S., and Low C., Biomicrofluidics 2, 034101 (2008). 10.1063/1.2959099 [DOI] [PMC free article] [PubMed] [Google Scholar]
- Ejlebjerg Jensen K., Szabo P., and Okkels F., Appl. Phys. Lett. 100, 234102 (2012). 10.1063/1.4728108 [DOI] [Google Scholar]
- Cheung P., Toda-Peters K., and Shen A., Biomicrofluidics 6, 026501 (2012). 10.1063/1.4720394 [DOI] [PMC free article] [PubMed] [Google Scholar]
- Baaijens F., Selen S., Baaijens H., Peters G., and Meijer H., J. Non-Newtonian Fluid Mech. 68, 173 (1997). 10.1016/S0377-0257(96)01519-4 [DOI] [Google Scholar]
- Xia Y. and Whitesides G., Ann. Rev. Mater. Sci. 28, 153 (1998). 10.1146/annurev.matsci.28.1.153 [DOI] [Google Scholar]
- See supplementary material at http://dx.doi.org/10.1063/1.4769781 for an exact description of the geometry.
- Campo-Deaño L., Galindo-Rosales F., Pinho F., Alves M., and Oliveira M., J. Non-Newtonian Fluid Mech. 166, 1286 (2011). 10.1016/j.jnnfm.2011.08.006 [DOI] [Google Scholar]
- and were selected as parameter values.
- Rothstein J. and McKinley G., J. Non-Newtonian Fluid Mech. 86, 61 (1999). 10.1016/S0377-0257(98)00202-X [DOI] [Google Scholar]
- Sahin M., in 17th International Workshop on Numerical Methods for Non-Newtonian Flows, Blois, France, 25–28 March 2012.
- McKinley G., Armstrong R., and Brown R., Philos. Trans. R. Soc. London, Ser. A 344, 265 (1993). 10.1098/rsta.1993.0091 [DOI] [Google Scholar]
- Sousa P., Pinho F., Oliveira M., and Alves M., Biomicrofluidics 5, 014108 (2011). 10.1063/1.3567888 [DOI] [PMC free article] [PubMed] [Google Scholar]


