

Abstract
Background
Glioblastoma multiforme (GBM), high-grade glioma, is characterized by being diffuse, invasive, and highly angiogenic, and has a very poor prognosis. Identification of new biomarkers could help in the further diagnosis of GBM.
Objective
To identify ELTD1 ([epidermal growth factor (EGF), latrophilin and seven transmembrane domain-containing 1] on chromosome 1) as a putative glioma-associated marker via a bioinformatic method.
Methods
We used advanced data mining and a novel bioinformatics method to predict ELTD1 as a potential novel biomarker that is associated with gliomas. Validation was done with immunohistochemistry (IHC), which was used to detect levels of ELTD1 in human high-grade gliomas, and rat F98 glioma tumors. In vivo levels of ELTD1 in rat F98 gliomas were assessed using molecular MRI (mMRI).
Results
ELTD1 was found to be significantly higher (P=.03) in high-grade gliomas (50 patients) compared to low-grade gliomas (21 patients), and compared well to traditional IHC markers including VEGF, GLUT-1,CAIX, and HIF-1α. ELTD1 gene expression indicates an association with grade, survival across grade, and an increase in the mesenchymal subtype. Significantly high (P<0.001) in vivo levels of ELTD1 were additionally found in F98 tumors, compared to normal brain tissue.
Conclusion
This study strongly suggests that associative analysis was able to accurately identify ELTD1 as a putative glioma-associated biomarker. The detection of ELTD1 was also validated in both rodent and human gliomas, and may serve as an additional biomarker for gliomas in pre-clinical and clinical diagnosis of gliomas.
Keywords: ELTD1, gliomas, glioblastoma multiforme (GBM), immunohistochemistry (IHC), rat F98 glioma model, molecular MRI
Introduction
Gliomas represent 40% of all primary central nervous system (CNS) tumors diagnosed. Among them, glioblastomas (GBM) are the most malignant, with a very poor survival time of about 15 months for most patients diagnosed with this tumor1. High-grade gliomas are the most common primary brain tumors in adults, and their malignant nature ranks them highly regarding cause of cancer death1. Grading and identification criteria that can be used to provide information regarding tumor behavior include cell proliferation (cellularity and mitotic activity), nuclear atypia, neovascularization, and the presence of necrosis and/or apoptotic regions2,3. Differences in molecular composition between tissue types or ‘biomarkers’ can be used diagnostically to classify tumors and assess prognosis. Molecular markers have increasingly been used to assess and manage adult malignant gliomas2,4-8. The most useful are markers that can predict response to certain therapies and guide clinical decisions. The most recent biomarkers are from genome-wide surveys associating somatic mutations with risk of glioma development. Molecular biomarkers most commonly used to evaluate adult malignant gliomas from biopsies include 1p/19q co-deletion, methylation of the O-6 methylguanine-DNA methyltransferase (MGMT) gene promoter, alterations in the epidermal growth factor receptor (EGFR) pathway, and isocitrate dehydrogenase 1 (IDH1) and IDH2 gene mutations2,4-9. Dozens of proteomics-based approaches have sought to find proteins that are unique to gliomas10, but have been severely limited by issues of sample size, ability to detect low abundance proteins, and reproducibility. Many of these studies have generated hundreds and even thousands of putative candidates, yet have not been able to follow them up with subsequent validation and characterization.
Via a bioinformatics method developed in our group,11-14 we conducted a global meta-analysis of approximately 18,000 microarray experiments from the National Center for Biotechnology Information (NCBI's) database to identify gene sets consistently co-expressed together across heterogeneous conditions. After identifying these gene sets, an automated, large-scale analysis of the peer-reviewed literature was conducted12,13, to identify genes that are consistently transcribed with established glioma-related genes, but which have themselves never been associated with gliomas in the literature. This process was used to identify ELTD1 ([epidermal growth factor (EGF), latrophilin and seven transmembrane domain-containing 1] on chromosome 1) as a novel gene that may be an important biomarker for the confirmation and detection of gliomas.
ELTD1 is not well characterized. Based upon its sequence, ELTD1 is a member of the secretin family of G-protein-coupled peptide hormone receptors and belongs to the epidermal growth factor-seven-transmembrane (EGF-TM7) subfamiliy15. Structurally, it contains a large extracellular domain with EGF-like repeats, a seven-transmembrane domain, and a short cytoplasmic tail15. ELTD1 was first identified to be developmentally regulated in rat fetal and postnatal cardiomyocytes15. ELTD1 has also been identified with its ligand dermatan sulfate in rheumatoid synovial tissue within rheumatoid arthritis patients14. In more obscure roles, variations in ELTD1 have been associated as a risk factor for cannabis use disorders17,18, tick burden in cattle19, and subcutaneous fat thickness20. Of more importance to cancer, ELTD1 has been associated as an endothelial marker in microvasculature21. Our goal in this study was to determine whether or not ELTD1 could be used as a marker for glioma-related processes, and use immunohistochemistry (IHC) and molecular magnetic resonance imaging (MRI) to validate its presence in human and rodent gliomas.
MRI is becoming one of the most commonly used techniques to provide information on brain tumor growth, vasculature, biochemical metabolism, and molecular changes in preclinical models, as MRI is the optimal imaging tool used in the diagnostic process for human gliomas22. Molecular alterations can be assessed with the use of targeting MR contrast agents, which can specifically indicate levels of cancer biomarkers that may be elevated in malignant tumors22. The development of targeted imaging ligands attached to MRI contrast agents allows the in vivo evaluation of tumor biology, such as tumor cell apoptosis, angiogenic blood vessels, or the expression of specific tumor antigens or signaling pathways23. Molecular imaging involves the coupling of a targeting moiety (antibody or peptide targeted to a protein of interest) to a reporter molecule (e.g. MRI contrast agent). Commonly used MRI contrast agents are gadolinium (Gd)-based compounds, or iron oxide-based nanoparticles.
In this study we identified ELTD1 as a putative glioma-associated marker via a bioinformatic method, and experimentally validated its presence in both rodent and human gliomas via IHC and molecular MRI analyses in a F98 rodent glioma model. For IHC, ELTD1 was compared to traditional IHC markers for human gliomas including VEGF (vascular endothelial growth factor), GLUT-1 (glucose transporter 1), CAIX (carbonic anhydrase IX), and HIF-1α (hypoxia inducible factor-1α). ELTD1 expression in human gliomas was also evaluated from gene expression databases (Rembrandt, Erasmus, and TCGA) to establish if this biomarker is differentially expressed in varying glioma grades.
Methods
Immunohistochemistry
The human tissue sample portion of the study was conducted in compliance with the University of Utah Health Sciences Center Institutional Review Board. For IHC analysis, glioblastomas (GBM), anaplastic astrocytomas (AA), and anaplastic oligodendrogliomas (AO) (high-grade gliomas; 50 patients: 21 female, and 29 male; 40 GBM; 6 AA; 4 AO) were compared to tumors classified as low-grade gliomas (21 patients: 10 female, and 11 male; 11 oligodendrogliomas; 10 low-grade astrocytomas (LGA)), including benign oligodendrogliomas, and LGA. Antibodies (Abs) to ELTD1 were available commercially ([human specific Abs all used for IHC: all are rabbit polyclonal anti-human Abs; (1) CLS-C40639; LifeSpan BioSciences, Inc., Seattle, WA, USA; (2) NBP1-84775; Novus Biologicals, Novus USA, Littleton, CO, USA; and PA1-32729; Thermo Fisher Scientific Inc., Rockford, IL, USA; all human Abs were assessed and found to provide similar results; dilution was 1:500], and [rodent Ab (specific for both mouse and rat; recommended use for IHC and Western blotting): ETL (N-20): sc-46951; goat polyclonal anti-mouse (peptide mapping near the N-terminus of ETL); Santa Cruz Biotechnology, Inc., Santa Cruz, CA, USA; dilution was 1:100]). A lack of cross-reactivity between human and rodent Abs is illustrated in supplementary Ab data (Supplementary Content 1). A toluidine blue (0.1%) counter-stain was used (15 sec). For human tissues, IHC was performed using the Vectastain ABC Kit (Vector Laboratories). Negative controls were performed by replacing the primary Ab with nonimmune serum. Slides were examined using an Olympus BX41 Microscope. Under 200× (10 ocular × 20 objective) magnification, slides were scored by two investigators blinded to the specimen tumor grade or patient information. A score of 0–4 (0=0–25%, 1=25–50%, 2=50–75%, 3=75–100%, 4=100%) was assigned based on the number of cells stained in a given field. In prior papers we have demonstrated that this method was very reproducible as demonstrated by good inter-rater reliability (p=0.99, 95% CI (0.99-1.00)) and intra-rater reliability (p=0.96, 95% CI (0.92-0.99)).24 Each investigator reviewed the slide at low power and at random high power fields independently from the other investigator when determining the IHC score. Positive expression was considered for scores of 2-4, whereas negative expression was considered for scores of 0 and 1.
For the rat F98 glioma tissues, IHC fluorescence staining was done for the endothelial cell marker, CD31 (FITC-labeled donkey anti-mouse antibody). For ELTD1, a secondary antibody (Cy3 labeled donkey anti-goat; Jackson) was used to detect the anti-ELTD1 antibody in the anti-ELTD1 probe. Rat brains were extracted after the 3-hour mMRI protocol; the tumor side and contralateral side of the brain were cut and fixed in Z-fixative (Zinc Formalin: Formaldehyde 3.7%, Zinc Sulfate). The tissue was then washed with PBS and incubated with 15% sucrose before embedding in an Optimal Cutting Temperature (O.C.T.) compound and freezing in liquid nitrogen. The cryosections were then stained with a secondary antibody (Cy3 (blue)-labeled donkey anti-goat (Jackson ImmunoResearch, Suffolk, England)) to target the anti-ELTD1 (ETL) antibody, and a FITC (red)-labeled donkey anti-mouse antibody to target the anti-CD31 (CD31; mouse monoclonal anti-rat; Dako Denmark, Glostrup, Denmark) antibody, within the brain tissue. The nucleus was stained with DAPI (blue). Stained tissue slices were examined with a Nikon C1 confocal laser scanning microscope (Nikon Instruments, USA). Co-localization analysis was done using an Imaris Coloc module (Imaris vers. 6.4), and data were presented as percentage co-localization, and the Pearson co-localization coefficient25.
Rat glioma cell implantation
The rat portion of the study was conducted in compliance with the OMRF Institutional Animal Care and Use Committee. The rat glioma cell implantation model was conducted as previously described by our group26. Briefly, three-month-old male Fischer 344 rats (Harlan Inc., Indianapolis, IN) were anesthetized and immobilized on a stereotaxic unit. A hole was drilled through the skull at 2 mm anterior and 2 mm lateral to the bregma, on the right-hand side of the skull. 10,000 F98 cells suspended in a 10 μl volume were injected at a depth of 3 mm from the dura into the cerebral cortex, at a rate of 2 μl/min, followed by a waiting time of 2 min. The F98 cells were originally obtained from the ATCC (Manassas, VA, USA), passaged once, and then infected with a modified pMMP retrovirus fused with the coding sequences for luciferase and hygromycin (pMMP-LucHygro; obtained from Dr. Stephen Lessnick, University of Utah, Huntsman Cancer Institute). They were selected for hygromycin resistance and colonies screened for luciferase expression. Stocks were frozen one passage after infection and colony screening. Cells were also found to have no mycoplasma infection (Hoechst dye (33258) nuclear (DNA) staining detection kit; Roche Diagnostics, Indianapolis, IN, USA).
Synthesis of ELTD1 nanoprobes
The dextran-coated NH2 base iron oxide nanoparticles construct underwent conjugation with an ELTD1-specific Ab using a protocol previously reported by our group26, via the formation of a stable thioether linkage between the activated PEG-NP and activated Ab. The Ab is activated with SATA (N-succinimidyl-S-acetylthioacetate) to introduce a sufhydryl group26. The amine groups were activated with SPDP (N-succinimidyl 3-(2-pyridyldithio)-propionate.
MRI experiments
In vivo MR experiments on rats with F98 gliomas were carried out under general anaesthesia (12% Isoflurane, 0.8-1.0 L/min O2). MR equipment used was a Bruker Biospec 7.0 Tesla/30 cm horizontal-bore imaging spectrometer (Bruker BioSpin MRI Gmbh, Germany). Animals were imaged at 7-10 days after the cells were injected and then every 2-3 days until the desired volume of the tumor (75-150 mm3). Anaesthetised (2% Isoflurane) restrained rats were placed in a MR probe, and their brains localised by MRI. Images were obtained using a Bruker S116 gradient coil (2.0 mT/m/A), a 72 mm quadrature multi-rung RF coil for RF transmission, and a rat head coil for RF signal receiving. MRI was performed for the purpose of determining the incidence, number, growth rate, and volume of each tumor for the F98 gliomas. Multiple 1H-MR image slices were taken in the transverse plane using a spin echo multislice (SEMS; repetition time (TR) 0.8 s, echo time (TE) 23 ms, 128 × 128 matrix, 4 steps per acquisition, 4 × 5 cm2 field of view, 1 mm slice thickness)26-28.
For determination of T2* values of the IO nanoprobes in gliomas, a multiple gradient echo (MGE) method was used with the following parameters: TE (first echo)=4 msec, echo spacing of 4 ms TR=1500 msec, 10 echoes (TE= 4, 11, 18, 25, 32, 39, 46, 53, 60, 67 msec), 2 coronal (horizontal) slices, number of averages (NA)=2, matrix=256×256, slice thickness=1mm; with a spatial resolution of 0.137 mm/pixel; and an estimated total scan time of 10min. T2* maps were generated from the multi-echo data sets. Rat brains were imaged at 0 (pre-nanoprobe (CLIO anti-ELTD1 nanoprobe) or pre-contrast agent (control CLIO-IgG) administration), 10 min intervals post-nanoprobe or IgG contrast agent injections for up to 3 hours. Rats were injected with a single dose intravenously (i.v.) via a tail vein catheter with either the anti-ELTD1 nanoprobe (anti-ELTD1 antibodies (goat anti-mouse) tagged with an IO-based contrast agent (CLIO-based) (200 μl/200 g rat; 1mg antibody/kg; 0.05 mmol Fe+3/kg)), or the normal rat IgG control contrast agent (same dose as anti-ELTD1 nanoprobe).
Multiple regions-of-interest (ROIs) (10 ROIs within each of tumor and non-tumor tissues) were selected (in various representative tumor and corresponding contralateral non-tumor regions by two operators with inter-observer agreement) from T2-weighted images and T2* maps to calculate relative changes in MR signal intensities and T2 values in F98 glioma bearing rats administered either the CLIO-anti-ELTD1 nanoprobe (n=3) or the CLIO-IgG contrast agent (n=2). MR angiography images were obtained as previously described28.
MRI Analysis
A Mathematica based T2* program was used to crop the data/matrix to an area of interest, and it then fits each pixel of a designated image slice to the T2* relation: I = a + Io * Exp[TE/T2*]; where ‘a’ is a constant determined by the FindFit function of Mathematica, ‘I’ is the intensity at time ‘t’, ‘Io’ is the signal intensity at time 0, TE is the set of defined echo times, and T2* is the parameter of interest. The FindFit function of Mathematica optimizes the values not explicitly defined to produce the best possible fit. This method is applied to both the pre and post contrast images. The percent difference is then taken from the fitted data/matrix using the following equation: % difference= [(after-before)/before]*100. ArrayPlot graphical images are produced for the original cropped image, the fitted pre and post contrast image, and the % difference of the fitted images. A contour plot is made using the % difference data to highlight the regions where the greatest intensity change occurred. The contour plot is then overlaid on the original cropped imaged to provide a more visual display of where changes in signal intensity occurred.
Prussian blue staining of the nanoprobes
Detection of the iron oxide-based nanoprobes in tissue cryosections was done using Prussian blue staining, which involves the treatment of sections with acid solutions of ferrocyanides. The ferric ion (+3) present in the iron oxide-based nanoprobes from tissue sections combines with the ferrocyanide and results in the formation of ferric ferrocyanide, visible as a blue pigment in bright field imaging. Stained tissue slices were viewed and photographed with a Nikon Eclipse 800 microscope (Nikon Instruments, USA).
Gene expression analysis
For the glioblastoma expression microarray analysis, raw Affymetric .cel files were downloaded for the TCGA (National Cancer Institute (NCI) The Cancer Genome Atlas; www.cancergenome.nih.gov/; 529 GBM samples), Rembrandt (NCI Repository for Molecular Brain Neoplasia Data; www.rembrandt.nci.nih.gov/; 229 total astrocytomas, of which 151 are GBM), and Erasmus (NCBI Gene Expression Omnibus; GEO Series GSE16011; total of 187 astrocytomas, of which 159 are GBM), as well as the corresponding clinical annotations for each. The .cel files were then processed using R and Bioconductor, using a custom CDF (custom chip definition files), with background correction, log transformation, and quantile normalization performed using the RMA (robust multi-array average) algorithm implemented in R.
For mesenchymal and proneural gene signature definition, we used a composite of signatures from Phillips et al. (2006)29 and Verhaak et al. (2010)30. For a given tumor, the metagene mesenchymal and proneuiral signature score were both calculated. Within a dataset, the mesenchymal and proneural metascores were z-score corrected to allow comparison between the two. Tumors were then assigned to one of the signatures based on the higher expressing metagene.
Western blot
Frozen tissue was weighed, 200 mg thawed in 1 ml RBC lysis buffer (Sigma, R7757) with protease inhibitors (Sigma, p8340), Na3V04 (1 mM), DTT (dithiothreitol; 1 mM) and PMSF (phenylmethanesulfonyl fluoride; 1 mM), then diced using surgical micro-scissors. Tissue was centrifuged at 1500 rpm, supernatant removed and 500 ul lysis buffer containing proteases and phosphatase inhibitors added. Tissues were homogenized with a rotor-stator at 4°C for 1 minute, incubated on ice for 30 min. with shaking, then centrifuged (42,000μg, 20 min., 4°C). The clear supernatant was transferred to a clean 1.5 ml tube. After determining the total protein concentrations, 40 ug total protein was separated by SDS-PAGE (sodium dodecyl sulfate polyacrylamide gel electrophoresis) using a Novex 4-12% gel (Invitrogen, Carlsbad, CA, USA), and transferred to PVDF (polyvinylidene difluoride) membranes. Western analysis was done using antibodies against ELTD1 (ETL (N-20): sc46951; Santa Cruz Biotechnology Inc., Santa Cruz, CA, USA). Secondary antibodies were labeled with horseradish peroxidase. The Supersignal West Pico chemiluminescent substrate kit (Thermo Scientific, #34077) was used for detection.
Statistical Analyses
Statistical differences in MR signal intensities and T2* relaxations, which indicated specific binding of the nanoprobes in glioma tissue, were analyzed between the treatment and control groups, and between tumor and non-tumor regions, with an unpaired, two-tailed Student t test using commercially available software (InStat; GraphPad Software, San Diego, CA, USA). A p value of less than .05 was considered to indicate a statistically significant difference. For IHC scoring and ELTD1 expression, statistical differences were compared between groups using the Welch two-sample t-test (unpaired, ‘two-sided’), with p-values <0.05 considered to be significant.
Results
Bioinformatics
A global microarray meta-analysis (GAMMA) of all genes differentially expressed across 3,651 human 2-color microarray experiments was conducted as previously described11 to identify gene-gene co-expression patterns that were consistent and specific across heterogeneous microarray experiments. The significance and reproducibility of the GAMMA predictions from the 2-color array data have since been corroborated by normalization31 and meta-analysis of 16,000 additional 1-color human microarrays32. This “guilt by association” approach identifies gene sets that are likely to be associated in biologically relevant ways such as phenotype, disease and genetic network. GAMMA has been used successfully to identify the mitotic role of a formerly uncharacterized gene called C13ORF3 (now Ska3)33, a role in coagulation for C6ORF105 (now ADTRP)34, and to identify OLFM4 as a novel neutrophil subset marker associated with granule secretion35.
With the GAMMA approach, genes are not analyzed directly, but the top 20 genes most consistently co-expressed with them are analyzed for what they have in common in the peer-reviewed literature using a large-scale computational analysis12,14. This way, even if a protein has no known function, its function can be inferred. Then, using the Human Proteome Reference Database (HPRD)34 and other experimental sources on protein cellular localizations, we screened this list of predicted glioma-associated proteins for those that were extracellular or membrane-bound, because these proteins were thought to be ideal targets for molecular imaging probes and targeting therapies since they are more likely to be accessible to injected antibodies. Using our procedure, we identified membrane-bound proteins that have not yet been associated with gliomas, but whose expression consistently correlates with genes reported to be associated with gliomas. This circumvents a problem inherent in the lists of expressed genes derived by microarrays, which identify only those genes that are being actively transcribed at the time of the experiment without detecting proteins that are present but not actively transcribed. That is, GAMMA associates genes frequently co-transcribed regardless of the condition, and then if a statistically significant set of genes has been reported as glioma-associated in the literature, these associations need not be transcriptional to be identified by GAMMA (e.g., they could be from proteomics or GWAS studies). The enormous sample size of both microarray data and analyzed abstracts enables us to screen out genes that do not pass a threshold of statistical significance. This associative method works for glioma-derived literature-based associations as well as searches on associated processes (such as angiogenesis, apoptosis, or cell migration), helping corroborate any putative roles in tumorigenesis that we uncover. For each association we calculate mutual information (a measure of variable dependency) between literature terms to prioritize the strength of association between each protein and a role in gliomas14. Finally, we obtained increased confidence in the predictions because GAMMA also successfully predicted many established glioma-related genes (e.g. EGFR (epidermal growth factor receptor), MMP2 (matrix metalloprotein-ase-2), GFAP (glial fibrillary acidic protein), FGF2 (fibroblast growth factor 2)). These identifications serve as positive controls for predictive capacity. We identified 195 putative candidate markers, all genes predicted or known to be membrane-bound and not appearing in any MEDLINE article that mentioned gliomas (or synonymous terms). Of these 195, only 75 had commercial antibodies. ELTD1 was chosen from among this list of 75 because it had the highest score. With this analysis set to stringent thresholds, we have empirically observed that the ELTD1 gene is found to be consistently transcribed with known glioma-associated genes (see supplementary data in Supplementary Content 2).
GAMMA scores are based on a combination of (1) how many genes out of the 20 top co-expressed analyzed genes showed associations with gliomas based on published reports, and (2) their statistical significance based on random network simulations to estimate the probability that a set of equally frequent terms would associate with gliomas. Only proteins with p < 0.01 were selected as potential candidates. A flow diagram of the GAMMA approach is illustrated in supplementary data (Supplementary Content 3).
Immunohistochemistry and Western blot
From human IHC assessment, ELTD1 was expressed in all gliomas, where it was found to have an average IHC score of 2.7 (±1.16) or >67% expressed in high-grade gliomas (HG E), and an average IHC score of 2.05 (±1.07) in low-grade gliomas or >33% expressed (LG E) (Fig. 1), the difference being statistically significant (P=.03). Percent survival for the GBM, AA and AO patients was 0.0, 0.0 and 50.0%, respectively. Percent survival for benign oligodendroglioma and LGA patients was 27.3 and 70.0%, respectively.
Figure 1.

ELTD1 levels are higher in high-grade (HG) gliomas compared to low-grade (LG) gliomas. (A) Average IHC scores for biomarkers (vascular endothelial growth factor (VEGF), hypoxia inducible factor 1-α (HIF-1α), glucose transporter-1 (GLUT-1), carbonic anhydrase IX (CAIX), brevican, or ELTD1) in high-grade gliomas (50 patients; 21 female, and 29 male) and low-grade gliomas (21 patients; 10 female, and 11 male). Scores were obtained using the following grading criteria: 0: 0%; 1: 0 to <25%; 2: 25 to <50%; 3: 50 to <75%; 4: 75-100% detection of IHC stain. (B) Percent patients that express biomarkers stained by IHC in high-grade gliomas (50 patients) and low-grade gliomas (21 patients). A negative expression (NE) result was attributed to IHC scores of 0 or 1. A positive expression (E) result was attributed to IHC scores of 2-4. Significant differences in marker levels between HG and LG was established when *P<0.05 or **P<0.01.
ELTD1 compared well to known glioma biomarkers, including VEGF (vascular endothelial growth factor), HIF-1α (hypoxia-inducible factor 1α), GLUT-1 (glucose transporter 1) or CAIX (carbonic anhydrase IX). The IHC average score for ELTD1 in high-grade gliomas was slightly lower than average IHC scores for VEGF, HIF-1α, GLUT-1 and CAIX (Fig 1A). In low-grade gliomas, ELTD1 had an IHC score that was less than those for VEGF, HIF-1α and CAIX (Fig. 1A). Although the recently discovered glioma marker, Brevican, had 68% expression levels in high-grade glioma patients (Fig. 1B), it was found to be the lowest for all biomarkers tested (Fig. 1A). Brevican and the biomarker CAIX were not found to be significantly higher (P=.19 for both) when comparing high-grade to low-grade gliomas, whereas all other biomarkers (VEGF, HIF-1α, and GLUT-1 had P=.01, P=.02, and P=0.001, respectively), including ELTD1 (P=.03), were significantly higher in high-grade compared to low-grade gliomas (Fig. 1A).
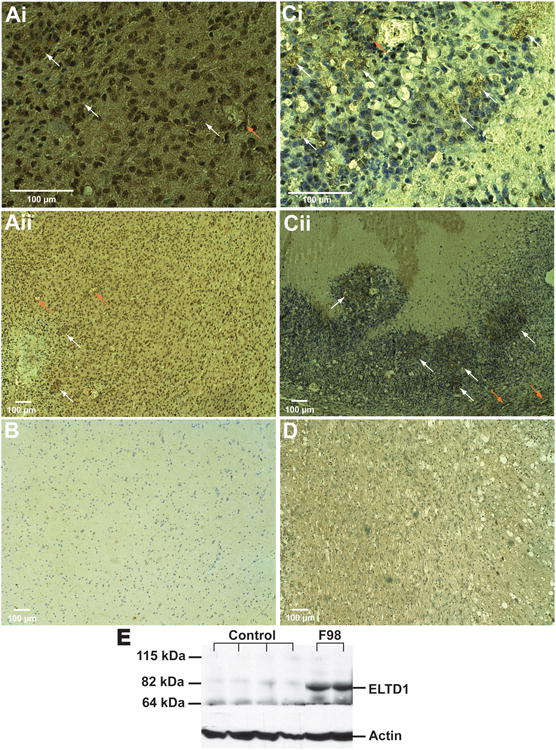
Figures 2A and B depicts representative IHC staining for ELTD1 in human GBM and control brain tissues, respectively, indicating that GBM (Fig. 2A) had substantially higher levels (including both vascular and glioma cells). Figures 2C and D show representative IHC staining for ELTD1 in a rat F98 glioma model compared to contralateral brain tissue, respectively, with higher levels detected in glioma tissue (including both vascular and glioma cells) vs. contralateral brain tissue (Fig. 2D). Figure 2E is a representative Western blot of ELTD1 levels obtained from rat F98 glioma tissues (two right lanes), compared to normal rat brains (four left lanes), illustrating high levels of ELTD1 in tumor tissues.
Figure 2.

ELTD1 levels are elevated in GBM and F98 rat gliomas. (A and B) Representative IHC staining for ELTD1 in a GBM (Ai: 40× magnification; Aii: 10× magnification) and a normal (B; 10 magnification) human brain tissue. (C and D) Representative IHC staining for ELTD1 in a rat F98 glioma (Ci: 40× magnification; Cii: 10× magnification) and contralateral brain (D; 10× magnification) tissues. Magnification bars for 100 μm are depicted on each image. White arrows indicate positive staining for ELTD1 predominantly in glioma tissue, and orange arrows indicate staining of ELTD1 associated with endothelial cells. (E) Western blot for ELTD1 (85 kDa) obtained from rat F98 gliomas (F98) (two right lanes) and normal (Control) brain (four left lanes) tissues, illustrating high levels of ELTD1 in tumors.
Molecular MRI
With the use of mMRI and iron oxide-based nanoprobes, in vivo ELTD1 levels were detected in rat F98 gliomas (see Fig. 3). The ELTD1 probe was a dextran-coated iron oxide construct with an anti-ELTD1 antibody coupled to the dextran (Fig. 3A). A representative T2* difference image overlaid on top of a T2-weighted morphological MR image is shown in Fig. 3B. A corresponding MR angiography image and its' difference image (2 hours post administration of the ELTD1 probe minus before injection of the probe) is shown in Figs. 3C and D, respectively. Note the high signal intensity within the tumor region (see Fig. 3B for morphological T2-weighted image). The percent change in T2* differences is shown dynamically within representative animals in Fig. 3E, where only the glioma region from a F98-glioma-bearing rat administered the ELTD1 probe had high % T2* differences (12-14%), compared to the contralateral region (6-8%) in the same animal, or the tumor or contralateral regions of a F98-glioma-bearing rat that was administered the non-specific IgG probe (<6%). Corresponding quantitative T2* differences in the tumor region of F98-glioma-bearing tumors is shown in Fig. 3F (where a T2* difference of 87.4439.95 in a F98 tumor administered the ELTD1 probe (n=3 F98 glioma-bearing rats, n=10 sample regions/rat, i.e. 30 sampling regions in total) was significantly higher (∼3-fold, P<0.001) than that measured in the tumor region of the non-specific IgG control which was 26.87±35.48 (n=2 F98 glioma bearing rats, n=10 sample regions/rat, i.e. 20 sampling regions in total)).
Figure 3.

In vivo levels of ELTD1 are elevated in F98 rat gliomas, as determined by mMR imaging following administration of an anti-ELTD1 probe. (A) Illustration depicting the general design of the anti-ELTD1 SPIO-based probe used for in vivo molecular imaging, consisting of dextran-coated SPIO nanoparticles with amine functional groups for the conjugation of an anti-ELTD1 antibody. (B) Horizontal image depicting regions (red) where probe accumulation was highest (obtained from T2* maps; glioma region outlined in gray dotted line). (C) 3D MR angiogram within the brain of a F98 glioma-bearing rat prior to administration of the anti-ELTD probe. Outlined region depicts cropped image region in panel B. (D) MR angiogram difference image (post-anti-ELTD1 probe (180 min) – pre-administration) following administration (via i.v. tail-vein catheter) of anti-ELTD1-SPIO probe. Note middle cerebral artery with SPIO-based probe darkening of vasculature 3 hours following probe administration. Outlined region depicts cropped image region in panel B. Elliptical regions depict darkened regions due to presence of ELTD1 probe. (E) Probe kinetics as determined by measuring % T2* differences in glioma and contralateral brain tissues within F98 glioma-bearing rats administered either the ELTD1 nanoprobe or an IgG- SPIO contrast agent. (F) Histogram of T2* differences in the tumor regions of F98 glioma-bearing rats administered either the ELTD1 probe (n=3, 10 ROIs, i.e. 30 samples) or the non-specific IgG contrast agent (n=2, 10 ROIs, i.e. 20 samples). The T2* difference was found to be statistically higher in the tumor region of the F98 tumor administered the ELTD1 probe, compared to the IgG contrast agent.
Confirmation of the presence of the iron oxide-based anti-ELTD1 nanoprobes in a F98 glioma-bearing animal (Fig. 4A; T2-weighted MR image) is shown in Fig. 4Bi and ii. Low levels of the iron oxide particles are also detected in the contralateral brain tissue of an animal administered the ELTD1 probe (Fig. 4Ci and ii), as well as less probe within the glioma (Fig. 4E; also see Fig. 3F) or contralateral (Fig. 4F) brain tissues of a F98 glioma-bearing animal (Fig. 4D; T2-weighted MR image) administered the IgG contrast agent.
Figure 4.

Prussian blue staining confirmation for the presence of the ELTD1 probe in F98 gliomas. Depiction of Prussian blue staining for iron oxide nanoparticles in F98 rat gliomas administered either the ELTD1 probe (A; T2-weighted MR image)) in glioma (Bi and Bii) or contralateral (Ci and Cii) brain tissues, or the non-specific IgG contrast agent (D; T2-weighted MR image) in tumor (E) or contralateral (F) brain tissues, 5 hours following administration of contrast agents. High magnification (×100).
To establish if ELTD1 was predominantly an endothelial-associated marker, excised F98 glioma and contralateral brain tissues exposed to the anti-ELTD1 probe were fluorescently labeled with an anti-CD31 antibody (targeted with a FITC-labeled secondary antibody), and a secondary Cy3-labeled antibody against the anti-ELTD1 antibody used in the anti-ELTD1 probe (Fig. 5). Co-localization images indicate that ELTD1 co-localized predominantly with endothelial cells (CD31) (yellow = red (CD31) + green (ELTD1); Fig. 5 Bi and Ci; highlighted rectangular regions). Co-localization analysis indicated that the Pearson co-localization coefficients were 0.8089 (1.0000 would be 100% co-localization) (Bii) and 0.7929 (Ci) for ELTD1 and CD31 in glioma tissue, indicating a high association of ELTD1 with endothelial cells. There is also some evidence that indicates the slight presence of ELTD1 surrounding glioma cells that did not co-localize with CD31 (Fig. 5Ci and iv; highlighted circle in Fig. 5Ci). Contralateral brain tissue also had low levels of ELTD1 that co-localized with CD31 (Fig. 5Ai, highlighted regions; Pearson co-localization coefficient of 0.7149).
Figure 5.
ELTD1 is strongly associated with endothelial cells. Fluorescence staining for CD31 (red; iii) and the ELTD1 probe (green; iv) in (A) Contralateral brain tissue and (B,C) glioma tissue, 3 hours following administration of the anti-ELTD1 probe in a F98-glioma bearing rat. (i) Co-localization of CD31 and ELTD1 (yellow) indicate that most of the ELTD1 is endothelial-cell associated (highlighted in rectangular regions), however low levels are also detected surrounding glioma cells (Ci; highlighted in a circular region). Co-localization analysis images are shown in (ii), where the Pearson coefficients for ELTD1 and CD31were 0.8089 (Bii) and 0.7929 (Ci) in glioma tissue, and 0.7149 (Aii) in contralateral brain tissue. (C) Enlarged image (2 × zoomed image) of the glioma tissue. Nuclei are stained with Dapi (blue). Magnification ×60. Magnification bars in (Ai, Bi and Ci) are 50, 80 and 70 μm, respectively.
Gene expression analysis
A number of large public gene expression databases including multiple types and grades of gliomas have been established, including Erasmus, Rembrandt, and more recently TCGA (GBM only). In order to determine whether mRNA levels of ELTD1 were related to glioma grade, survival, or tumor gene expression subtype, we performed analyses of data from these databases (as described in Methods above). In the two databases that included different grades of gliomas (WHO II-IV), there was a very significant association of increased ELTD1 expression with higher grade (Fig. 6). In addition, an analysis of survival using the Rembrandt database demonstrated that increased ELTD1 expression was associated with worse survival across glioma grades (ELTD1-Rembrandt-Survival supplementary data in Supplementary Content 4. Analysis of survival within GBM tumors from these databases did not demonstrate significant survival association within grade IV tumors. However, we did find that when we analyzed ELTD1 expression as a function of tumor gene expression subtype30 within grade IV tumors, there was a potential association of higher ELTD1 expression in the mesenchymal versus proneural subtype, which was significant in the Rembrandt dataset and showed a trend in the TCGA data set (Fig. 7). Taken together, these data indicate that ELTD1 is potentially a strong biomarker of glioma grade and survival, and may be preferentially associated with the mesenchymal subtype of GBM.
Figure 6.

Increased ELTD1 expression is associated with higher grade in gliomas in both Rembrandt and Erasmus gene expression databases. ELTD1 expression was found to be significantly higher in grade IV gliomas, compared to grade II gliomas in both Rembrandt (p=7.6e-8) and Erasmus (p=0.0003) datasets. ELTD1 was found to be significantly higher in grade IV vs. grade III in the Rembrandt data (p=9.4e-9), and higher in grade III gliomas vs. grade II in the Erasmus data (p=0.004).
Figure 7.

Increased ELTD1 expression is associated with mesenchymal (mes) phenotype in GBM (compared to the pro neural (pn) subtype), as determined from the TCGA (accessed 2/7/2012; mes =275 and pn = 254) and Rembrandt (accessed 5/9/2011; mes = 70 and pn = 55) gene expression databases. There was no significant differences in ELTD1 expression between mes and pn in the TCGA database (p=0.6154), however there was a significant increase in the mes subtype (compared to the pn subtype) in the Rembrandt database (p=0.0005). For statistical analysis a Welch's two sample t-test was used.
Discussion
We have demonstrated that the differential presence of ELTD1 in gliomas as compared to non-diseased regions could potentially serve alone or in combination with other glioma-specific biomarkers, as it is detected in both human GBM and rodent models for gliomas. Despite current therapies, GBM is a devastating cancer, and the validation of more biomarkers for GBM could be beneficial in the diagnosis and therapeutic intervention of this disease. ELTD1, as shown in our human IHC data (Figs. 1 and 2), fares well in comparison to more traditional IHC markers currently used to diagnose GBM. IHC staining in human high-grade (HG) gliomas (GBM + AA + AO) and low-grade (LG) gliomas (LGA + benign oligodendrogliomas) indicated higher levels of ELTD1 for HG compared to LG gliomas. The level of ELTD1 was similar to currently investigated glioma markers including VEGF, HIF-1α, and GLUT-1 . It is well known that HIF-1α is an important diagnostic marker and can be targeted for therapeutic intervention24,37-43. ELTD1 also can be detected in an aggressive rodent model for gliomas. Within a rat F98 glioma model, ELTD1 levels from IHC assessment were found to be higher in glioma tissue; however, the contralateral tissue seemed to still have some staining for ELTD1 (Fig. 2C and Fig. 5A). Western blot data indicate high levels of ELTD1 compared to normal rat brain (Fig. 2E). Lower levels of ELTD1 in normal brain tissue may be due to decreased vasculature (compared to a tumor). Human normal brain tissue had very low ELTD1 levels (Fig. 2B) compared to extremely high levels in a GBM patient (Fig. 2A).
Pre-clinical glioma models, induced by orthotopic (into native tumor sites) injection of primary tumor cells or tumor cell lines, represent the most frequently used in vivo cancer model systems for glioma research23,44. F98 glioma cell lines were obtained from chemical induction as a result of administering ethylnitrosourea (ENU) to pregnant rats, where the progeny developed brain tumors that were isolated, and propagated and cloned in cell culture45. F98 gliomas are classified as anaplastic malignant tumors, which have an infiltrative pattern of growth, which is an attribute associated with human GBM45,46. MRI techniques have been used in our group to demonstrate the aggressive nature of F98 gliomas. With the use of diffusion tensor imaging, we were able to demonstrate that the F98 glioma model is much more infiltrative than the rat C6 glioma model47. With the use of MR angiography, we have shown that the F98 model predominantly uses pre-existing blood vessels in tumor angiogenesis, but has longer and thicker new blood vessels compared to other glioma models48.
In this study within the F98 glioma model, we were also able to demonstrate, with the use of mMRI and an anti-ELTD1 probe, that substantial levels of ELTD1 are found in the tumor tissue of F98 glioma-bearing animals. ELTD1 was only found to be in high levels within glioma tissue with a ∼4-fold increase compared to contralateral brain tissue (Fig. 3F). A decrease in T2 relaxation would indicate the presence of the anti-ELTD1 probe, which would be indicative of the presence of ELTD1. Co-localization images staining for ELTD1 and CD31, and subsequent analysis, indicated that most of the ELTD1 detected by fluorescence confocal imaging was associated with endothelial cells (Fig. 5). There is also some indication that ELTD1 may be expressed on some glioma cells at much lower levels. Therefore, any increase in ELTD1 will, more than likely, be associated with increased angiogenesis or neovascularization in gliomas. Decreased levels of ELTD1 in glioma cells compared to high levels in tumor vasculature from the in vivo data may reflect either predominant uptake by the endothelial cells before they reach the glioma cells, or decreased uptake of the anti-ELTD1 probe in tumor tissue. IHC staining (Fig. 2) indicates ELTD1 staining in tumor cell nuclei as well as around endothelial cells, indicating that the in vivo targeting may be restricted to the distribution of the probe to endothelial cells and only some tumor cells. Prussian blue staining for the anti-ELTD1 probe (Fig. 4) seems to indicate intravascular staining based on the well individualized pattern and distinct shapes, which could indicate an endothelial association and limited distribution of the probe to these cells. However, previous studies using the same probe construct to assess in vivo c-Met28 or VEGFR226 levels in rat gliomas do not indicate that these probes only reach vascular cells, but do reach glioma cells, which would suggest that the ELTD1 probe has a preferred association for endothelial cells. In order to confirm ELTD1 expression with vascular endothelial cells, future experiments may also need to evaluate the levels of ELTD1 in association with the inhibition of neovascularization using anti-angiogenic therapies (e.g. Avastin or sunitinib). Additionally, verification of ELTD1 expression in neoplastic cells should be done, such as assessing EGFR (epidermal growth factor receptor) gene amplification by fluorescence in situ hybridization (FISH) co-localization with ELTD1-expressed cells.
It is interesting to note that the Human Protein Atlas shows very little positive staining for ELTD1 in malignant gliomas, but strong antibody staining for other cancers, such as thyroid cancer and malignant melanoma (http:///www.proteinatlas.org/ENSG00000162618/cancer; accessed 07/24/12). This database is ideal for the initial determination of general expression levels of a particular protein that could indicate further study. However, more extensive studies, as we have done with the use of IHC staining for ELTD1 in numerous patient samples and in vivo expression levels of ELTD1 in a pre-clinical model, strongly suggest that malignant gliomas do have high levels of ELTD1. Also of noteworthy mention, according to SymAtlas (http://biogps.org/#goto=genereport&id=170757; accessed 07/24/12), ELTD1 mRNA expression seems to be highest in hematopoetic stem cell (HSC), as well as lung and common myeloid progenitor tissues. Whether HSCs are the source of neovascularization that we observe in gliomas would have to be further investigated.
From the gene expression results, we have also demonstrated that there was a strong association of ELTD1 expression with increasing grade (Fig. 6). This results in a strong survival association when you compare data across all grades (ELTD1-Survival supplementary data). However, there was not a survival association with expression level within GBM, suggesting that it is mainly a biomarker of grade. Alternatively, when we looked at GBM tumor subtype, it looked like there was a possible association with the Mesenchymal subtype versus the pro neural subtype that was significant in Rembrandt, but not in TCGA (Fig. 7). It is reasonable to conclude that ELTD1 expression is a strong biomarker of grade (also supported by the IHC data), associated with survival across grade, and may be increased in the mesenchymal subtype. ELTD1 expression and associated survival should, in the future, be evaluated by IHC via a glioma tissue microarray to confirm survival differences observed in Rembrandt.
Others have previously used mMRI to also assess neovascularization. For example, the expression of cell adhesion molecules, such as integrins, has been found to be up-regulated during tumor growth and angiogenesis, and αVβ3 expression, which has been correlated with tumor aggressiveness, can be measured by MRI with targeted paramagnetic-labeled cyclic arginine-glycine-aspartic acid (RGD) peptides23,49. In another study, within U87MG xenograft tumors in nude mice, RGD-labeled ultrasmall superparamagnetic iron oxide (USPIO) probes were found to accumulate only within the neovasculature associated with tumors, and not within tumor cells50. Tumor angiogenesis was also monitored via the expression of CD105 in F98 tumor-bearing rats with the use of Gd-DTPA liposomes targeted to CD105 (CD105-Gd-SLs) and MR imaging51.
In our laboratories, MR imaging probes (either Gd- or iron oxide-based) have also been developed to monitor in vivo levels of molecular markers known to be over-expressed in malignant brain tumors, such as the angiogenic marker VEGF-R2 (vascular endothelial growth factor receptor 2)26,52; the tumor cell migration/invasion marker c-Met, a tyrosine kinase receptor for the scatter factor (also known as the hepatocyte growth factor)27,28; and the inflammatory marker inducible nitric oxide synthase (iNOS)53. With the use of a Gd-DTPA-albumin-anti-VEGFR2-biotin probe, regional differences in VEGFR2 levels were detected by MRI in vivo in a C6 glioma model, and probe-specificity for glioma tissue, particularly in the peri-tumor and peri-necrotic regions, was confirmed by tagging the biotin moiety of the probe in excised tissues with streptavidin-Cy352. The control non-specific probe had rat IgG conjugated to the albumin, instead of the VEGFR2 antibody. A similar result was obtained when an aminated dextran-coated iron-oxide nanoparticles conjugated with an anti-VEGFR2 antibody was used in a C6 glioma model, where distribution of the probe was mainly in the peri-tumor and peri-necrotic regions of the tumor26. Confirmation of the presence of the nanoprobes was obtained by using Prussian blue stain for the VEGFR2-targeting iron oxide nanoparticles in excised tumor tissues26. Both Gd- and iron oxide-based probes were also developed to characterize c-Met levels in C6 gliomas. c-Met is a tumor marker that is over-expressed in many malignant cancers, indicative of the invasive nature of a tumor. The distribution of c-Met was found to be more widely dispersed, but mainly concentrated in peri-tumor regions27,28. As detected with a Gd-DTPA-albumin-anti-iNOS-biotin (anti-iNOS) probe, iNOS levels were found to vary in different rat glioma models, where percent MRI signal intensity changes were highest in the C6 tumor compared to the RG2 and ENU-induced tumors53. Dynamic kinetic monitoring of the anti-iNOS probe indicated sustained uptake over 3 hours within tumor tissue regions, and no specific uptake of a control Gd-DTPA-albumin-IgG-biotin contrast agent within tumors53. Fluorescence imaging of the anti-iNOS probe by targeting the biotin moiety with streptavidin-Cy3 verified higher levels of probe uptake in C6 tumors versus RG2 gliomas, despite the increased perfusion and micro-vascularity detected in the RG2 tumors53.
For this study, an iron oxide-based nanoparticles construct covalently bound to an anti-ELTD1 antibody was used to detect high levels of ELTD1 in the tumor regions of F98 glioma-bearing rats (Figs. 4 and 5). Specificity of the ELTD1 probe seems to be associated with neovascularization.
Conclusion
The results presented strongly suggest that the associative analysis method used in this study was able to accurately identify ELTD1 as a glioma-associated biomarker, possibly due to increased angiogenesis. Both ex vivo and in vivo validation studies indicate that ELTD1 is a biomarker that can be used to confirm or detect the presence and grade of gliomas, particularly high-grade gliomas in humans, and that this biomarker may play an important diagnostic role in addition to currently used markers for gliomas, particularly as a histological marker for identifying vascular proliferation.
Supplementary Material
Lack of cross-reactivity between human and rat ELTD antibodies . Immunohistochemistry (IHC) slides for human GBM and rat F98 gliomas, where human GBM and Rat F98 tumor tissues were stained with either Anti-Human ELTD or Anti-Rat ELTD antibodies. Note only positive staining of human GBM when stained with Anti-Human ELTD antibody, or when Rat F98 tumors are stained with Anti-Rat ELTD antibody. First slide is 10x magnification, second slide is 20X magnification, and third slide is 40X magnification.
Listing of GAMMA predicted associations for the ELTD1 gene. Predicted associations that were tested in this study are shown in ‘red'.
Steps for GAMMA approach. Slide 1 describes the steps in the GAMMA approach. Slide 2 provides descriptive diagrams for gene comparisons (Figure S1), gene function associations (Figure S2), and reported commonalities in peer-reviewed literature (Figure S3).
Increased ELTD1 expression is associated with worse prognosis across grades in gliomas (Rembrandt gene expression database; date of query 6/14/2012). The probability of survival was worse for up-regulated ELTD1 expression, compared to improved probability of survival in down-regulated ELTD1 expression. Total no. tumors = 343 (all glioma group), 173 in up-regulated, 5 in down-regulated, 165 in intermediate. Statistics (from the Rembrandt website) are: Log-rank p-value (for significance of difference of survival between group of samples): Up-Regulated vs. Intermediate = 3.019854E-4; Up-Regulated vs. Down-Regulated = 0.056211295; Down-Regulated vs. Intermediate = 0.2565988951; Up-Regulated vs. all other samples = 1.396275E-4; Down-Regulated vs. all other samples = 0.1333846694; and Intermediate vs. all other samples = 8.958061E-4.
Acknowledgments
We would like to thank Dr. Stephen Lessnick (University of Utah, Huntsman Cancer Institute) for the kind gift of the modified pMMP retrovirus fused with the coding sequences for luciferase and hygromycin (pMMP-LucHygro). We also thank Ms. Charity Njoku (OMRF) for the culturing and maintenance of the F98 cells used in the orthotopic rodent model.
Financial support: Oklahoma Medical Research Foundation (OMRF), the NIH (NIH grant no. 5P20RR020143-07 (JDW)), and Oklahoma Center for the Advancement of Sciences and Technology (OCAST grant: AR092-049 (RAT)).
Biography
Qi Pang, Jinan, China: The authors have identified a novel tumor biomarker, ELTD1, for high grade gliomas via a unique bioinformatics meta-analysis of approximately 18,000 publicly available gene expression profiles. Their protocol identified glioma-associated genes not previously reported in the literature. ELTD1 protein is preferentially expressed by tumor endothelial cells of high grade gliomas. Antibody-based nanoprobes for ELTD1 were synthesized and shown to localize to a F98 rat glioma orthotopic model. Finally, ELTD1 expression was positively correlated with glioma grade in the REMBRANDT and Erasmus databases, associated with decreased survival across all glioma grades, and associated with the mesenchymal GBM subclass (1). This work highlights the utility of comprehensive, unbiased screens for novel glioma biomarkers, for such work opens up new avenues of investigation.
Discovery of novel biomarkers such as ELTD1 may aid in determining more precise subtypes and histopathological classifications of gliomas that potentially have clinical significance in tumor biology and assessing therapeutic response. One crucial future study is to validate ELTD1 protein expression and associated change in patient survival via clinically annotated glioma tissue microarrays to confirm the survival differences observed in REMBRANDT. The positive correlation of ELTD1 mRNA expression across increasing grades of glioma, its origins in the epidermal growth factor seven-transmembrane subfamily, and localized expression to endothelial cells all suggest potential ELTD1 involvement in tumorigenic mechanisms, and further study could yield new therapeutic targets. Such novel biomarkers may also be useful for assessing therapeutic response, especially with newly available targeted therapies. In the era of personalized medicine, research dedicated to systematically characterizing predictive tumor biomarkers is increasingly useful in classifying tumor patients for designing efficient clinical trial assessment of new targeted therapies.
Michael Zorniak, John S. Kuo, Madison, Wisconsin
Footnotes
Disclosure of funding: National Institutes of Health (NIH)
Conflict of Interest: There is no conflict of interest for any of the authors.
In this paper, the authors found ELTD1, a transmembrane protein with a large extracellular domain with EGF-like repeats, to be probably a glioma-associated marker by using of a bioinformatic method they had used before. Then, they confirmed preliminarily that ELTD1 was expressed in human gliomas and the expression of ELTD1 correlated positively with the grading of gliomas through immunohistochemistry (IHC) study. And the results of in vivo MR experiments on rats with F98 glioma was also promising for ELTD1 to be a biomarker of gliomas, especially of high grade gliomas and GBM. The results of the study indicate that ELTD1 could be a new useful marker in the diagnosis and grading of gliomas, especially with molecular MRI. With more further corrobative studies in the future, ELTD1 could be a clinically useful marker for the diagnosis and treatment of gliomas.
Phillips HS, Kharbanda S, Chen R, Forrest WF, Soriano RH, Wu TD, Misra A, Nigro JM, Colman H, Soroceanu L, Williams PM, Modrusan Z, Feuerstein BG, Aldape K. Molecular subclasses of high-grade glioma predict prognosis, delineate a pattern of disease progression, and resemble stages in neurogenesis. Cancer Cell. 2006;9:157-73.
References
- 1.Central Brain Tumor Registry of the United States (CBTRUS) CBTRUS Statistical Report: Primary Brain and Central Nervous System Tumors Diagnosed in the United States in 2004-2007. [Accessed 06/01/11];2011 :54–57. Available at http://www.cbtrus.org/2011-NPCR-SEER/WEB-0407-Report-3-3-2011.pdf.
- 2.Louis DN. Molecular pathology of malignant gliomas. Annu Rev Pathol. 2006;1:97–117. doi: 10.1146/annurev.pathol.1.110304.100043. [DOI] [PubMed] [Google Scholar]
- 3.Gudinaviciene I, Pranys D, Juozaityte E. Impact of morphology and biology on the prognosis of patients with gliomas. Medicina (Kaunas) 2004;40:112–120. [PubMed] [Google Scholar]
- 4.The Cancer Genome Atlas (TCGA) Research Network. Comprehensive genomic characterization defines human glioblastoma genes and core pathways. Nature. 2008;455:1061–8. doi: 10.1038/nature07385. [DOI] [PMC free article] [PubMed] [Google Scholar]
- 5.Riemenschneider MJ, Jeuken JWM, Wesseling P, Reifenberger G. Molecular diagnostics of gliomas: state of the art. Acta Neuropathol. 2010;120:567–84. doi: 10.1007/s00401-010-0736-4. [DOI] [PMC free article] [PubMed] [Google Scholar]
- 6.Jansen M, Yip S, Louis DN. Molecular pathology in adult gliomas: diagnostic, prognostic, and predictive markers. Lancet Neurol. 2010;9:717–26. doi: 10.1016/S1474-4422(10)70105-8. [DOI] [PMC free article] [PubMed] [Google Scholar]
- 7.Colman H, Zhang L, Sulman EP, McDonald JM, Shooshtari NL, Rivera A, et al. A multigene predictor of outcome in glioblastoma. Neuro Oncol. 2010;12:49–57. doi: 10.1093/neuonc/nop007. [DOI] [PMC free article] [PubMed] [Google Scholar]
- 8.Farias-Eisner G, Bank AM, Hwang BY, Appelboom G, Piazz MA, Bruce SS, Sander Connolly E. Glioblastoma biomarkers from bench to bedside: advances and challenges. Br J Neurosurg. 2012;26:189–94. doi: 10.3109/02688697.2011.629698. [DOI] [PubMed] [Google Scholar]
- 9.Silber JR, Bobola MS, Blank A, Chamberlain MC. O(6)-Methylguanine-DNA methyltransferase in glioma therapy: promise and problems. Biochim Biophys Acta. 2012;1826:71–82. doi: 10.1016/j.bbcan.2011.12.004. [DOI] [PMC free article] [PubMed] [Google Scholar]
- 10.Niclou SP, Fack F, Rajcevic U. Glioma proteomics: status and perspectives. J Proteomics. 2010;73:1823–1838. doi: 10.1016/j.jprot.2010.03.007. [DOI] [PubMed] [Google Scholar]
- 11.Wren JD. A global meta-analysis of microarray expression data to predict unknown gene functions and estimate the literature-data divide. Bioinformatics. 2009;25:1694–701. doi: 10.1093/bioinformatics/btp290. [DOI] [PMC free article] [PubMed] [Google Scholar]
- 12.Wren JD, Garner HR. Shared relationship analysis: Ranking set cohesion and commonalities within a literature-derived relationship network. Bioinformatics. 2004;22:191–8. doi: 10.1093/bioinformatics/btg390. [DOI] [PubMed] [Google Scholar]
- 13.Giles CB, Wren JD. Large-scale directional relationship extraction and resolution. BMC Bioinformatics. 2008;9(9):S11. doi: 10.1186/1471-2105-9-S9-S11. [DOI] [PMC free article] [PubMed] [Google Scholar]
- 14.Wren JD. Extending the mutual information measure to rank inferred literature relationships. BMC Bioinformatics. 2004;5:145. doi: 10.1186/1471-2105-5-145. [DOI] [PMC free article] [PubMed] [Google Scholar]
- 15.Nechiporuk T, Urness LD, Keating MT. ELT, a novel seven-transmembrane receptor that is developmentally regulated in the heart. ETL is a member of the secretin family and belongs to the epidermal growth factor-seven-transmembrane subfamily. J Biol Chem. 2001;276:4150–7. doi: 10.1074/jbc.M004814200. [DOI] [PubMed] [Google Scholar]
- 16.Kop EN, Kwakkenbos MJ, Teske GJ, Kraan MC, Smeets TJ, Stacey M, et al. Identification of the epidermal growth factor-TM7 receptor EMR2 and its ligand dermatan sulfate in rheumatoid synovial tissue. Arthritis Rheum. 2005;52:442–50. doi: 10.1002/art.20788. [DOI] [PubMed] [Google Scholar]
- 17.Agrawal A, Pergadia ML, Saccone SF, Lynskey MT, Wang JC, Martin NG, et al. An autosomal linkage scan for cannabis use disorders in the nicotine addiction genetics project. Arch Gen Psychiatry. 2008;65:713–21. doi: 10.1001/archpsyc.65.6.713. [DOI] [PubMed] [Google Scholar]
- 18.Agrawal A, Lynskey MT. Candidate genes for cannabis use disorders: findings, challenges and directions. Addiction. 2009;104:518–32. doi: 10.1111/j.1360-0443.2009.02504.x. [DOI] [PMC free article] [PubMed] [Google Scholar]
- 19.Porto Neto LR, Bunch RJ, Harrison BE, Barendse W. DNA variation in the gene ELTD1 is associated with tick burden in cattle. Anim Genet. 2011;42:50–5. doi: 10.1111/j.1365-2052.2010.02120.x. [DOI] [PubMed] [Google Scholar]
- 20.Lee KT, Byun MJ, Kang KS, Park EW, Lee SH, Cho S, et al. Neuronal genes for subcutaneous fat thickness in human and pig are identified by local genomic sequencing and combined SNP association study. PLoS One. 2011;6:e16356. doi: 10.1371/journal.pone.0016356. [DOI] [PMC free article] [PubMed] [Google Scholar]
- 21.Wallgard E, Larsson E, He L, Hellström M, Armulik A, Nisancioglu MH, et al. Identification of a core set of 58 gene transcripts with broad and specific expression in the microvasculature. Arterioscler Thromb Vasc Biol. 2008;28:1469–76. doi: 10.1161/ATVBAHA.108.165738. [DOI] [PubMed] [Google Scholar]
- 22.Towner RA, He T, Doblas S, Smith N. Assessment of Rodent Glioma Models using Magnetic Resonance Imaging Techniques. In: Chen CC, editor. Advances in the Biology, Imaging and Therapies for Glioblastoma. Rijeka, Croatia: InTech; 2011. pp. 251–272. [Google Scholar]
- 23.Waerzeggers Y, Monfared P, Viel T, Winkeler A, Jacobs AH. Mouse models in neurological disorders: Applications of non-invasive imaging. Biochimica et Biophysica Acta. 2010;1802:819–839. doi: 10.1016/j.bbadis.2010.04.009. [DOI] [PubMed] [Google Scholar]
- 24.Flynn JR, Wang L, Gillespie DL, Stoddard GJ, Reid JK, Owens J, et al. Hypoxia-regulated protein expression, patient characteristics, and preoperative imaging as predictors of survival in adults with glioblastoma multiforme. Cancer. 2008;113:1032–42. doi: 10.1002/cncr.23678. [DOI] [PMC free article] [PubMed] [Google Scholar]
- 25.Zinchuk V, Zinchuk O, Okada T. Quantitative colocalization analysis of multicolor confocal immunofluorescence microscopy images: pushing pixels to explore biological phenomena. Acta Histochem Cytochem. 2007;40:101–111. doi: 10.1267/ahc.07002. [DOI] [PMC free article] [PubMed] [Google Scholar]
- 26.Towner RA, Smith N, Asano Y, He T, Doblas S, Saunders D, et al. Molecular magnetic resonance imaging approaches used to aid in the understanding of angiogenesis in vivo: implications for tissue engineering. Tissue Eng Part A. 2010;16:357–64. doi: 10.1089/ten.tea.2009.0233. [DOI] [PMC free article] [PubMed] [Google Scholar]
- 27.Towner RA, Smith N, Doblas S, Tesiram Y, Garteiser P, Saunders D, et al. In vivo detection of c-Met expression in a rat C6 glioma model. J Cell Mol Med. 2008;12:174–186. doi: 10.1111/j.1582-4934.2008.00220.x. [DOI] [PMC free article] [PubMed] [Google Scholar]
- 28.Towner RA, Smith N, Asano Y, Doblas S, Saunders D, Silasi-Mansat R, et al. Molecular magnetic resonance imaging approaches used to aid in the understanding of the tissue regeneration marker Met in vivo: implications for tissue engineering. Tissue Eng Part A. 2010;16:365–71. doi: 10.1089/ten.tea.2009.0234. [DOI] [PMC free article] [PubMed] [Google Scholar]
- 29.Phillips HS, Kharbanda S, Chen R, Forrest WF, Soriano RH, Aldape K, et al. Molecular subclasses of high-grade glioma predict prognosis, delineate a pattern of disease progression, and resemble stages in neurogenesis. Cancer Cell. 2006;9:157–73. doi: 10.1016/j.ccr.2006.02.019. [DOI] [PubMed] [Google Scholar]
- 30.Verhaak RG, Hoadley KA, Purdom E, Wang V, Qi Y, Hayes DN, et al. Integrated genomic analysis identifies clinically relevant subtypes of glioblastoma characterized by abnormalities in PDGFRA, IDH1, EGFR, and NF1. Cancer Cell. 2010;17:98–110. doi: 10.1016/j.ccr.2009.12.020. [DOI] [PMC free article] [PubMed] [Google Scholar]
- 31.Dozmorov MG, Wren JD. High-throughput processing and normalization of one-color microarrays for transcriptional meta-analyses. BMC Bioinformatics. 2011;12(10):S2. doi: 10.1186/1471-2105-12-S10-S2. [DOI] [PMC free article] [PubMed] [Google Scholar]
- 32.Dozmorov MG, Giles CB, Wren JD. Predicting gene ontology from a global meta-analysis of 1-color microarray experiments. BMC Bioinformatics. 2011;12(10):S14. doi: 10.1186/1471-2105-12-S10-S14. [DOI] [PMC free article] [PubMed] [Google Scholar]
- 33.Daum JR, Wren JD, Daniel JJ, Sivakumar S, McAvoy JN, Potapova TA, et al. Ska3 is required for spindle checkpoint silencing and the maintenance of chromosome cohesion in mitosis. Curr Biol. 2009;19:1467–72. doi: 10.1016/j.cub.2009.07.017. [DOI] [PMC free article] [PubMed] [Google Scholar]
- 34.Lupu C, Zhu H, Popescu NI, Wren JD, Lupu F. Novel protein ADTRP regulates TFPI expression and function in human endothelial cells in normal conditions and in response to androgen. Blood. 2011;118:4463–71. doi: 10.1182/blood-2011-05-355370. [DOI] [PMC free article] [PubMed] [Google Scholar]
- 35.Clemmensen SN, Bohr CT, Rorvig S, Glenthoj A, Mora-Jensen H, Wren JD, et al. Olfactomedin 4 defines a subset of human neutrophils. J Leukoc Biol. 2011;91:495–500. doi: 10.1189/jlb.0811417. [DOI] [PMC free article] [PubMed] [Google Scholar]
- 36.Goel R, Muthusamy B, Pandey A, Prasad TS. Human protein reference database and human proteinpedia as discovery resources for molecular biotechnology. Mol Biotechnol. 2011;48:87–95. doi: 10.1007/s12033-010-9336-8. [DOI] [PubMed] [Google Scholar]
- 37.Jensen RL. Brain tumor hypoxia: tumorigenesis, angiogenesis, imaging, pseudoprogression, and as a therapeutic target. J Neurooncol. 2009;92:317–35. doi: 10.1007/s11060-009-9827-2. [DOI] [PubMed] [Google Scholar]
- 38.Gillespie DL, Flynn JR, Ragel BT, Arce-Larreta M, Kelly DA, Tripp SR, et al. Silencing of HIF-1alpha by RNA interference in human glioma cells in vitro and in vivo. Methods Mol Biol. 2009;487:283–301. doi: 10.1007/978-1-60327-547-7_14. [DOI] [PubMed] [Google Scholar]
- 39.Ragel BT, Couldwell WT, Gillespie DL, Jensen RL. Identification of hypoxia-induced genes in a malignant glioma cell line (U-251) by cDNA microarray analysis. Neurosurg Rev. 2007;30:181–7. doi: 10.1007/s10143-007-0070-z. [DOI] [PubMed] [Google Scholar]
- 40.Gillespie DL, Whang K, Ragel BT, Flynn JR, Kelly DA, Jensen RL. Silencing of hypoxia inducible factor-1α by RNA interference attenuates human glioma cell growth in vivo. Clin Cancer Res. 2007;13:2441–8. doi: 10.1158/1078-0432.CCR-06-2692. [DOI] [PubMed] [Google Scholar]
- 41.Rong Y, Hu F, Huang R, Mackman N, Horowitz JM, Jensen RL, et al. Early growth response gene-1 regulates hypoxia-induced expression of tissue factor in glioblastoma multiforme through hypoxia-inducible factor-1-independent mechanisms. Cancer Res. 2006;66:7067–74. doi: 10.1158/0008-5472.CAN-06-0346. [DOI] [PMC free article] [PubMed] [Google Scholar]
- 42.Jensen RL. Hypoxia in the tumorigenesis of gliomas and as a potent target for therapeutic measures. Neurosurg Focus. 2006;20:E24. doi: 10.3171/foc.2006.20.4.16. [DOI] [PubMed] [Google Scholar]
- 43.Jensen RL, Ragel BT, Whang K, Gillespie D. Inhibition of hypoxia inducible factor-1alpha (HIF-1alpha) decreases vascular endothelial growth factor (VEGF) secretion and tumor growth in malignant gliomas. J Neurooncol. 2006;78:233–47. doi: 10.1007/s11060-005-9103-z. [DOI] [PubMed] [Google Scholar]
- 44.Sibenaller ZA, Etame AB, Ali MM, Barua M, Braun TA, Casavant TL, et al. Genetic characterization of commonly used glioma cell lines in the rat animal model system. Neurosurg Focus. 2005;19(4):E1–E9. doi: 10.3171/foc.2005.19.4.2. [DOI] [PubMed] [Google Scholar]
- 45.Barth RF, Kaur B. Rat brain tumor models in experimental neuro-oncology: the C6, 9L, T9, RG2, F98, BT4C, RT-2 and CNS-1 gliomas. J Neurooncol. 2009;94:299–312. doi: 10.1007/s11060-009-9875-7. [DOI] [PMC free article] [PubMed] [Google Scholar]
- 46.Barth RF. Rat brain tumor models in experimental neuro-oncology: the 9L, C6, T9, F98, RG2 (D74), RT-2 and CNS-1 gliomas. J Neurooncol. 1998;36:91–102. doi: 10.1023/a:1005805203044. [DOI] [PubMed] [Google Scholar]
- 47.Asanuma T, Doblas S, Tesiram YA, Saunders D, Cranford R, Yasui H, et al. Visualization of the protective ability of a free radical trapping compound against rat C6 and F98 gliomas with diffusion tensor fiber tractography. J Magn Reson Imaging. 2008;28:574–87. doi: 10.1002/jmri.21474. [DOI] [PubMed] [Google Scholar]
- 48.Doblas S, He T, Saunders D, Pearson J, Hoyle J, Smith N, et al. Glioma morphology and tumor-induced vascular alterations revealed in seven rodent glioma models by in vivo magnetic resonance imaging and angiography. J Magn Reson Imaging. 2010;32:267–75. doi: 10.1002/jmri.22263. [DOI] [PMC free article] [PubMed] [Google Scholar]
- 49.Sipkins DA, Cheresh DA, Kazemi MR, Nevin LM, Bednarski MD, Li KC. Detection of tumor angiogenesis in vivo by alphaVnbeta3-targeted magnetic resonance imaging. Nat Med. 1998;4:623–626. doi: 10.1038/nm0598-623. [DOI] [PubMed] [Google Scholar]
- 50.Kiessling F, Huppert J, Zhang C, Jayapaul J, Zwick S, Woenne EC, et al. RGD-labeled USPIO inhibits adhesion and endocytototic activity of alpha v beta3-integrin-expressing glioma cells and only accumulates in the vascular tumor compartment. Radiology. 2009;253:462–9. doi: 10.1148/radiol.2532081815. [DOI] [PubMed] [Google Scholar]
- 51.Zhang D, Feng XY, Henning TD, Wen L, Lu WY, Pan H, et al. MR imaging of tumor angiogenesis using sterically stabilized Gd-DTPA liposomes targeted to CD105. Eur J Radiol. 2009;70:180–9. doi: 10.1016/j.ejrad.2008.04.022. [DOI] [PubMed] [Google Scholar]
- 52.He T, Smith N, Saunders D, Doblas S, Watanabe Y, Hoyle J, et al. Molecular MRI assessment of vascular endothelial growth factor receptor-2 in rat C6 gliomas. J Cell Mol Med. 2011;15:837–849. doi: 10.1111/j.1582-4934.2010.01091.x. [DOI] [PMC free article] [PubMed] [Google Scholar]
- 53.Towner RA, Smith N, Doblas S, Garteiser P, Watanabe Y, He T, et al. In vivo detection of inducible nitric oxide synthase in rodent gliomas. Free Radic Biol Med. 2010;48:691–703. doi: 10.1016/j.freeradbiomed.2009.12.012. [DOI] [PubMed] [Google Scholar]
Associated Data
This section collects any data citations, data availability statements, or supplementary materials included in this article.
Supplementary Materials
Lack of cross-reactivity between human and rat ELTD antibodies . Immunohistochemistry (IHC) slides for human GBM and rat F98 gliomas, where human GBM and Rat F98 tumor tissues were stained with either Anti-Human ELTD or Anti-Rat ELTD antibodies. Note only positive staining of human GBM when stained with Anti-Human ELTD antibody, or when Rat F98 tumors are stained with Anti-Rat ELTD antibody. First slide is 10x magnification, second slide is 20X magnification, and third slide is 40X magnification.
Listing of GAMMA predicted associations for the ELTD1 gene. Predicted associations that were tested in this study are shown in ‘red'.
Steps for GAMMA approach. Slide 1 describes the steps in the GAMMA approach. Slide 2 provides descriptive diagrams for gene comparisons (Figure S1), gene function associations (Figure S2), and reported commonalities in peer-reviewed literature (Figure S3).
Increased ELTD1 expression is associated with worse prognosis across grades in gliomas (Rembrandt gene expression database; date of query 6/14/2012). The probability of survival was worse for up-regulated ELTD1 expression, compared to improved probability of survival in down-regulated ELTD1 expression. Total no. tumors = 343 (all glioma group), 173 in up-regulated, 5 in down-regulated, 165 in intermediate. Statistics (from the Rembrandt website) are: Log-rank p-value (for significance of difference of survival between group of samples): Up-Regulated vs. Intermediate = 3.019854E-4; Up-Regulated vs. Down-Regulated = 0.056211295; Down-Regulated vs. Intermediate = 0.2565988951; Up-Regulated vs. all other samples = 1.396275E-4; Down-Regulated vs. all other samples = 0.1333846694; and Intermediate vs. all other samples = 8.958061E-4.